HAL Id: insu-00617830
https://hal-insu.archives-ouvertes.fr/insu-00617830
Submitted on 30 Aug 2011
HAL is a multi-disciplinary open access
archive for the deposit and dissemination of
sci-entific research documents, whether they are
pub-lished or not. The documents may come from
teaching and research institutions in France or
abroad, or from public or private research centers.
L’archive ouverte pluridisciplinaire HAL, est
destinée au dépôt et à la diffusion de documents
scientifiques de niveau recherche, publiés ou non,
émanant des établissements d’enseignement et de
recherche français ou étrangers, des laboratoires
publics ou privés.
Characterization of an internal slope movement
structure by hydrogeophysical surveying
Herve Jomard, Thomas Lebourg, Stéphane Binet, Emmanuel Tric, M.
Hernandez
To cite this version:
Herve Jomard, Thomas Lebourg, Stéphane Binet, Emmanuel Tric, M. Hernandez. Characterization
of an internal slope movement structure by hydrogeophysical surveying. Terra Nova, Wiley-Blackwell,
2007, 19 (1), pp.48-57. �10.1111/j.1365-3121.2006.00712.x�. �insu-00617830�
Characterization of an internal slope movement structure by
hydrogeophysical surveying
H. Jomard,1 T. Lebourg,1 S. Binet,2 E. Tric1 and M. Hernandez1
1UNSA, Labo. Ge´osciences Azur, UMR 6526, 250 r. A. Einstein, 06560 Valbonne, France; 2EA2642 Ge´osciences: Déformation, E coulement, Transfert, 16 Route de Gray, 25030 Besancon, France
ABSTRACT
A hydrogeophysical study was carried out by a water controlled injection within a landslide situated on an active part of the La Clapière landslide foot (Alpes Maritimes, France). Coupling of both real-time geophysical and hydrological follow ups allowed the representation and quantification of the surface water drainage in space and time within the slipped mass. Thus, 30% of the injected water is quickly drained by a complex slipping surface meanly situated at 10-m depth. The transit time between injection and outflow of the water allowed an overloading of about 10 m3 (i.e. 10 tons) comparable with classical rain events in the area. This weight and the
associated
interstitial pressures increase have not led to any movements asking for the origin of the water volumes which could induce destabilizations. This experiment enabled an accurate redefinition of the internal slope structure and the understanding of the dynamics of the slipped mass with a surface hydraulic request.Introduction
The principal driving force of slope movements is generally considered to be gravity, with the main triggering factor being the increase of pore pressures by the presence of water contained in fractures (Terzaghi, 1950; Noverraz et al., 1998). The localization of the main flow paths and saturated zones is thus a fundamental
stage of the slope evolution before and after failure. Various methods are classically employed in order to locate and study water in sliding and non-sliding rock masses.
1 Geological and morphological field studies allow the determination and the localization of mechanical discontinuities (faults, fractures, etc.) and lithological discontinuities guiding the water drainage (Lebourg and Fabre, 2000; Guglielmi et al., 2005).
2 Hydrogeological studies allows the determination of the origin of hydrous flows and their relationships to the release and the acceleration of movements (Bonzanigo et al., 2001; Tullen, 2002; Cappa et al., 2004; Onda et al., 2004; Guglielmi et al., 2005).
3 Electrical surveying can be used to determine the depth and geometry of sliding surfaces (Bogoslowsky and Ogilvy, 1976; McCann and Forster, 1990; Caris and Van Asch, 1991; Godio and Bottino, 2001; Lapenna et al., 2003; Lebourg et al., 2003; Bichler et al., 2004), and the localization of water flow paths (French and Binley, 2004).
These methods are frequently coupled for landslide studies (Caris and Van Asch, 1991; Maquaire et al.,2001; Agnesi et al., 2005). In order to better approach the dynamical process involved in landslides, we need to understand the evolution in time of the groundwater flow circulation versus spatial displacements. At this time, specific and uncoupled data acquisition does not allow for carrying out a real dynamic relation between them. For the comprehension of landslides, only a small number of laboratory studies have linked the dynamical relation between different methods of investigation (Tohari et al., 2000; Wang and Sassa, 2003; Moriwaki et al., 2004).
A first hydrological/geophysical study has been performed in a secondary landslide located at the toe of the La Clapière landslide to demonstrate the spatio-temporal repartition of water in the unstable slope and its effect on landslide acceleration (Lebourg et al., 2005). This study highlighted the geometrical relations between the main water flow paths and the slope structure and allowed the definition of two types of water circulation: spatially distributed in the form of drains and perched watertable. It also showed the relations between tectonic structure, drainage and slope activation. The temporal geophysical monitoring carried out between March and July 2003 on this slide showed the relative importance of these two main water flowpaths in the slope at the scale of a month.
Nevertheless, this follow up raises two problems for the comprehension of the landslide dynamics:
1 We have no active control on external conditions (precipitations, snow melting, etc.): this monitoring is qualified as passive.
2 The monitoring yields information about the slope response to the water supply but not the response of the landslide itself.
Those problems are first related to the lack of coupling of the methods employed and second to the spatial and temporal acquisition constraints. Therefore, a new experiment on the secondary landslide has been aimed to establish a link between these passive methods and the principal active parameter in slopes stability, water. This
experiment has consisted in developing a methodology for a controlled injection of fluid at the secondary landslide head combined with a:
1 natural and artificial hydrological tracing (Mudry, 1990; Dzikowski, 1995; Guimera and Carrera, 2000; Sawada et al., 2000; Tullen, 2002);
2 time-lapse geophysical survey (Descloitres et al., 2003; French and Binley, 2004; Guérin et al., 2004; Lebourg et al., 2005);
3 real-time geodetic monitoring using an accurate precision tacheometer (Gunzburger et al., 2005). Our objectives are first to establish a dynamical link between these investigation methods and second, to show the possibility of carrying out a hydrological assessment in correlation with the imaged structure of a landslide and, if possible, to approach the necessary conditions for triggering a movement.
Geological and Hydrogeological Settings, The La Clapière landslide
The La Clapière landslide is a large unstable slope which has been monitored since 1982 (Follacci, 1987, 1999) and is located in the south-east French Alps, about 80 km north of Nice (Fig. 1a). This landslide, which mobilizes a huge volume (55 · 106 m3) of metamorphic bedrock (Follacci, 1987), is located on the NE side of the NW-SE flowing Tinée river, near the town of Saint-Etienne de Tinée (France). Elevation of surrounding crests and peaks reach 3000 m. From the geological point of view, the studied zone is situated in the Upper Tine´e valley which represents the northwestern part of the Argentera external Massif and limits the metamorphic basement from its welded and uncoupled sedimentary cover (Faure-Muret, 1955). The whole La Clapiere slope is occupied by two mica gneisses of the Variscan Argentera-Mercantour massif (Bogdanoff and Ploquin, 1980) and can be separated into three entities (Cappa et al., 2004):
1 A stable internal zone where the foliation has a strong dip varying from 60_ to 80_ towards the interiors of the slope.
2 A 200-m wide transitional zone dipping towards N030_ where foliation is gradually rotated to the horizontal and showing several lines of evidence for incipient instability (extension cracks, toppled blocks).
3 A slipped zone where displacements towards the valley are important. The surface of the landslide is quite irregular because of numerous rockfall accumulations, tilted terraces and internal cracks. The La Clapière slope is affected by three families of faults: N10–30_E; N90_E and N110–140_E (Ivaldi et al., 1991). The major fractures are subvertical N020 faults intersecting the whole slope far away from the active landslide. The displacements measured by the 2D French equipment ministry monitoring system (Follacci, 1999) have also on average a N20 orientation showing the guiding role of faults localizing landslide deformations.
The geometry of the sliding surface is difficult to understand. Its depth is thought to be approximately 100– 200 m but no geophysical study has been devoted to confirm this until now.
From the hydrogeological point of view, the area is characterized by several springs (perennial and temporary). Some of these springs flow directly out from the basement along faults with various orientations or in the weathered superficial formation. A study of the water chemistry (Guglielmi et al., 2000; Binet et al., 2004; Binet, 2006) suggests the presence of two main flowpaths in the landslide slope:
1 deep flow through fractured gneiss and low permeability Triassic deposits pinched under the foot of the landslide;
2 a more superficial flow through a more permeable fractured basement with a complex flow path guided inparticular by the internal deformation of the landslide. Differences in the slope drainage have been correlated with different scenarios and mechanical behaviours of the landslide by Cappa et al. (2004): sliding accelerations occurduring snow melting period and slow speeds during low water-level periods (Follacci, 1999).
The studied secondary landslide
The foot of the landslide is an active area where a rotational landslide(Table 1) occurred in 1995 in the fluvio-glacial deposits overlying the gneiss (Fig. 1b). This zone is cut by N170 dextral faults which continue through the Tinée River alluviums (Lebourg et al., 2005) and divide the entire unstable rock zone. In particular, one of those faults corresponds to the East limit of the studied landslide as it shifts fluvio-glacial deposits, and therefore gives, in the superficially slipped part, a sufficient sediment thickness to allow a slide movement. The displacement recording systems show the advancing foot following a N170 direction which demonstrates the guiding played by these faults.
The hydrogeology of the zone, studied with hydrogeochemistry (Binet et al., 2004) and imaged by 3D geophysical surveying (Lebourg et al., 2005), shows various types of springs draining the slope. A significant share of water comes from a deep tectonically guided subsoil drain, with which comes to mix surface waters, fallen on the slide surface, and drained partly high. A significant part of the water is drained by the spring 15 (S15, Fig. 1) located at the foot of the small landslide. This geometry with a perched watertable and a spring at the foot of the landslide is similar to the observations carried out on a regional scale (Guglielmi et al., 2002). The interest of the studied zone is then, to present at reduced scale, some mechanisms similar to those existing on a large scale at the La Clapière landslide level (Cappa et al., 2004); namely a toppling zone strongly fractured and
highly draining. In the case of the secondary landslide, the toppling movement affecting the gneissic substratum is confirmed by the displacement measurements taken during a 1-year period on this landslide (Binet et al., 2004; Binet, 2006). Toppling was not observed in surface because of the contrasting tills granular mechanical behaviour that leads to a more diffuse deformation. However, the origin of the deformation is different for the two movements in the case of:
1 the entire La Clapière landslide, it is the consequence of generalized slope deformation on a long time scale (Bigot-Cormier et al., 2005);
2 the encased slip, it is the result of the deformation induced during the overall movement of the La Clapière landslide on a much more reduced time scale (Binet et al., 2004).
Experimental Protocol: Method and Processing
The studied site was also selected because of its relatively small size. This slide is sufficiently significant not to be a simple superficial landslide but to reflect larger-scale mechanisms. It is therefore sufficiently small for us to be able to place a large number of sensors and measurement devices relatively easily (Fig. 2).
Injection protocol
The choice of the injection zone on the principal sliding surface was carried out with the objective of testing the permeability of principal fractures, and to inject water into the slipped mass. We dug a 4-m length trench 1-m wide and 1-m high. The pumping tests were carried out outside the slipped zone in order to not chemically pollute the site with the Tinée river water. The height of the injection zone is 43 m above the Tine´e River and the constant flow of 2.23 ± 0.15 L s)1. The injection lasted 5 h.
Hydrological acquisition dispositive
Temporal monitoring of the spring response to the injection (S15, Fig. 3) draining the landslide foot allows a study of the hydrogeologic characteristics of the slope. At the time of the injection there is no sign of the presence of a perched watertable (prolonged low water level). The flow was manually measured once per hour at all the water exit points (S15, S16, S17, Fig. 1) present at the foot of the slope in order to do a hydrological statement. All the data are presented in Binet (2006) and Binet et al. (in press). An artificial tracing was carried out, simultaneously
with the water injection (2.23 L s)1 during 5 h) in the main trench of the landslide. A total of 150 g of fluorescein was injected into the first 15 min of the injection (from 9 h and 30 min to 9 h and 45 min). Monitoring of the water fluorescein concentration was then carried out. The calculation of the restored fluorescein flow as well as the fluorescein restitution curve through time yields information about the transportation of water in this slope (channeled flow, diffuse, response time, etc.). These measurements were carried out at the Besanc¸on laboratory with a luminescence spectrometer LS30 from Perkin Elmer (Wellesley, MD). Results and interpretations are discussed in the following sections.
Geophysical acquisition, calibration and processing
We installed a line of 48 electrodes (profile), with 3 m spacing between each electrode, within the landslide (Fig. 2) in a longitudinal arrangement (from top to bottom). The profile has an overall length of 141 m. The 2D resistivity data were recorded using the Syscal R1 Plus imaging system (IRIS Instrument, Orle´ans, France). The transept installation required some modifications compared with traditional profiles because we are on a mass whose movement can be significant; indeed we systematically left 1 m of free cable between each electrode so as to prevent possible differential movements. The type of selected survey takes into account several geometrical and temporal constraints. Indeed, the grid must be sufficiently precise in order to image the structures correctly; it must also be sufficiently deep to exceed the sliding surface, estimated to be at a depth of between20 and 30 m (Lebourg et al., 2005). Coupling accurate measurement and a sufficient investigation depth imply a significant number of measurements. Moreover, carrying out a great number of measurements takes time, hence electrical properties of the slope may fluctuate between the first and last acquisition of a profile. To satisfy those equirements, we carried out a pole–dipole survey using 48 electrodes plus an injection pole and we have limited the duration of acquisition to 30 min, which corresponds to a maximum of 768 measurements. The measurement density is stronger in the higher part of the profile (3-m horizontal resolution, 1-m vertical resolution down to 15-m depth and 2-15-m vertical resolution fro15-m 15- to 41-15-m depth) to reach the best precision of surface water circulation.
The measurement sequences were made in the downstream direction so that the start of each profile is carried out in the injection zone. The installation of the profile was made 2 months before the beginning of the injection to determine the most hydraulically stable period to begin the injection and to acquire a basic profile as stable as possible.
The interpretation of electrical tomography profiles in terms of presence or absence of water requires an evaluation and calibration of resistivity values directly on rock samples. Our measurements give us the following indications:
1 Morainic formations (dry or without water) characterized by large resistivity variability (from about 200–3000 Xm). We observe a strong correlation between water content and measured resistivities. With increasing water content, resistivities decreases strongly and are systematically lower than 100 Xm.
2 The gneissic substratum is characterized by high resistivity values (higher than 3000 Xm). The weathered zones of this formation show lower resistivity: (1) 200 Xm for saturated weathered gneisses and(2) around 3000 Xm for dry weathered gneisses.
Data processing
The field data depicted as contoured pseudoresistivity sections (Edwards, 1977; Griffiths and Barker, 1993), were inverted using the software RES2DINV written by Loke (1997). In order to limit as much as possible the error related to the inversion of the electric tomography data, we carried out the same treatment for each batch of gathered data:
1 each data whose resistivity exceeds 7000 Xm (maximum resistivity measured on samples) and each data including a non-negligible factor of quality is systematically withdrawn from all the data files before inversion; 2 the inversion is carried out with the same parameters for each profile;
3 the profiles are recorded at the end of four iterations in order to guarantee the quality of the measurements. A total of 14 electrical profiles were performed during this study. Only five of them were selected in order to reach the best measurements and quality of interpretations (Table 2). We also selected those because they correspond to the significant periods of slope response to the injection: profiles 1 (Pd1) and 3 (Pd3) (during the injection) and the post-injection profiles 8 (Pd8) and 9 (Pd9).
Geodetic monitoring dispositive
The routine tacheometrical follow up of secondary landslide has now existed for more than 1 year (Binet et al., 2004). We thus used and supplemented the devices already in places (14 targets, Fig. 2) in order to follow the deformations which the water injection could have induced. Two concrete pillars were built on an alluvial terrace of the southwest bank Tinéeriver, to be used as station. Measurements are taken from one of them (Fig. 2). For the calibration, the second concrete pillar is installed on the alluvia considered as stable. One carries out an indirect levelling on short ranges: 150 m of distance. The traditional corrections are applied for the data processing (Milles and Lagofun, 1999). The absolute precision of taken measurements and the effectiveness of the corrections are tested on the reference target. During the week of the experience, after corrections of atmospheric changes and calibrations, the precision reach by the geodetic system correspond in ±0.2 mm with 100 m for a measurement in x and y and ±0.5 mm in altitude.
Results
Hydrological results
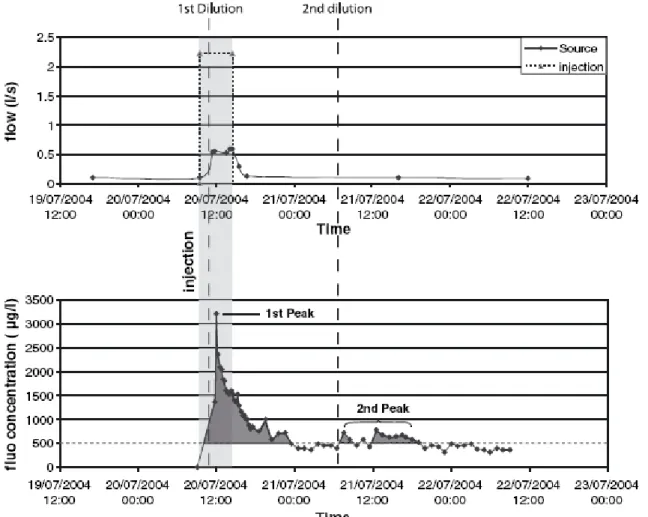
Injected volume, transit time and refund rate The water injection on the summit escarpment of the slide lasted 288 min by maintaining a constant flow of 2.23 ± 0.15 L s)1. Total volume injected is thus 38.6 ± 2.6 m3. The transit time between the beginning of the injection and the water arrival to the S15 is 78 min. In the same way, we observe, from flow measurements that the spring recovers the initial flow rate 140 min after stopping the pump (Fig. 3). Flow measurements on S15 allow recovering 11.6 m3 of injected water, which correspond to 30% of the injected water. In the same way, part of the water injected is arisen by various discharge system of very low flow while another part could be lost in the Tinée alluvia.
The course of part of the water injected on the surface remained very shallow as it is arisen twice in the landslide, on the level of each great wrenching, to lose a few meters further in the following sliding surface. The slope water was thus drained by zones of high permeability contrasts corresponding to the sliding surfaces. The sliding surfaces play the role of drains with a fast transfer of water injected.
Fluorescein concentration
Fluorescein was injected during the first 15 min in order to track the first part of the water injection. The recovery rate of S15 was about 15% of the total 30% recovered injected water for all the springs (Fig. 3). This rate is weak compared with the covered distance (about 100 m); it can be explained by the complexity of the sliding surface and by the many points of injection/reinjection observed on the ground. Nevertheless, we observe a fast and synchronous fluorescein response to the increase in the spring flow. First, the concentration increased to 3200 lg L)1 in 1 h and 30 min, then decreased to values lower than 500 lg L)1 in 12 h, this shape of the fluorescein curve is characteristic of a preferential drainage (Miyazaki,1993). In this granular material, the water drain is interpreted as the sliding surface, which confirms the observations of the flows. On the second part of the curve, we observe a significant variation (300 lg L)1) which corresponds to the delayed arrival of the tracer. The
moraine matrix is relatively permeable; part of the water can infiltrate under the slipped zone and join the water of the fractures underneath (deep watertable). This second circulation is supported by the presence of fluorescein in piezometer 1 (Fig. 2) and validates the link between the slope water and the alluvia.
Interpretations
The acquired hydrological data highlights the draining role of the fractures and the sliding surface, even in a relatively permeable material like the fluvio-glacial deposits. The transfer times of water injected within the slide is very short (78 mn) and water pressures very quickly evacuated. However, part of the water was infiltrated under the slip or was stored before joining S15, under the slipped zone. The water which followed this path arrives partly at the source the second day (second restitution peak, Fig. 3) or passes directly in the Tinée alluvia (piezometer 1).
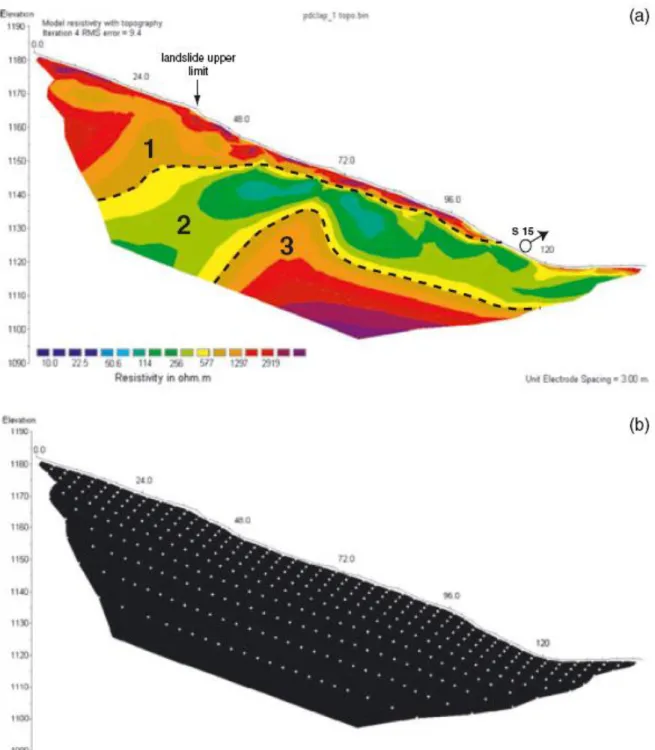
The next part of this paper describes evidence for the existence of these two underground flowpaths (double fluorescein peak, Fig. 3); and the visualization of the ground water distribution by electrical tomography in order to locate the escapes or storage zones of water in this slope. Temporal geophysical response of slope Electrical tomography results The first profile Pd0 (Fig. 4a), performed before the injection, is taken as the reference profile. Figure 4(b) represents the geometric accuracy of the inverted profiles after calculation.
This profile can be broken into three distinct zones (Fig. 4a):
1 zone 1: has resistivity values higher than 500 Xm. This zone is characterized by substratum outcrops and slipped fluvio-glacial material;
2 zone 2: has a highly variable resistivities between 40 and 500 Xm. This is the signature of a saturated zone in the form of a perched watertable including weathered gneisses and fluvio-glacial deposits which can only be distinguished by the surface geological mapping (Lebourg et al., 2005). The discharge system of this watertable is marked by S15;
3 zone 3: has resistivity values higher than 500 Xm interpreted from geological observations to be the gneissic substratum (Lebourg et al., 2003, Jomard et al., 2005).
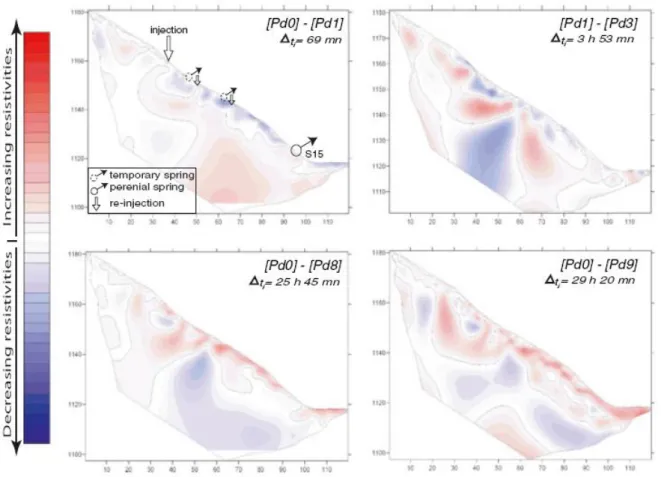
To quantify and observe the consecutive variations of resistivity to the water injection, we propose to show results in the form of inversed matrices subtraction (Fig. 5), where X and Y are the coordinates of the measurement points on the profile, q the associated resistivity value, t the acquisition hours and t = t1 - t2 (Eq. 1)
This representation has the advantage of showing in a simple way the positive or negative variations of resistivity. The subtraction of the Pd1 profile to the reference profile Pd0 presents the evolution of the resistivities 1 h after the beginning of the injection.
The volume of infiltrated water at this moment is approximately 8 m3. Ground observations and hydrological measurements show that the injected water is already flowing to the slope base (flow increase of S15 and fluorescein peak). Saturation zones are clearly defined in the upper part of the profile and confined to the sliding area. The thickness of these does not exceed 15 m. The drainage is superficial and effective implying the presence of a succession of strong permeability contrast surfaces. The correlation of water springs with the mapped sliding surfaces shows that the drainage is carried out through the slip surfaces. The assumption of the simple rotational slip is thus not valid (Lebourg et al., 2005). A more complex sliding surface geometry where the water exits on sliding surfaces toe and re-injects on sliding surfaces head (Figs 5 and 6) should be considered. The correlation with the profiles subtraction results is very good and allows the quality validation of the profiles carried out. The subtraction of the Pd3 profile to the basic profile Pd1 yields the evolution of resistivities starting from the acquisition of the first profile. We found the same characteristics of superficial drainage with an increase of the medium saturation characterized by a continuous decrease of the resistivities. This profile also shows a localized strong fall of resistivity towards the depth resulting in the loss of part of the water injected. This indicates a vertical variation of the permeability, which could be associated with a geological discontinuity.
The subtraction of the Pd8 profile to the basic profile Pd0 yields the evolution of the resistivities 1 day after the end of the injection. The flow of S15 returned to the normal and the profile shows, by an increase of resistivities, that the superficialsaturation is finished. However, indepth saturation, although less significant, is always present and tends to be diffused towards the downstream side. Indeed, this diffusion corresponds to the second fluorescein increase observed the day after the injection to S15. Water is diffused by gravity and mixes with the watertable feeding S15 without increasing the flow.
Subtraction of the Pd9 profile to the basic profile Pd0 presents the final evolution of the water-injected dissipation within the lower saturated zone.
Interpretations
Geophysical tomography is used to follow the two flows highlighted by hydrological measurements through time. The surface flow is carried out in a section not exceeding 10-m thickness. Water accumulations are significant on re-injection and exit points observed on the ground during the experiment. These zones correspond
to the sliding surfaces of the landslide. The increase in superficial saturation through time is followed by an indepth loss of injected water. While the surface zone is quickly drained by the sliding surface, the water infiltrated towards the depth is spread slowly, by gravity, in the deep watertable (deeper than 20 m).
Discussion and Conclusion
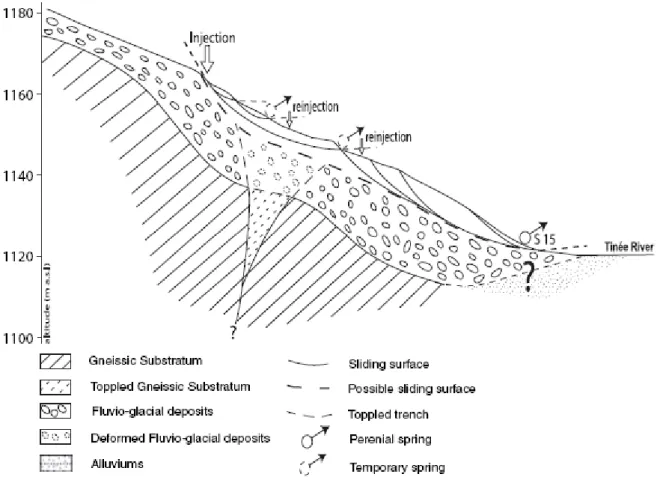
The hydrogeophysical acquisition provides coherent information, by acquisition and correlation of two complementary signals, about the draining properties of the unstable rock mass in space and time. With this hydrogeophysical approach, we highlighted information on the geometry and the dynamics of the slip. The first highlighted structure is the failure slip surface; this surface guides the flow of the injected water. This sliding surface is at maximum 10-m depth, is not continuous and appeared as a succession of upstream failure surfaces (Fig. 6). These results are not in agreement with those published by Lebourg et al. (2005) who suggested the presence of a continuous sliding surface between 20- and 30-m depth in the case of a simple rotational landslide. According to our observations and measurements (Figs 4 and 5),Lebourg et al. (2005) should have imaged the deep watertable present within the slope. However, the presence of an existing shrouding continuous failure is not excluded (Fig. 6) butthe obtained single fluorescein peak (Fig. 3) and the correlation of accurate geophysical data (Fig. 5) with surface observations argue against its existence. The in-depth loss of water, observed by tomography and leading to the second fluorescein peak implies the presence of a lower permeability zone towards the depth. Surface observations and tacheometrical measurements (Binet et al., 2004; Binet, 2006) demonstrate the presence of toppled trenches within the gneissic bedrock perpendicular to the line of greater slope (Fig. 6). Those toppled structures could be at the origin of the studied slip (Binet et al., 2004; Binet, 2006). These trenches are also observed on a large scale on the whole of the slope of La Clapière giving the mobilized rock formations much more permeable by creation of pores and open fractures (Cappa et al., 2004). This permeability increase because of the formation of trenches can explain the rather fast in-depth loss of water, its temporary storage and its slow diffusion by gravity in the deep watertable. view and its possible relationship to the actuation of the slipped mass are given below. The injection shows that failure surfaces are used as draining surfaces and then as short-cut for the deep watertable alimentation. Indeed, 30% of injected water was quickly drained by S15. Seventy per cent of remaining water was thus shared between the other discharge system S16– S17, the alluvia (piezome´tres 1-2-3) and the mix within the deep watertable. This mix, not leading to an increasing flow to S15 (Fig. 3) can thus represent only one relatively low infiltrated volume. Superficial infiltrations, shortcut by surface fractures and the sliding surface, thus do not seem to allow the increase of the deep watertable level. We have tried through this experiment to induce a movement of the landslide to quantify the contribution of water and thus the slope saturation necessary to its actuation. But the tacheometrical follow up carried out during the injection was not able to detect a movement on any of the 14 targets laid out on the slope. The only recordedmovement, following the slope axis, maximum 0.0129 m on target 11 which is situated outside the landslide, corresponds to the daily average movement of the La Clapière Landslide (Follacci, 1999). The injected water on the failure surface of the landslide was drained too fast to cause a sufficient pore water pressures increase in the slope and thus, to allow a perceptible acceleration of this landslide. This injection experiment indicates that the water flowing on the sliding surface cannot be the cause of a movement of the slipped mass in the short term. Which conditions could be at the origin of accelerations and movement of the landslide? In the short-term movements consecutive to moderate rain events cannot be caused by the water drained on the sliding surfaces. Thus, the origin of these movements must be the consecutive overloading due to water infiltration in the slipped volume. Indeed, taking into account the landslide surface (<2500 m2) and mean precipitation values of 10 mm m)2 (Cappa et al., 2004) the volume of water reaching the landslide surface will not exceed 25 m3. With an estimated permeability of the geological material of 1.9 · 10)5 m s)1 (Binet, 2006; Binet et al., in press) and without taking into account the average slope angle, the duration of the rain and the evapotranspiration, the infiltrated water and then the consecutive overload should not exceed 17 m3. In the same way, the water stored in the landslide during the injection before recovering the first flow on S15 is about 10.4 m3 (2.23 L s)1 during 78 min). The volumes and the consecutive overload in both cases (injection and precipitations) are comparable. As any movement was recorded by the geodetic monitoring, the overload consecutive to a moderate rain event on the studied landslide does not seem to be able to lead to a movement, in the case of the already existing landslide. In the medium term exceptional precipitations on long periods (up to 200 mm m)2 in 1 h were recorded during the millennial flood of the Var in 1994) or more probably the water felt in the overall slope and drained in depth by fractures and faults (Lebourg et al., 2005) in rising periods (snow melt or rains onto the massif), will represent volumes definitely more significant. Those volumes could be at the origin of more significant overloads in one hand and of the increase of the deep watertable in the other hand, both could participate to the actuation of the landslide. Those mechanisms also characterize the reaction of the overall slope of La Clapière (Cappa et al., 2004). The renewal of this hydrogeophysical experiment in high-level period of the deep watertable or by sprinkling on the slipped volume coupling numerical stability models will be a next stage with an aim of answering the assumptions that this injection will have enabled us to advance.
Acknowledgements
This work was supported by the PACA Region, the French INSU SAMOA project and RELIEF Project (French Ministry of Research). We acknowledge Christopher Wibberley for his English review and comments.
References
Agnesi, V., Camarda, M., Conoscenti, C., Di Maggio, C., Diliberto, I.S., Madonia, P. and Rotigliano, E., 2005. A multidisciplinarymultidisciplinary approach to the evaluation of the mechanism that triggerd the Cerda landslide (Sicily, Italy). Geomorphology, 65, 101–116.
Bichler, A., Bobrowsky, P., Best, M., Douma, M., Hunter, J., Calvert, T. and Burns, R., 2004. Three-dimensional mapping of a landslide using a multigeophysical approach: the Quesnel Forks landslide. Landslides, 1, 29–40. Bigot-Cormier, F., Braucher, R., Bourles, D., Guglielmi, Y., Dubar, M. and Stephan, J.-F., 2005. Chronological constraints on processes leading to large active landslides. Earth Planet. Sci. Lett., 235, 141–150.
Binet, S., 2006. L’hydrochimie, marqueur de l’évolution a` long terme es versants montagneux fracture´ s vers de grands mouvements de terrain (Vallée de la Tineée, Alpes Maritimes et versant de Rosone, Grand Paradis, Italie). PhD thesis, 312 pp. University of Besançon, Besancon.
Binet, S., Jomard, H., Lebourg, T., Guglielmi, Y., Bertrand, C., Mudry, J., Charmoille, A. and Quenardel, J.M., 2004. Apport des Méthodes électriques 3D à L’étude du Comportement d’un pied de Versant: interaction entre un Mouvement Superficiel et Profond (La Clapière; Alpes Maritimes). In: AGAP Qualite´, Eau et Géophysique, Lyon,September 2004.
Binet, S., Jomard, H., Guglielmi, Y., Lebourg, T., Tric, E., Bertrand, C. and Mudry, J., in press. Experimental analysis of groundwater flow through a landslide slip surface using natural and artificial water chemistry tracers. Hydrologic. Processes (in press).
Bogdanoff, S. and Ploquin, A. 1980. Les gneiss et migmatites du massif de l’Argentera (Alpes-Maritimes): apport de deux coupes ge´ochimiques. Bull. Soc. Géol. Fr., 29, 353–358.
Bogoslowsky, V.A. and Ogilvy, A.A., 1976. Geophysical methods for the investigation of landslides. Geophysics, 42, 562–571.
Bonzanigo, L., Eberhart, E. and Loew, S., 2001. Hydromechanical factors controlling the creeping Campo Vallemaggia landslide. In: Symposium of landslides, Causes, Impacts and Countermeasures, Davos, pp. 9–12. Cappa, F., Guglielmi, Y., Soukatchoff, V.M., Mudry, J., Bertrand, C. and Charmoille, A., 2004. Hydromechanical modeling of a large moving rock slope inferred from slope levelling coupled to spring long-term hydrochemical monitoring: example of the La Clapiere landslide (Southern Alps, France). J. Hydrol., 291, 67–90.
Caris, J.P.T. and Van Asch, Th. W.J., 1991. Geophysical, geotechnical and hydrological investigations of a smalllandslide in the French Alps. Eng. Geol., 31, 249–276.
Cruden, D.M. and Varnes, D.J., 1996. Landslide types and processes. In: Landslides: Investigations and Mitigation, chapter 3 (A.K. Turner and R.L. Schuster, eds), pp. 36–71. Transportation Research Board, National Research Council, Washington, DC, Special Report 247.
Descloitres, M., Ribolzi, O. and Le Troquer, Y., 2003. Study of infiltration in a Sahelian gully erosion area using timelapse resistivity mapping. Catena, 53, 229–253.
Dzikowski, M., 1995. Convolution a débit variable a partir de reponses de tracages artificiels dans les milieux poreux ou karstiques; the´orie et mode` le: convolution in time-dependent system from artificial tracer tests responses in porous or karst systems; theory and modeling. J. Hydrol., 164, 287–303.
Edwards, L.S., 1977. A modified pseudosection for resistivity and IP. Geophysics, 42, 1020–1036.
Faure-Muret, A., 1955. Etudes Geologiques sur le Massif de l’Argentera-Mercantour et sur ses Enveloppes Sédimentaires. Mem. Carte Ge´ ol., Paris, France.
Follacci, J.P., 1987. Les mouvements du versant de la Clapie`re a` Saint-Etienne de Tinée (Alpes Maritimes). Bull. Lab. Ponts Chausse´es, 150–151, 39–54.
Follacci, J.P., 1999. Seize ans de surveillance du glissement de la Clapière (Alpes Maritimes). Bull. Lab. Ponts Chaussées, 220, 33–51.French, H. and Binley, A., 2004. Snowmelt infiltration: monitoring temporal anspatial variability using time-lapse electrical resistivity. J. Hydrol., 297, 174–186.
Godio, A. and Bottino, G., 2001. Electrical and electromagnetic investigation for landslide characterisation. Phys. Chem. Earth, 26, 705–710,
Griffiths, D.H. and Barker, R.D., 1993. Two-dimensional resistivity imaging and modelling in areas of complex geology. J. Appl. Geophys., 29, 211–226.
Guérin, R., Munoz, M.L., Aran, C., Laperelle, C., Hidra, M., Drouart, E. and Grellier, S., 2004. Leachate circulation: moisture content assessment by means of a geophysical technique. Waste Manage., 24, 785–794. Guglielmi, Y., Bertrand, C., Compagnon, F., Follacci, J.P. and Mudry, J., 2000. Acquisition of water chemistry in a mobile fissured basement massif: its role in the hydrogeological knowledge of the La Clapière Landslide (Mercantour massif, southern alps, France). J. Hydrol., 229, 138–148.
Guglielmi, Y., Vengeon, J.M., Bertrand, C., Mudry, J., Follacci, J.P. and Giraud, A., 2002. Hydrogeochemistry: an investigation tool to evaluate infitration into large moving rock masses (case study of the La Clapie`re and Séchilienne alpinelandslides). Bull. Eng. Geol. Environ., 61,311–324.
Guglielmi, Y., Cappa, F. and Binet, S., 2005. Coupling between hydrogeology and deformation of mountainous rock slopes: insights from La Clapie`re area (alpesMaritimes). C. R. Acad. Sci., 337, 1154– 1163.
Guimera, J. and Carrera, J., 2000. A comparison of hydraulic and transport parameters measured in low-permeability fractured media. J. Contam. Hydrol., 41, 261–281.
Gunzburger, Y., Merrien-Soukatchoff, V. and Guglielmi, Y., 2005. Influence of daily surface temperature fluctuations on rock slope stability: case study of the Rochers de Valabres slope (France). Int. J. Rock Mech. Mining Sci., 42, 331–349.
Ivaldi, J.P., Guardia, P., Follacci, J.P. and Terramorsi, S., 1991. Plis de couverture en échelon et failles de second ordre associés à un décrochement dextre de socle sur le bord nord-ouest de l’Argentera (Alpes-Maritimes, France). C. R. Acad. Sci. Paris, 313, 361–368.
Jomard, H., Lebourg, T., Binet, S., Tric, E. and Hernandez, M., 2005. Water Injection in a Landslide: Real Time Hydrochemical and Geophysical Study, pp. 24– 29. EUG Assembly, Vienna.
Lapenna, V., Lorenzo, P., Perrone, A. and Piscitelli, S., 2003. High resolution geoelectrical tomographies in the study of Giarrossa Landslide (Southern Italy). Bull. Eng. Geol. Environ., 62, 259–268.
Lebourg, T. and Fabre, R., 2000. Glacial Tills Instability on Mountainsides, Influence of the Geomorphologic Inheritance and the Heterogeneity, for Forecasting the Behaviour of Slope Movements. VIII International Symposium on Landslides, Cardiff, 26–30 June 2000, pp. 887–892.
Lebourg, T., Tric, E., Guglielmi, Y., Cappa, F., Charmoille, A. and Bouissou, S., 2003. Geophysical Survey to Understand Failure Mechanisms Involved on Deep Seated Landslides. EGS–AGU–EUG Joint Assembly, Nice. Lebourg, T., Binet, S., Tric, E., Jomard, H. and El Bedoui, S. 2005. Geophysical survey to estimate the 3D sliding surface and the 4D evolution of the water pressure on part of a Deep Seated Landslide. Terra Nova, 17, 399–406.
Loke, M.H., 1997. RES2DINV Software User’s Manual. University Sains Malaysia, Penang.
Maquaire, O., Flageollet, J.C., Malet, J.P., Schmutz, M., Weber, D. and Klotz, S., 2001. Une approche multidisciplinaire pour la connaissance d’un glissementcoulee dans les marnes noires du Callovo-Oxfordien (Super Sauze, Alpes de Hte Provence, France). Rev. Fr. Geotech., 95–96, 15–32.
McCann, D.M. and Forster, A. 1990. Reconnaissance geophysical methods in landslide investigations. Eng. Geol.,29, 59–78.
Milles, S. and Lagofun, J., 1999. Topographie et Topome´trie Modernes, Techniques de Mesures et de Représentation. Eyrolles, Paris.
Miyazaki, T., 1993. Water Flow in Soils, 312 pp. Marcel Dekker, New York. Moriwaki, H., Inokuchi, T., Hattanji, T., Sassa, K., Ochiai, H. and Wang, G. 2004. Failure processes in a full-scale landslide experiment using a rainfall simulator. Landslides, 1, 277–288.
Mudry, J., 1990. Les courbes flux chimique débit et le fonctionnement des aquifères karstiques. J. Hydrol., 120, 283–294.
Noverraz, F., Bonnard, C., Dupraz, H. and Huguenin, L., 1998. Grands Glissements de Versants et Climat. Rapport Final PNR 31, 314 p. Vdf Hochschulverlag AG an Der ETH Zu¨ rich, Zurich.
Onda, Y., Tsujimura, M. and Tabuchi, H. 2004. The role of subsurface water flow paths on hillslope hydrological processes, landslides and landform development in steet mountains of Japan. Hydrol. Processes, 18, 637–650.
Sawada, A., Uchida, M., Shimo, M., Yamamoto, H., Takahara, H. and Doe, T.W., 2000. Non-sorbing tracer migration experiments in fractured rock at the Kamaishi Mine, Northeast Japan. Eng. Geol., 56, 75–96.
Terzaghi, K., 1950. Mechanism of Landslides: Application of Geology to Engineering Practice (Berkey Volume), pp. 83–124. Geological Society of America, New York, NY.
Tohari, A., Nishigaki, M. and Komatsu, M., 2000. Laboratory experiments on initiation of rainfall-induced slope failure with moisture content measurements. In: International Conference on Geotechnical and Geological Engineering, (GeoEng 2000) Australia, Vol. 2.
Extended abstract, pp. 56, (selected as Award Papers), Melbourne.
Tullen, P., 2002. Méthodes D’analyses du Fonctionnement Hydrogéologique des Versant Instables, 192 + annexes pp.
Ecole Polytechnique Fédéral de Lausanne, Lausanne.
Wang, G. and Sassa, K., 2003. Pore-pressure generation and movement of rainfall- induced landslides: effect of grain size and fine-particle content. Eng. Geol., 69, 109–125.
FIGURES AND TABLES
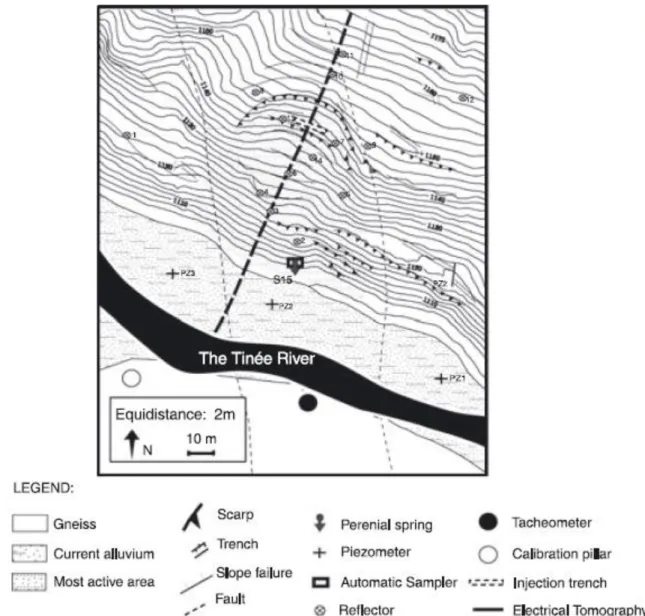
Fig. 1 Localization and topography of the La Clapie`re landslide (a) and detailed map of the studied secondary encased landslide (b) in the slope toe (from Lebourg et al., 2005).
Table 1 Landslide geometrical characteristics
Fig. 2 Localization on the secondary landslide of the geophysical survey array (141 m), the hydrological acquisition device and the tacheometric sensors used for the injection experiment.
Fig. 3 Hydrological data obtained on S15 (see Fig. 2). First graph presents the injected and recovered water flow, 30% of the injected flow exits in S15. Second graph shows the evolution of fluorescein concentration with two of line dilution
peaks (>500 lg L)1, strong grey mark). The injection duration is highlighted by the smooth grey mark.
Fig. 4 (a) Reference profile made before the injection. Zones 1 and 3 correspond tounsaturated zones and zone 2 to a perched saturated zone with an exit point on S15.(b) Localization of inversion blocks edges for all the acquired profiles (note that a block can contain several measurement points). It shows the geometric accuracy evolution of inverted profiles with depth increase.
Fig. 5 Inverted matrices subtraction of selected profiles (see Table 2). Dti is the elapsed time between the acquired
profile and the injection start. Red parts correspond to a relatively increasing resistivity and blue part to a relative resistivity decrease (water flow path). No dimension or value is given because of the different relative resistivity response of geological formations to the water solicitation.
Fig. 6 Conceptual sketch of slope geometry after geological and hydrogeophysical interpretation. The landslide occurred within the glacial deposits. The movement is controlled by basement toppling (Binet et al., 2004; Binet, 2006) which imply a diffuse deformation in tills.