HAL Id: hal-01717786
https://hal.archives-ouvertes.fr/hal-01717786
Submitted on 26 Feb 2018HAL is a multi-disciplinary open access
archive for the deposit and dissemination of sci-entific research documents, whether they are pub-lished or not. The documents may come from teaching and research institutions in France or abroad, or from public or private research centers.
L’archive ouverte pluridisciplinaire HAL, est destinée au dépôt et à la diffusion de documents scientifiques de niveau recherche, publiés ou non, émanant des établissements d’enseignement et de recherche français ou étrangers, des laboratoires publics ou privés.
by the aquatic plant Myriophyllum aquaticum
Amélie Caillat, Philippe Ciffroy, Matthias Grote, Sylvain Rigaud, Jean-Marie
Garnier
To cite this version:
Amélie Caillat, Philippe Ciffroy, Matthias Grote, Sylvain Rigaud, Jean-Marie Garnier. Bioavailability of copper in contaminated sediments assessed by a DGT approach and the uptake of copper by the aquatic plant Myriophyllum aquaticum. Environmental Toxicology and Chemistry, Wiley, 2014, 33 (2), pp.278-285. �10.1002/etc.2422�. �hal-01717786�
Bioavailability of copper in contaminated sediments assessed by a DGT approach and the uptake of copper by
the aquatic plant Myriophyllum aquaticum
Journal: Environmental Toxicology and Chemistry Manuscript ID: Draft
Wiley - Manuscript type: Original Article Date Submitted by the Author: n/a
Complete List of Authors: Caillat, Amélie; CEREGE UMR 7730 CNRS – Aix-Marseille Université, FR ECCOREV,
Ciffroy, Philippe; Electricité de France (EDF), Division Recherche et Développement, Laboratoire National d’Hydraulique et Environnement (LNHE)
Grote, Matthias; Electricité de France (EDF), Division Recherche et Développement, Laboratoire National d’Hydraulique et Environnement (LNHE)
Rigaud, Sylvain; CEREGE UMR 7730 CNRS – Aix-Marseille Université, FR ECCOREV,
Garnier, Jean-Marie; CEREGE UMR 7730 CNRS – Aix-Marseille Université, FR ECCOREV,
Keywords: bioavailability, copper, ecological risk assessment, plant uptake, sediment toxicity
Abstract:
Abstract
The assessment of the potentially harmful effects of metals on biota depends on the speciation and bioavailability of the metals. In this study, we investigated copper accumulation and toxicity in the aquatic plant Myriophyllum aquaticum after exposure to artificial sediments varying in peat and/or ferric hydroxide content and spiked with Cu (5 to 200 mg.kg-1). Modeling of the kinetic DGT (diffusive gradient in thin film)
measurements revealed fast and slow copper resupply from the solid phase for sediment formulated with and without peat, respectively.
M. aquaticum proved to be sensitive to copper, as the copper accumulation and growth differed depending on the sediment composition and copper concentration. Comparing the copper accumulation in M. aquaticum to total dissolved, free and CDGT (concentration in solution derived from DGT measurements) copper concentrations revealed that CDGT concentrations were a better predictor of the accumulation than the others. However, the relatively weak correlation observed (r2=0.6) and the fact that plant uptake does not increase proportionally to fluxes to DGT suggest that copper uptake in plants was not diffusion limited. Thus, the free copper concentrations near the root surface were sufficient to meet the plant’s demand during the experiment. Furthermore, labile complexes that continuously resupply the Cu2+ pool may also contribute to the
concentrations available for plant uptake. In the range of copper
concentrations investigated here, saturation of uptake processes as well as toxicity are considered responsible for the poor DGT prediction of plant uptake.
2 3 4 5 6 7 8 9 10 11 12 13 14 15 16 17 18 19 20 21 22 23 24 25 26 27 28 29 30 31 32 33 34 35 36 37 38 39 40 41 42 43 44 45 46 47 48 49 50 51 52 53 54 55 56 57 58
Bioavailability of copper in contaminated sediments assessed by a DGT approach and the
1
uptake of copper by the aquatic plant Myriophyllum aquaticum
2 3
Caillat Amélie†,‡, Ciffroy Philippe‡, Grote Matthias‡, Rigaud Sylvain† and Garnier Jean-Marie†* 4
† Centre Européen de Recherche et d’Enseignement des Géosciences de l’Environnement (CEREGE),
5
UMR CNRS 7730, AMU (Aix-Marseille Université). BP 80, 13545 Aix en Provence, France. 6
‡ Electricité de France (EDF), Division Recherche et Développement, Laboratoire National 7
d’Hydraulique et Environnement (LNHE), 6 quai Watier, 78401 Chatou, France. 8 * Corresponding author 9 10 11 12 2 3 4 5 6 7 8 9 10 11 12 13 14 15 16 17 18 19 20 21 22 23 24 25 26 27 28 29 30 31 32 33 34 35 36 37 38 39 40 41 42 43 44 45 46 47 48 49 50 51 52 53 54 55 56 57 58
13
Abstract
14
The assessment of the potentially harmful effects of metals on biota depends on the speciation and 15
bioavailability of the metals. In this study, we investigated copper accumulation and toxicity in the 16
aquatic plant Myriophyllum aquaticum after exposure to artificial sediments varying in peat and/or 17
ferric hydroxide content and spiked with Cu (5 to 200 mg.kg-1). Modeling of the kinetic DGT 18
(diffusive gradient in thin film) measurements revealed fast and slow copper resupply from the solid 19
phase for sediment formulated with and without peat, respectively. 20
M. aquaticum proved to be sensitive to copper, as the copper accumulation and growth differed 21
depending on the sediment composition and copper concentration. Comparing the copper 22
accumulation in M. aquaticum to total dissolved, free and CDGT (concentration in solution derived 23
from DGT measurements) copper concentrations revealed that CDGT concentrations were a better 24
predictor of the accumulation than the others. However, the relatively weak correlation observed 25
(r2=0.6) and the fact that plant uptake does not increase proportionally to fluxes to DGT suggest that 26
copper uptake in plants was not diffusion limited. Thus, the free copper concentrations near the root 27
surface were sufficient to meet the plant’s demand during the experiment. Furthermore, labile 28
complexes that continuously resupply the Cu2+ poolmay also contribute to the concentrations available 29
for plant uptake. In the range of copper concentrations investigated here, saturation of uptake 30
processes as well as toxicity are considered responsible for the poor DGT prediction of plant uptake. 31
32
Keywords: Bioavailability, Myriophyllum aquaticum, Diffusive gradient in thin film, Copper, 33 Artificial sediment. 34 35 2 3 4 5 6 7 8 9 10 11 12 13 14 15 16 17 18 19 20 21 22 23 24 25 26 27 28 29 30 31 32 33 34 35 36 37 38 39 40 41 42 43 44 45 46 47 48 49 50 51 52 53 54 55 56 57 58
Introduction
36
Sediments have been recognized as a major sink of metals in aquatic systems, and the ultimate 37
concern of such metal contamination in sediments is the impact of these metals on aquatic organisms. 38
It is now well known that the total content of contaminants is not a good predictor for risk assessment 39
as not all fractions are available to organisms [1]. Speciation and bioavailability are necessary 40
conditions for assessing and predicting the food chain transfer and phytotoxicity of contaminants and 41
their potentially harmful effects. The bioavailability of a compound can be assessed by biological 42
methods (bioassay, bioaccumulation) and/or chemical measurements. 43
Different procedures for biological tests on sediment can be used. Tests can be performed on the 44
elutriate phase, the interstitial water or the whole sediment; the latter represents a more realistic type of 45
exposure that can be simulated in the laboratory [2]. Among aquatic organisms, the widely used for 46
bioassays on the whole sediment were nematodes (Caenorhabditis elegans), bacteria (Arthrobacter 47
globiformis), fish embryos (Danio rerio), oligochaetes (Tubifex tubifex) and midge (Chironomus 48
tentans) [3, 4]. Because macrophytes are considered indicators of water pollution at the same level as 49
fish and macrobenthos, the integration of a primary producer (plant) that is rooted in the sediment in a 50
test battery is desirable (European Water Framework Directive; EU-WRRL 2000). Therefore, a new 51
sediment contact test with the Myriophyllum aquaticum (water milfoil) has been developed and will be 52
normalized [5]. M. aquaticum is a submerging plant that extracts nutrients from sediment. The growth 53
of the Myriophyllum aquaticum is affected by the origin of the sediment and the presence of toxicants 54
[5]. M. aquaticum has also been used for studies of the bioaccumulation of heavy metals [6, 7] on 55
plants collected in situ and plants grown hydroponically. Recently, M. aquaticum has been used in 56
standardized sediment contact tests, and a strong correlation was found between toxic effects and 57
metal sediment concentration [8]. 58
Metal bioavailability can be estimated by various chemical and physico-chemical methods. In 59
particular, Zhang and coworkers developed the so-called “diffusive gradient in thin films” (DGT) 60
technique that is expected to mimic bioaccumulation processes and has been adapted for assessing 61
metal bioavailability in soil and sediments [9-11]. DGT is a priori well adapted for non-equilibrium 62
conditions where the bioavailability of metals is mainly controlled by the kinetic resupply of free 63
metals in a solution from solid phase labile pools. Indeed, similar to a plant root, DGT induces a local 64
decrease in the concentration of metal at the sediment/DGT interface, and metals bound to the 65
sediment particles may be released in the interstitial water and become available [12]. To improve the 66
interpretation of DGT experiments, the use of a conceptual model with sorption/desorption and 67
diffusion reactions in the sediment is required. Two dynamic models have been developed; these 68
models are known as DGT-Induced Fluxes in Soils and Sediments (1D-DIFS) [13] and DGT- 69
PRObabilistic Fitting of parameters for Soils and Sediments (DGT-PROFS) [14]. The DGT-PROFS 70
model has been developed to enhance the DIFS model for interpreting DGT kinetics experiments 71 2 3 4 5 6 7 8 9 10 11 12 13 14 15 16 17 18 19 20 21 22 23 24 25 26 27 28 29 30 31 32 33 34 35 36 37 38 39 40 41 42 43 44 45 46 47 48 49 50 51 52 53 54 55 56 57 58
performed on formulated sediments [14, 15]. Previously, the link between DGT measurements and the 72
bioaccumulation in plants showed contrasting results [9]. A strong correlation has been found between 73
DGT-labile copper in various soils and copper accumulation in a terrestrial plant (Lepidium 74
heterophyllum)[1]. However, DGT accurately predicted the bioavailability of Zn and Cu in spinach
75
and ryegrass only at nontoxic concentrations [16]. Indeed, in cases of toxicity, plant absorption will be 76
disturbed, whereas the DGT measurement will not be affected. 77
The aim of our study was to assess the relationships between speciation (given by different 78
approaches, including DGT probes), bioaccumulation and toxic effects on M. aquaticum. Copper, 79
considered a potentially extremely toxic threat to aquatic biota [17], was selected for this study 80
because few studies have been performed comparing plant accumulation of copper and DGT 81
measurements [9]. Therefore, we performed a set of experiments in parallel coupling bioassay and 82
DGT approaches to compare the "real bioavailability" measured by the plant and the "potential 83
bioavailability" estimated by the DGT tool. 84
Considering that the speciation of elements and therefore their bioavailability are linked to the solution 85
and particulate phase compositions, we investigated the behavior of copper on formulated sediments 86
of different compositions to reduce the complexity of the system. The sediment composition varied by 87
(i) the addition of different components having more or less strong affinities toward copper (peat, iron 88
oxides...) and (ii) the sediment copper spiking concentrations. Furthermore, the EDTA that is used in 89
the standard solution for the bioassay (M. aquaticum) was investigated at different concentrations to 90
assess its impact on copper bioavailability. 91
92
1. Material and Methods
93
1.1 Sediment and solution composition
94
Solid phase composition: Four different artificial sediments were prepared according to a slightly 95
modified protocol of the standard OECD 207-218 protocol. The first sediment, named the “basic 96
sediment” (SB), is formulated as follows: 77% acid-washed sand, 22% kaolinite clay, and 1% calcite. 97
The other formulated sediments differed from the SB composition by the presence or absence of iron 98
oxides or by the presence or absence of peat. The second sediment called SG corresponds to the basic 99
sediment coated with 2 g.kg-1 goethite. The third sediment named SP corresponds to the basic 100
sediment amended with 5% peat (equivalent to the so-called standard OECD 207-218). The fourth 101
sediment named SPG and is composed of both peat and goethite. 102
The quartz and clay were obtained from VWR-France, and the crushed calcite was purchased from La 103
Marchande de Couleurs, (Lyon-France). The peat is composed of blond sphagnum and was purchased 104
from ASB Grünland Helmut Aurenz GmbH (Porschestr.4, D-71634 Ludwigsburg, Germany). The iron 105
oxides were synthesized according to the procedure described in [18]. 106 2 3 4 5 6 7 8 9 10 11 12 13 14 15 16 17 18 19 20 21 22 23 24 25 26 27 28 29 30 31 32 33 34 35 36 37 38 39 40 41 42 43 44 45 46 47 48 49 50 51 52 53 54 55 56 57 58
Solution composition: The solution used for the humidification of the sediment is the nutrient solution 107
recommended for the sediment contact test in the standard for the M. aquaticum bioassay (Steinberg 108
revised medium, ISO 20079). This nutrient solution is composed of the following (µM): KNO3 (3462), 109
Ca(NO3)2 (1866), KH2PO4 (662), K2HPO4 (75), MgSO4 (67), H3BO3 (2), FeCl3 (5), MnCl2 (2), ZnSO4 110
(1), Na2MoO4 (0.2) and EDTA (4.5). Because EDTA is known to be a complexing agent for metals, 111
we evaluated the impact of this compound on copper availability by varying the EDTA concentration 112
(0 or 0.45 µM). A “(E)” was added to the name of the sediment to denote the addition of EDTA. 113
Preparation of the sediments: The dry components of the sediment were mixed and humidified with 114
the nutrient solution for 4 hours. The sediments were then spiked with copper by the addition of a 115
Cu(NO3) solution to obtain four different copper-sediment concentrations: 5, 15, 50 and 200 mg.kg-1 116
(values added to the name of the sediment; see below). After the metal addition, the sediments were 117
agitated for 24 hours, and the pH was regularly checked and adjusted if necessary. The sediments were 118
distributed into 15 ml beakers for the bioassay and into 110 ml beakers for the DGT experiments; the 119
sediments were then equilibrated for 7 days at a controlled temperature (24 ± 0.5 °C). Only the 120
combinations of some of the different components of the sediment were tested: SB5, SB15, SB50, 121
SB50(E); SP5, SP15, SP50, SP50(E), SP200(E); SG50, SG50(E), SG200(E); SPG50, SPG50(E) and 122
SPG200(E). 123
1.2 Myriophyllum aquaticum experimental protocol
124
Plant material and bioassay experiment
125
The stock culture of Myriophyllum aquaticum was obtained from the UFZ institute (HemlholtZ 126
Zentrum Für Umweltforschung). During the culture period before the bioassay, the plants were grown 127
in an artificial sediment formulated following the OECD 207-218 protocol and saturated with the 128
Steinberg medium (DIN EN ISO 20079). 129
Prior to the start the bioassay experiment, plants whorls were selected on the basis of their fresh 130
biomass (25 ± 6 mg) by cutting whorls from 21-day-old plants. Each whorl was then placed into a 131
beaker containing 15 ml of sediments. For each test, 25 whorls were exposed to copper-contaminated 132
sediments, and 10 whorls were exposed to the control sediment (without copper). All tests were 133
performed in a growth chamber (exposure light/dark cycle, 16/8 h at 24 ± 1°C at a light intensity of 134
60-75 µE.m-2.s-1). The pots were irrigated every 48 h with the semi-concentrated Steinberg medium 135
ISO 20079 (draft ISO/DIS 16191). After 14 days of exposure, the plants were harvested and washed in 136
ultrapure water, washed with an EDTA solution (1 mM) and finally rinsed three times with ultrapure 137
water [19]. The final fresh weight of each plant was recorded. The pH of the sediments was measured 138
at the beginning and the end of the experiment. After pooling several beakers, the interstitial water was 139
recovered by centrifugation of the sediments (3500 rpm, 20 min), filtered at 0.45 µm and acidified 140
with 1% HNO3 (suprapur). 141 2 3 4 5 6 7 8 9 10 11 12 13 14 15 16 17 18 19 20 21 22 23 24 25 26 27 28 29 30 31 32 33 34 35 36 37 38 39 40 41 42 43 44 45 46 47 48 49 50 51 52 53 54 55 56 57 58
142
Effect (toxicity) assessment:
143
The growth rate (GRC for control and GRT for test) during the exposure period was calculated from the 144
initial and final weight (M0 and Mfinal, respectively) of each fresh whorl (eq. 1). This parameter has 145
been shown to be the most suitable for the test due to the low coefficient of variation of this parameter 146
[5]. The criterion of toxicity was expressed as the percentage of inhibition and is given by (eq. 2). 147 148 GRC or GRT = (lnMfinal – lnM0) / ∆t (eq. 1) 149 150 I (%) = (GRC – GRT) / GRC) * 100 (eq. 2) 151 152 Copper accumulation: 153
After harvesting, the plants (i.e., roots and leaves) were dried at 60 °C until a constant weight was 154
reached. To have sufficient biomass for analysis, the plants were pooled (eight per pool) to obtain 155
three replicates per experiment. Samples were digested in a 5:1 ratio of HNO3 and H2O2 in a 156
microwave oven according to a similar protocol to this of Bervoets and co-workers [20] and the 157
copper concentration in the digests were measured by ICP-OES or SAA furnace. 158
In addition, blanks were used, and a reference material (BCR60) was used to control the efficiency of 159
the mineralization. 160
161
1.3 DGT kinetic experimental protocol
162
DGT kinetic experiments were performed using DGT units (piston-type with a 2-cm-diameter window 163
loaded with a Chelex-100 resin and with an open pore gel (0.76 mm) purchased from DGT Research 164
(Lancaster, UK; http://www.dgtresearch.com)). The DGT units were gently pressed into plastic 165
beakers containing 120 ml of sediment until the shoulder of the piston was in contact with the surface 166
of the sediment housing. The devices were retrieved from the sediments at different contact times: 4, 167
8, 24, 96 hours and 14 days. Three replicates were performed for each time. After retrieval, the DGT 168
units were thoroughly rinsed with ultrapure water and stored at 4 °C before the elution of the DGT 169
resins with 5 mL of 1 M HNO3 (Merck, suprapur). For each contact, the pore waters of each beaker 170
were extracted following the same procedure as that for bioassay experiments. pH and Eh 171
measurements in the sediment were performed each time. 172 2 3 4 5 6 7 8 9 10 11 12 13 14 15 16 17 18 19 20 21 22 23 24 25 26 27 28 29 30 31 32 33 34 35 36 37 38 39 40 41 42 43 44 45 46 47 48 49 50 51 52 53 54 55 56 57 58
1.4 Modeling
173
DGT-PROFS modeling
174
The accumulation kinetics of metals to DGT were interpreted using the DGT-PROFS model, which is 175
described in detail in [14]. Only the main features of this model are provided here. Briefly, the DGT-176
PROFS model assumes that trace metals in sediments can be distributed between three separate 177
phases: pore water (where speciation influences the diffusion coefficient value) and weak and strong 178
sorption sites on the particulate phase. The accumulation of metals on DGT is governed by the 179
adsorption-desorption kinetics and the diffusion of metals within the pore water of the sediment and 180
the gel. Only labile metals (free metals and small inorganic complexes able to dissociate in the gel) are 181
assumed to diffuse in the DGT gel. Thus, diffusion of the different metal species through the sediment 182
and gel layer (i.e., free, inorganic and humic species) generates ‘apparent’ diffusion coefficients in the 183
sediment and in the diffusive gel lower than those of the free metals [21]. The diffusion coefficient can 184
range between a minimum value, corresponding to humic complexes, and a maximum value, 185
corresponding to free ions. For DGT-experimented sediment, the DGT-PROFS model was allowed to 186
fit the following parameters: αweak, the proportion of particulate metal associated to weak sites before 187
DGT deployment; k’des1, the desorption rate from weak particulate sites; k’des2, the desorption rate from 188
strong particulate sites; and Dsed, the diffusion coefficient of metals in sediment. These parameters can 189
be obtained by fitting the DGT experimental measurements using a probabilistic approach, which 190
represents parameters by probability density functions (PDFs) (i.e., with indications of their 191
uncertainty) instead of single values [14]. 192 193 194 195 2 3 4 5 6 7 8 9 10 11 12 13 14 15 16 17 18 19 20 21 22 23 24 25 26 27 28 29 30 31 32 33 34 35 36 37 38 39 40 41 42 43 44 45 46 47 48 49 50 51 52 53 54 55 56 57 58
2. Results
196
2.1 Physico-chemical characteristics of the different sediments:
197
The variation of the total pore-water copper concentration (C(iw))over the duration of a given test 198
ranged between 3% to 10% except in the cases of SG50, SG50(E) and SG200(E), which had variations 199
of 13, 14 and 19%, respectively. These features allow us to consider the equilibration with the solid 200
phase to be complete after a sediment incubation time of 7 days (Table 1). 201
The average values of the (C(iw)) varied from 14.4 µg.l-1 to 725 µg.l-1 for the DGT experiments and 202
from 24 to 1510 µg.l-1 for the bioassays (Table 1). Generally, for the same composition of sediment, 203
copper pore-water concentrations are higher in pots containing plants than in pots containing DGT. 204
This result can mainly be explained by the higher evaporation due to the smaller and less hermetic 205
pots used for the plant exposure. Indeed, a decrease in the supernatant water thickness was observed in 206
the bioassay pots, which was partly compensated by using irrigation as recommended by the protocol 207
(draft ISO/DIS 16191). According to the sediment composition, the lowest Cuiw concentrations were 208
found in sediments coated with goethite, and higher concentrations were found in sediments 209
formulated with peat. Sediments formulated with both goethite and peat show intermediate values. 210
The presence of EDTA in the sediment results in much higher Cuiw concentrations compared to tests 211
without EDTA. 212
The pH values ranged from 5.76 to 7.17 and from 5.17 to 7.22 in the different sediments tested in 213
beakers with DGT probes and M. aquaticum, respectively (Table S1 Supporting Information). The 214
lowest pH values were observed in the sediments formulated with peat; these values are in agreement 215
with the naturally low pH of peat and its good buffering capacity against pH changes, which makes it 216
difficult to obtain a pH around neutrality. The pH did not vary significantly during a given experiment 217
(≤0.1 unit pH). The redox potential shows that all the experiments were performed under oxic 218
conditions (Table S1 Supporting Information). The DOC concentrations in the “SP” sediments are 219
very high and show that a part of the peat was dissolved and solubilized in pore water. In the case of 220
the sediment composed of organic matter and goethite, the DOC concentration is slightly lower than in 221
“SP”; we can suppose that a part of the dissolved carbon was fixed on oxides. Finally, in the bioassay 222
experiment, there is an increase in the DOC concentrations, which is certainly related to the 223
evaporation process. The copper distribution between the solid phase and the pore water can be 224
assessed by a partition coefficient (Kd). For the DGT experiment, the Kd values (Table 1) are on the 225
same order of magnitude in the different sediments, with values ranging from 100 to 500 except for 226
GS-50, for which there is a significant increase in the Kd value up to around 2900. In the presence of 227
EDTA, Kd exhibited no marked differences. 228 229 230 2 3 4 5 6 7 8 9 10 11 12 13 14 15 16 17 18 19 20 21 22 23 24 25 26 27 28 29 30 31 32 33 34 35 36 37 38 39 40 41 42 43 44 45 46 47 48 49 50 51 52 53 54 55 56 57 58
2.2 Sediment contact test with Myriophyllum aquaticum
231
The growth rates of Myriophyllum aquaticum (Figure 1) exposed to control sediments agree with the 232
standard for this bioassay (growth rate ≥ 0.09 day-1), which demonstrates the applicability of the 233
bioassay in sediments with different physico-chemical characteristics. For the different control 234
sediments, lower growth rates are observed in the presence of iron oxide (SG and SPG) when 235
compared to the basic sediment (SB). Conversely, the highest growth rate was observed for the 236
sediment formulated with peat (SP - OECD reference sediment), which is in agreement with the 237
results obtained by [5]. Furthermore, the growth rates for the control sediments containing EDTA were 238
systematically higher than those in the control sediments without EDTA. This variation in growth 239
rates leads to a strong variation in the increase of plant biomass over the 14 days of exposure. For 240
example, with the control plants exposed to the sediments SPG and SP, the biomass increased by 241
approximately 250% and 600%, respectively. It was observed that growth (rate) inhibition (I (%)) 242
depends on the copper concentration for a given sediment and on the sediment composition (Figure 1). 243
The inhibition range from 6 to 20% for the sediment containing peat (OECD reference sediment) 244
spiked from 5 to 50 mgCu.kg-1 (SP5, SP15, SP50), and that from 23 to 34% for the basic sediment 245
spiked from 5 to 50 mgCu.kg-1 (SB5, SB15, SB50). The presence of EDTA induced an inhibition 246
ranging from 16 to 100%. For the different sediments formulated without EDTA and spiked at 50 247
mg.kg-1, there is a higher toxicity in the sediments formulated without peat, SB and SG (I=34 and 248
32%, respectively), than in the peat-containing sediments, SP and SPG (I=25 and 15%, respectively). 249
The increase in plant biomass for the spiked sediments SG200E and SP15 was 4 and 570%, 250
respectively, which demonstrated the wide range of toxic effects in the sediments tested. 251
2.3 Copper internalized concentration in M. aquaticum
252
Similar to the growth inhibition, the copper bioaccumulation in M. aquaticum depends on the copper 253
concentration and the sediment composition (Table 1). For example, when comparing the basic 254
sediment spiked with either 5 or 50 mg Cu.kg-1 (SB5 and SB50), the Cu accumulation in plants was 255
observed to increase from 44 to 124 µg.g-1. For sediments formulated with iron oxide or peat, the 256
bioaccumulated copper concentrations varied from 72, 32 and 29 µg.g-1 for SP50, SG50 and SPG50, 257
respectively. 258
The presence of EDTA homogenizes the copper bioaccumulation among sediments with 259
concentrations of approximately 60 µg.g-1. 260
2.4 Copper Flux to DGT
261
Sediment composition has a strong influence on copper fluxes as indicated by the comparison of the 262
measured fluxes of copper to the DGT resin (expressed as mg.cm-2.s-1) over the duration of the test for 263
four of the different formulated sediments tested (Figure 2). For the four experiments performed 264
without EDTA, the highest fluxes to DGT were obtained in the basic sediment spiked with 50 mg 265 2 3 4 5 6 7 8 9 10 11 12 13 14 15 16 17 18 19 20 21 22 23 24 25 26 27 28 29 30 31 32 33 34 35 36 37 38 39 40 41 42 43 44 45 46 47 48 49 50 51 52 53 54 55 56 57 58
(Cu).kg-1 (SB50), and significantly lower fluxes were observed in the other sediments formulated with 266
peat and goethite and spiked with 50 mg (Cu).kg-1 (SG50, SP50 and SPG50). In addition, two curves 267
in the fluxes are observed depending on the composition of the sediment: (i) a rapid decrease of the 268
flux during the first 96 hours of deployment followed by a continuous decrease with a lower slope 269
during the rest of the test and (ii) a decrease of the flux during the initial hours followed by a 270
stabilization of the flux from 24 h to the end of the experiment. The mean and the 5th and 95th 271
percentile simulated fluxes using the DGT-PROFS model are also given in the Figure 2. The good 272
agreement between the simulated and measured fluxes enhances the relevance of the modeling and 273
fitting procedure. 274
The fluxes of copper to DGT for the other sediments are available in the supporting information 275
(Figure S1). Briefly, the shape of the fluxes remains the same for each sediment composition 276
regardless of the variation of total copper concentrations or the addition of EDTA. However, an 277
increase in the spiking concentration as well as the addition of EDTA leads to an increase in the flux 278
values. The SB50 (E) and SG50 (E) experiments were not simulated because too much uncertainty 279
exists for certain data. 280
3. Discussion
281
One aim of the study was the comparison of the copper accumulation in plants and in the passive 282
sampler DGT. However, due to the different constraints of the exposure conditions between the 283
bioassay and DGT experiments, the physico-chemical conditions diverged for a given type of 284
sediment. It was therefore necessary to correct the DGT data to better mimic the conditions of the 285
bioassay. For this purpose, assuming that the key parameters αweak, kdes1, kdes2, and Dsed obtained from 286
the DGT-PROFS modeling were constant for a given test, the copper pore-water concentration for a 287
given bioassay was used to simulate the corresponding accumulation in DGT under this slightly 288
modified condition (designated as corrected values hereafter). 289
3-1 Copper lability and resupply from solid phase
290 291
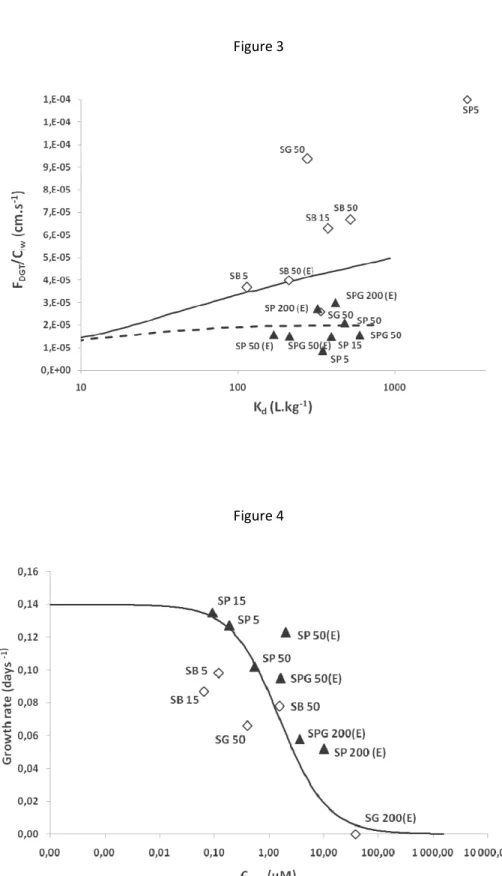
Figure 3 presents the theoretical DGT fluxes relative to the solution concentration (using DIFS 292
modeling) as a function of the Kd for fast (full line, Tc 10 s) and slow desorptions (Tc 1000 s) 293
obtained from Degryse and co-workers [9] for DGT sampling at 24 h, in which the data of the present 294
study were added. Three different trends can be observed according to the kinetic characteristics: slow, 295
intermediate and fast kinetics of desorption. Fast desorption kinetics were obtained for sediments 296
composed without peat, and slow desorption kinetics were obtained for sediments containing peat. 297
However, as the DIFS model considers all complexes in the solution to be fully labile, the resupply 298
from the solid phase may be underestimated in the presence of complexes in the solution that are not 299
fully labile as copper binds to organic matter. Therefore, the desorption kinetics from sediments 300 2 3 4 5 6 7 8 9 10 11 12 13 14 15 16 17 18 19 20 21 22 23 24 25 26 27 28 29 30 31 32 33 34 35 36 37 38 39 40 41 42 43 44 45 46 47 48 49 50 51 52 53 54 55 56 57 58
containing peat may be underestimated. Indeed, this representation gives information on the solid 301
phase behavior for a given time (24 h) and does not take into account its evolution over the time of the 302
experiment. Therefore, the description of the fluxes’ evolution over time gives supplementary 303
information. 304
Two different trends of the fluxes of copper to the DGT were observed for the different sediments 305
tested: constant and decreasing fluxes (Figure 2 and Figure S1 in Supporting Information). Harper and 306
co-workers [13] proposed a classification of fluxes to quantify the “copper lability” according to four 307
typical cases. In our study, we observed the “partially sustained case” for all sediments containing peat 308
(SP and SPG) and the “non-steady state case” for all basic sediments and for the sediments coated 309
with goethite (SB and SG). For sediments belonging to the partially sustained case, the desorption 310
capacity of the metal from the solid phase is sufficient to maintain a constant flux of copper to the 311
DGT device (at least over the time experiment). For sediments belonging to the non-steady state case, 312
the copper flux to the DGT decreases over time, indicating that the resupply from the solid phase is 313
slow. Considering the intensity of the fluxes, significantly high fluxes during the 24 first hours were 314
obtained in the basic sediments. The basic sediments are principally composed of quartz and kaolinite. 315
We can therefore assume that the high initial flux is due to a high initial concentration of the available 316
copper in solution (Ciw). The following decline of the fluxes may be related to a slow resupply due to 317
copper adsorption to strong bonding-energy sites (kaolinite) [22]. In the case of the sediments coated 318
with goethite, similar curves were observed but with significantly lower fluxes. Indeed, it is well 319
known that iron oxides have a high affinity for metals and that the addition of iron increases the 320
fraction of copper associated to strong sites. As the pH of the sediment is lower than the zero point 321
charge of goethite (7.9), goethite is positively charged [18]. Under these conditions, copper adsorption 322
on goethite results from the formation of inner-sphere complexes (chemisorptions), leading to a strong 323
fixation. The sediments containing peat also lead to significantly lower fluxes than in the basic 324
sediment. The lower values of fluxes can be related to a lower available pool of copper in the system. 325
Moreover, these lower values are also due to a lower velocity of organic-copper complexes in the pore 326
water (Dsed) and the fact that organo-metallic complexes composed of fulvic or humic acids are only 327
partially labile [23]. The slight decrease of the fluxes followed by a rapid stabilization over time 328
suggests that the peat have the ability to resupply copper easily to the pore water. Concerning the other 329
set of experiments in the supporting Information, the same behavior is observed for the same sediment 330
composition with higher fluxes in the presence of EDTA and for increasing copper spiking 331
concentrations related to higher available pools of dissolved copper in the sediments. 332
All of these qualitative features are confirmed by the values of the DGT-PROFS model parameters 333
that were fitted for each experiment (Table S2 in Supporting Information). The αweak parameter, which 334
represents the proportion of particulate metal associated to weak sites, is much lower for the SG50 335
sediment (0.06) than for the SP50 or SPG50 sediments (0.37 and 0.2), which confirms that the ability 336
to resupply copper to the water phase is lower with iron oxide addition. The lowest value of the Dsed 337 2 3 4 5 6 7 8 9 10 11 12 13 14 15 16 17 18 19 20 21 22 23 24 25 26 27 28 29 30 31 32 33 34 35 36 37 38 39 40 41 42 43 44 45 46 47 48 49 50 51 52 53 54 55 56 57 58
parameter, which represents the diffusion coefficient of metal in sediment, was obtained for the SP50 338
sediment (2.2.10-6 cm2.s-1 compared to 6.2.10-6 cm2.s-1 for the SB50 sediment), which confirms that the 339
presence of organic matter in the pore water significantly decreases the diffusion velocity and the 340
resupply potential at the water-DGT interface. 341
3-2 Comparison of different tools to assess copper bioavailability
342
To relate the "actual bioavailability" measured by the plant M. aquaticum to the "potential 343
bioavailability" estimated by different chemical measurements in the sediment, including DGT 344
measurements, we first investigated whether a significant linear correlation could be observed between 345
the copper concentration in plant and (i) the total dissolved copper concentration, (ii) the free copper 346
concentration (iii) and the mean labile concentration derived from DGT (CDGT) in the sediment (Figure 347
5). The comparison between the total dissolved copper concentrations with the bioaccumulation in the 348
M. aquaticum results in a poor correlation, with a R2 of 0.05 indicating that the total dissolved 349
concentration does not represent the readily bioavailable fraction for plants. The free copper 350
concentration in the pore water was obtained for each sediment by using the speciation program 351
WHAM VI [24] (details in Table S3 in Supporting Information). The comparison between the free 352
copper concentrations and the copper concentration in plant also showed a poor correlation, with a R2 353
of 0.08. Finally, the comparison between the DGT measurement and the copper concentration in 354
plants resulted in an improved, but still poor, correlation, with a R2 of 0.6 (Figure 3). 355
One reason for the above poor correlations might be the presence of growth inhibition in the sediments 356
tested depending on the composition and copper content of the sediments (Figures 1 and 4). Indeed, in 357
the literature, good correlations between the DGT-measured labile copper and the accumulation in 358
some plants were obtained only in the cases of plants exposed to non-toxic concentrations [9, 16, 25]. 359
Assuming that the growth rate is maximal for low copper concentrations until a threshold where toxic 360
effects arise and that a zero growth rate is reached at high copper concentrations, a theoretical relation 361
between the DGT labile concentrations and the growth rate can be drawn (Figure 4; mathematical 362
relation (Eq. S1) in supporting information). This predicted relation between the DGT and the growth 363
rate agrees with our experimental results (Figure 4) and shows that all the sediments tested are in the 364
range of concentrations inducing a toxic effect on the plant, with high growth rate variations. Indeed, 365
M. aquaticum growth began to decrease when the DGT was above 92 µM. However, there is a high 366
variation in the DGT and growth rate measurements between the different sediments tested, which is 367
certainly related to the difference in the copper uptake by the plants according to the toxicity of the 368
sediment compositions. 369
The relationship between the plant uptake and the fluxes recorded by the DGT can help to determine 370
the ability of DGT to mimic the plant uptake. Degryse and co-workers [9] , reported such relationships 371
for the uptake of Zn and Cd by watercress and spinach, respectively (Figure 5). Plotting our results for 372
copper in the case of M. aquaticum on Figure 5 shows that the plant uptake fluxes do not increase in a 373 2 3 4 5 6 7 8 9 10 11 12 13 14 15 16 17 18 19 20 21 22 23 24 25 26 27 28 29 30 31 32 33 34 35 36 37 38 39 40 41 42 43 44 45 46 47 48 49 50 51 52 53 54 55 56 57 58
directly proportional manner with DGT fluxes, i.e., a 10-fold increase in DGT flux does not result in a 374
10-fold increase in plant uptake fluxes or plant concentrations. Considering that DGT mimics the 375
action of the plant only under diffusion-limited conditions, the absence of correlation suggests that Cu 376
uptake is not diffusion-limited in our case. If there is no diffusion limitation, labile complexes (that are 377
not taken up) will not contribute to the plant uptake, but the uptake will be governed by the free metal 378
ion activity and the activity of competing ions (e.g., Ca2+, Mg2+, and H+; cf. BLM concept) [9]. In the 379
present study, the free Cu (Cu2+) was low, especially in the presence of peat (Table 1). The apparently 380
low Cu2+ should promote conditions for a diffusion limitation that are not observed. In fact, there is 381
most likely a large contribution of labile complexes leading to a continuous availability of sufficient 382
Cu2+ forthe plant uptake, which results in no diffusion limitation conditions. 383
Moreover, this study showed that in the wide range of sediments tested, the normalized bioassay was 384
sensitive to copper and was able to accumulate it. These data provide support for other studies that 385
have shown a strong sensitivity of M. aquaticum toward sediments contaminated with metals [8]. Until 386
now, the M. aquaticum was commonly used in toxicity tests on pesticides [26, 27]; thus, these results 387
show the interest of this new bioassay for the assessment of risks associated with metal contamination 388
and the need to go further in the knowledge of its sensitivity towards metals. The recently normalized 389
sediment biotest using M. aquaticum appears to be a sensitive tool for the assessment of copper-390
contaminated sediments; however, further research is needed to assess this test’s sensitivity toward 391
other metals. 392
Supporting Information.
393
Details on physico-chemical characteristics of pore water, flux of copper to DGT versus time and 394
modeling using the DGT PROFS model, DGT PROFS model parameters, WHAM VI modeling of the 395
different sediments investigated and on the plant growth rate modeling. 396
397
Acknowledgements: This study was funded by EDF (Eléctricité de France) and the Agence National
398
de Recherche (ANR, FRANCE; ANR-07-ECOT-0794C0111). The PhD grant of Amélie Caillat was 399
funded by EDF with a grant attributed by ANRT (CIFRE 874/2009) 400 401 2 3 4 5 6 7 8 9 10 11 12 13 14 15 16 17 18 19 20 21 22 23 24 25 26 27 28 29 30 31 32 33 34 35 36 37 38 39 40 41 42 43 44 45 46 47 48 49 50 51 52 53 54 55 56 57 58
References
402
[1] Zhang H, Zhao FJ, Sun B, Davison W and McGrath SP, A new method to measure effective soil 403
solution concentration predicts copper availability to plants, Environmental Science & Technology 404
2001, 35, 2602-2607.
405
[2] Feiler U, Ahlf W, Hoess S, Hollert H, Neumann-Hensel H, Meller M, Weber J and Heininger P, The 406
SeKT Joint Research Project: Definition of reference conditions, control sediments and toxicity 407
thresholds for limnic sediment contact tests, Environmental Science and Pollution Research 2005, 12, 408
257-258. 409
[3] Tuikka AI, Schmitt C, Höss N, Bandow N, Von der Ohe D, De Zwart E, De Deckere G, Streck S, 410
Mothes B, Van Hattum A, Kocan R, Brix W, Brack D, Barceló AJ and J.V.K. SaK, Toxicity assessment of 411
sediments from three European river basins using a sediment contact test battery, Ecotoxicology and 412
Environmental Safety 2011, 74, 123-131. 413
[4] Feiler U, Höss S, Ahlf W, Gilberg D, Hammers-Wirtz M, Hollert H, Meller M, Neumann-Hensel H, 414
Ottermanns R, Seiler T-B, Spira D and Heininger P, Sediment contact tests as a tool for the 415
assessment of sediment quality in German waters, Environmental Toxicology and Chemistry 2013, 32, 416
144-155. 417
[5] Feiler U, Kirchesch I and Heininger P, A new plant-based bioassay for aquatic sediments, Journal 418
of Soils and Sediments 2004, 4, 261-266. 419
[6] Cardwell AJ, Hawker DW and Greenway M, Metal accumulation in aquatic macrophytes from 420
southeast Queensland, Australia, Chemosphere 2002, 48, 653-663. 421
[7] Kamal M, Ghaly AE, Mahmoud N and Côté R, Phytoaccumulation of heavy metals by aquatic 422
plants, Environment International 2004, 29, 1029-1039. 423
[8] Stesevic D, Feiler U, Sundic D, Mijovic S, Erdinger L, Seiler TB, Heininger P and Hollert H, 424
Application of a new sediment contact test with Myriophyllum aquaticum and of the aquatic Lemna 425
test to assess the sediment quality of Lake Skadar, Journal of Soils and Sediments 2007, 7, 342-349. 426
[9] Degryse F, Smolders E, Zhang H and Davison W, Predicting availability of mineral elements to 427
plants with the DGT technique: a review of experimental data and interpretation by modelling. , 428
Environmental Chemistry 2009, 6. 429
[10] Zhang H, Davison W, Knight B and McGrath S, In situ measurements of solution concentrations 430
and fluxes of trace metals in soils using DGT, Environmental Science & Technology 1998, 32, 704-710. 431
[11] Harper MP, Davison W, Zhang H and Tych W, Kinetics of metal exchange between solids and 432
solutions in sediments and soils interpreted from DGT measured fluxes, Geochimica et Cosmochimica 433 Acta 1998, 62, 2757-2770. 434 2 3 4 5 6 7 8 9 10 11 12 13 14 15 16 17 18 19 20 21 22 23 24 25 26 27 28 29 30 31 32 33 34 35 36 37 38 39 40 41 42 43 44 45 46 47 48 49 50 51 52 53 54 55 56 57 58
[12] Zhao F-J, Rooney CP, Zhang H and McGrath SP, Comparison of soil solution speciation and 435
diffusive gradients in thin-films measurement as an indicator of copper bioavailability to plants, 436
Environmental Toxicology and Chemistry 2006, 25, 733-742. 437
[13] Harper MP, Davison W and Tych W, DIFS - a modelling and simulation tool for DGT induced trace 438
metal remobilisation in sediments and soils, Environmental Modelling & Software 2000, 15, 55-66. 439
[14] Ciffroy P, Nia Y and Garnier JM, Probabilistic Multicompartmental Model for Interpreting DGT 440
Kinetics in Sediments, Environmental Science & Technology 2011, 45, 9558-9565. 441
[15] Nia Y, Garnier JM, Rigaud S, Hanna K and Ciffroy P, Mobility of Cd and Cu in formulated 442
sediments coated with iron hydroxides and/or humic acids: A DGT and DGT-PROFS modeling 443
approach, Chemosphere 2011, 85, 1496-1504. 444
[16] Almas AR, Lombnaes P, Sogn TA and Mulder J, Speciation of Cd and Zn in contaminated soils 445
assessed by DGT-DIFS, and WHAM/Model VI in relation to uptake by spinach and ryegrass, 446
Chemosphere 2006, 62, 1647-1655. 447
[17] Flemming CA and Trevors JT, Copper Toxicity and Chemistry in the Environment - a Review, 448
Water Air and Soil Pollution 1989, 44, 143-158. 449
[18] Rusch B, Hanna K and Humbert B, Coating of quartz silica with iron oxides: Characterization and 450
surface reactivity of iron coating phases, Colloids and Surfaces A: Physicochemical and Engineering 451
Aspects 2010, 353, 172-180. 452
[19] Keller C, Hammer D, Kayser A, Richner W, Brodbeck M and Sennhauser M, Root development 453
and heavy metal phytoextraction efficiency: comparison of different plant species in the field, Plant 454
and Soil 2003, 249, 67-81. 455
[20] Bervoets L, Voets J, Covaci A, Chu S, Qadah D, Smolders R, Schepens P and and Blust R, Use of 456
transplanted zebra mussels (Dreissena polymorpha) to assess the bioavailability of 457
Microcontaminants in Flemish surfacewaters., environmental Science & Technology 2005, 39, 1492-458
1505. 459
[21] Zhang H and Davison W, Diffusional characteristics of hydrogels used in DGT and DET 460
techniques, Analytica Chimica Acta 1999, 398, 329-340. 461
[22] Yavuz O, Altunkaynak Y and Guzel F, Removal of copper, nickel, cobalt and manganese from 462
aqueous solution by kaolinite, Water Research 2003, 37, 948-952. 463
[23] Ferreira D, Tousset N, Ridame C and Tusseau-Vuillemin M-H, More than inorganic copper is 464
bioavailable to aquatic mosses at environmentally relevant concentrations, Environmental Toxicology 465
and Chemistry 2008, 27, 2108-2116. 466
[24] Tipping E, Humic ion-binding model VI: An improved description of the interactions of protons 467
and metal ions with humic substances, Aquatic Geochemistry 1998, 4, 3-48. 468 2 3 4 5 6 7 8 9 10 11 12 13 14 15 16 17 18 19 20 21 22 23 24 25 26 27 28 29 30 31 32 33 34 35 36 37 38 39 40 41 42 43 44 45 46 47 48 49 50 51 52 53 54 55 56 57 58
[25] Bravin M, Garnier C, Lenoble V, Gérard F, Dudal Y and Hinsinger P, Root-induced changes in pH 469
and dissolved organic matter binding capacity affect copper dynamic speciation in the rhizosphere, 470
Geochimica et Cosmochimica Acta 2012, 84, 256-268. 471
[26] Turgut C and Fomin A, Sensitivity of the rooted macrophyte Myriophyllum aquaticum (Vell.) 472
Verdcourt to seventeen pesticides determined on the basis of EC50, Bulletin of Environmental 473
Contamination and Toxicology 2002, 69, 601-608. 474
[27] Teodorović I, Knežević V, Tunić T, Čučak M, Lečić JN, Leovac A and Tumbas II, Myriophyllum 475
aquaticum versus Lemna minor: Sensitivity and recovery potential after exposure to atrazine, 476
Environmental Toxicology and Chemistry 2012, 31, 417-426. 477
[28] Zhang H, Lombi E, Smolders E and McGrath S, Kinetics of Zn release in soils and prediction of Zn 478
concentration in plants using Diffusive Gradients in Thin Films, Environmental Science & Technology 479
2004, 38.
480
[29] Oporto C, Smolders E, Degryse F, Verheyen L and Vandecasteele C, DGT-measured fluxes explain 481
the chloride-enhanced cadmium uptake by plants at low but not at high Cd supply, Plant and Soil 482 2009, 318, 127-135. 483 484 485 486 2 3 4 5 6 7 8 9 10 11 12 13 14 15 16 17 18 19 20 21 22 23 24 25 26 27 28 29 30 31 32 33 34 35 36 37 38 39 40 41 42 43 44 45 46 47 48 49 50 51 52 53 54 55 56 57 58
487
488
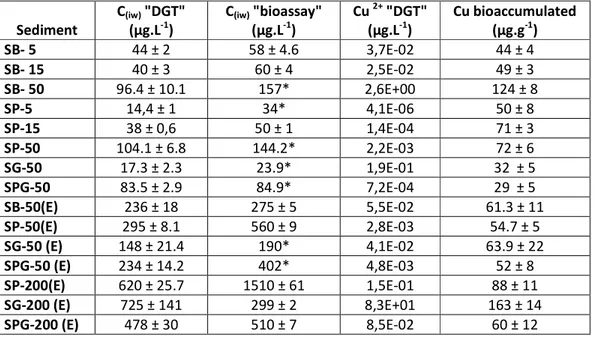
Table 1: Copper pore-water concentrations (Ciw; µg.l-1) in DGT and bioassay experiment, free copper 489
concentration (Cu2+; µg.l-1) and copper accumulated in M. aquaticum in the different sediments (µg.g -490
1
) for the different sediments studied (see text for nomenclature). “DGT” stands for DGT experiment, 491
and “Bioassay”: stands for bioassay experiment. Cu2+ was calculated with WHAM VI (Tipping (24), 492
see details in the Table S2 in Supporting Information). The values of experimental data represent 493
average values: for all the DGT n=15; for the bioassay experiment, there are less replicates because 494
the measurements was only performed at the end of the experiment; for Cu (iw), n=2 or n=1 (*) and, for 495 bioaccumulation, n=3. 496 497 498 499 500 501 502 503 504 505 506 507 508 509 Sediment C(iw) "DGT" (µg.L-1) C(iw) "bioassay" (µg.L-1) Cu 2+ "DGT" (µg.L-1) Cu bioaccumulated (µg.g-1) SB- 5 44 ± 2 58 ± 4.6 3,7E-02 44 ± 4 SB- 15 40 ± 3 60 ± 4 2,5E-02 49 ± 3 SB- 50 96.4 ± 10.1 157* 2,6E+00 124 ± 8 SP-5 14,4 ± 1 34* 4,1E-06 50 ± 8 SP-15 38 ± 0,6 50 ± 1 1,4E-04 71 ± 3 SP-50 104.1 ± 6.8 144.2* 2,2E-03 72 ± 6 SG-50 17.3 ± 2.3 23.9* 1,9E-01 32 ± 5 SPG-50 83.5 ± 2.9 84.9* 7,2E-04 29 ± 5 SB-50(E) 236 ± 18 275 ± 5 5,5E-02 61.3 ± 11 SP-50(E) 295 ± 8.1 560 ± 9 2,8E-03 54.7 ± 5 SG-50 (E) 148 ± 21.4 190* 4,1E-02 63.9 ± 22 SPG-50 (E) 234 ± 14.2 402* 4,8E-03 52 ± 8 SP-200(E) 620 ± 25.7 1510 ± 61 1,5E-01 88 ± 11 SG-200 (E) 725 ± 141 299 ± 2 8,3E+01 163 ± 14 SPG-200 (E) 478 ± 30 510 ± 7 8,5E-02 60 ± 12 2 3 4 5 6 7 8 9 10 11 12 13 14 15 16 17 18 19 20 21 22 23 24 25 26 27 28 29 30 31 32 33 34 35 36 37 38 39 40 41 42 43 44 45 46 47 48 49 50 51 52 53 54 55 56 57 58
510 511 2 3 4 5 6 7 8 9 10 11 12 13 14 15 16 17 18 19 20 21 22 23 24 25 26 27 28 29 30 31 32 33 34 35 36 37 38 39 40 41 42 43 44 45 46 47 48 49 50 51 52 53 54 55 56 57 58
512 513 2 3 4 5 6 7 8 9 10 11 12 13 14 15 16 17 18 19 20 21 22 23 24 25 26 27 28 29 30 31 32 33 34 35 36 37 38 39 40 41 42 43 44 45 46 47 48 49 50 51 52 53 54 55 56 57 58
Figure Captions
Figure 1 : Growth rate (days-1) and growth inhibition (%) of Myriophyllum aquaticum after exposure to control and spiked sediments. “SB” corresponds to the basic sediment, “SG” to the sediment coated with goethite, “SP” to the sediment formulated with peat and “SPG” to the sediment formulated with peat and goethite. “E” represents sediments formulated with EDTA. The errors were calculated from n=10 for controls and n=25 for contaminated samples.
Figure 2 : Copper fluxes resupply (mg.cm-2.s-1) from particulate phases in sediments SB, SP, SG, SPG spiked at 50 mg.kg-1 (see text and Figure 1 for nomenclature) as a function of time. The replicates of the measured fluxes are represented by the three different open symbols. The full line represents mean flux calculated by the DGT PROFS model. The upper and lower dotted lines represent the 5th and 95th percentiles respectively.
Figure 3 : Flux to DGT relative to copper pore-water concentration (FDGT/Ciw) as a function of Kd (L.kg-1) for all the sediments studied in the presence of peat (full triangle) or absence of peat (empty diamond); (see text and Figure.1 for nomenclature). The full and dotted lines represents theoretical data for slow (dotted line) and fast desorption kinetics obtained from8.
Figure 4 : Relationship between growth rate and DGT copper concentrations (µM) for all the
sediments studied in the presence of peat (full triangle) or absence of peat (empty diamond); (see text and Figure.1 for nomenclature). The full line represents the theoretical relation between the corrected DGT concentration (see text) and the growth rate (mathematical equation (Eq. S1) is presented in Supporting Information) based on several assumptions developed in the text.
Figure 5 : Relationship between fluxes to DGT (pmol.cm-2.s-1 ; 14 days, corrected values; see text) and copper accumulation in plants (mmol.kg-1) for all the sediments studied in the presence of peat (full triangle) or absence of peat (empty diamond); (see text and Figure.1 for nomenclature). The full line represents the theoretical limiting diffusive flux. The dotted line and the black circles represent the theoretical plant demand and the theoretical plant uptake respectively8. The circles represent zinc uptake by watercress (Lepidium sativum) and DGT measurements determined for a range of soils sampled near galvanized structures26. The crosses represent cadmium uptake by spinach and DGT measurements at varying NaCl doses at background cadmium concentration or soils amended by Cd-salt27. 2 3 4 5 6 7 8 9 10 11 12 13 14 15 16 17 18 19 20 21 22 23 24 25 26 27 28 29 30 31 32 33 34 35 36 37 38 39 40 41 42 43 44 45 46 47 48 49 50 51 52 53 54 55 56 57 58
Figure 1 Figure 2 2 3 4 5 6 7 8 9 10 11 12 13 14 15 16 17 18 19 20 21 22 23 24 25 26 27 28 29 30 31 32 33 34 35 36 37 38 39 40 41 42 43 44 45 46 47 48 49 50 51 52 53 54 55 56 57 58
Figure 3 Figure 4 2 3 4 5 6 7 8 9 10 11 12 13 14 15 16 17 18 19 20 21 22 23 24 25 26 27 28 29 30 31 32 33 34 35 36 37 38 39 40 41 42 43 44 45 46 47 48 49 50 51 52 53 54 55 56 57 58
Figure 5 2 3 4 5 6 7 8 9 10 11 12 13 14 15 16 17 18 19 20 21 22 23 24 25 26 27 28 29 30 31 32 33 34 35 36 37 38 39 40 41 42 43 44 45 46 47 48 49 50 51 52 53 54 55 56 57 58