HAL Id: ird-00591848
https://hal.ird.fr/ird-00591848
Submitted on 11 May 2011
HAL is a multi-disciplinary open access archive for the deposit and dissemination of sci-entific research documents, whether they are pub-lished or not. The documents may come from teaching and research institutions in France or abroad, or from public or private research centers.
L’archive ouverte pluridisciplinaire HAL, est destinée au dépôt et à la diffusion de documents scientifiques de niveau recherche, publiés ou non, émanant des établissements d’enseignement et de recherche français ou étrangers, des laboratoires publics ou privés.
caught in Atlantic tuna fisheries
Haritz Arrizabalaga, Paul de Bruyn, Guillermo A. Diaz, Hilario Murua, Pierre
Chavance, Alicia Delgado de Molina, Daniel Gaertner, Javier Ariz, Jon Ruiz,
Laurence T. Kell
To cite this version:
Haritz Arrizabalaga, Paul de Bruyn, Guillermo A. Diaz, Hilario Murua, Pierre Chavance, et al.. Productivity and susceptibility analysis for species caught in Atlantic tuna fisheries. Aquatic Living Resources, EDP Sciences, 2011, 24 (1), pp.1-12. �10.1051/alr/2011007�. �ird-00591848�
Productivity and susceptibility analysis for species caught in Atlantic tuna fisheries
Haritz Arrizabalaga1*, Paul de Bruyn1, Guillermo A. Diaz2, Hilario Murua1, Pierre Chavance3, Alicia Delgado de Molina4, Daniel Gaertner3, Javier Ariz4, Jon Ruiz5,
5
Laurence T. Kell6
1
AZTI Tecnalia. Herrera Kaia Portualdea z/g. 20110 Pasaia Spain. Tel: +34 946574000 Fax: +34 946572555; email*: harri@azti.es
2 NOAA/NMFS 1315 East-West Highway, Silver Spring, MD, 20910 US
10
3 IRD Avenue Jean Monnet - BP 171, 34203 Sète cedex, France
4 IEO C.O. de Canarias, Apartado 1373, 38080 Santa Cruz de Tenerife, Islas Canarias, Spain 5 AZTI Tecnalia. Txatxarramendi Ugartea z/g Sukarrieta Spain
6 ICCAT Corazón de Maria 8, 28002 Madrid, Spain.
15
Abstract
Ecological risk assessment is a useful methodology for assisting the management of fisheries from an ecosystem perspective. Atlantic tuna fisheries, managed by the
20
International Commission for the Conservation of Atlantic Tunas (ICCAT), are economically important and interact with several bycatch species. In spite of these interactions, no comprehensive ecological risk assessment has been conducted for bycatch species caught in ICCAT fisheries. In this paper, we followed a two stage approach with the objective of assessing the relative risk of species being negatively
25
impacted by Atlantic tuna fisheries. An analysis of the ICCAT bycatch species list (which includes all species reported to have interacted with different tuna fishing gears operating in the Atlantic) revealed that most of these species are caught in longline fisheries, followed by gillnets and purse seines. According to the IUCN red list, 7 species of the ICCAT bycatch list (3 coastal sharks, 3 sea turtles and one seabird) are
30
categorized as critically endangered. In our study, and based on their life history characteristics, marine mammals and coastal sharks caught in ICCAT fisheries showed the highest intrinsic vulnerability values. A productivity susceptibility analysis for the European Union (EU) tropical tuna purse seine fleet and the United States (US) pelagic longline fleet revealed two groups with high relative risk scores. The first one included
pelagic and coastal sharks, characterized by relatively low productivities, and the second one included teleosts, characterized by higher productivities but high
susceptibility to purse seine and longline gears. Some alternative approaches to conduct productivity susceptibility analyses in the context of ecological risk assessments are discussed.
40
Keywords
Ecological risk assessment, productivity, susceptibility, ecosystem approach, bycatch, purse seine, longline
45
Introduction
Risk assessment approaches are commonly used to assist fishery management (Francis and Shotten 1997), but they are less developed in the framework of the ecosystem approach to fisheries management. Murawski (2000) highlighted the lack of consensus
50
for defining “ecosystem overfishing” and suggested the need for objective metrics that gauge properties associated with the main features of the ecosystem (e.g. production, diversity, and variability). To evaluate management options that are both scientifically credible and economically practical regarding the use of ecosystems, decision makers require information regarding the effects of fishing on ecological processes, as well as
55
on human activities. With respect to the first point, the ecological risk assessment framework (ERA) appears as a relevant methodology to provide ecosystem indicators and to enable implementation of an ecosystem approach to fisheries management. Ecological risk assessments were first proposed in the 1980s (Hope 2006) and a variety of different approaches have subsequently been developed (e.g. Scandol et al. 2009).
60
Astles (2008) provided a review of recent developments of ERA in marine fisheries and the elements required to estimate ecological risk. There is a particular need for a simple and transparent way to classify marine stocks and their limits to controllable
exploitation in order to prioritise data collection, scientific assessment, and management action.
65
Quantitative assessments relying on increasingly complex mathematical models have been used to predict the response of the ecological receptor to a changing environment, while qualitative risk assessments use a combination of attributes of the ecosystem, ecological receptor and stressor (Astles et al. 2006). Some authors (e.g. Griffiths et al.
2006) have suggested that qualitative risk assessments that provide relative indicators of
70
risk may be inadequate for reflecting even the most obvious changes in fishing impacts on bycatch species as induced by concrete management actions. However, although quantitative ecosystem models have clearly improved the understanding of the dynamics of marine populations (Hollowed et al. 2000), there are a myriad of factors and processes influencing these systems and ecosystem models may have poor
75
predictive capability. Also, in many cases quantitative assessments can only be conducted for a limited number of species, generally the most valuable ones. Consequently, qualitative assessments have been used as a tool to identify which species should be the subject of quantitative assessment (Smith et al. 2007) and to prioritize issues for fisheries management (Fletcher 2005; Fletcher et al. 2005).
80
There are only few methods that are useful for assessing large numbers of species for which biological data are scarce (Dulvy et al. 2004). Qualitative risk assessments have proved to be important at this initial stage of the assessment of ecosystem state by providing the relative risks of species to prioritize research and management (e.g. Stobutzki et al. 2001a,b). In contrast, quantitative assessments require more data and are
85
usually applied to a more restricted group of species (e.g. Goldsworthy and Page 2007; Zhou and Griffiths 2008; Zhou et al. 2009).
To date, application of ERAs to fisheries that include species and species groups of significantly different nature (e.g. marine mammals, turtles, sharks and teleosts) are scarce. The development of comprehensive ERAs is essential to not exclude potentially
90
important species from the overall analysis at an early stage. An ERA can provide a transparent methodology to pursue more complex risk assessments and/or take
immediate management action for a range of species and fisheries. This is of particular relevance if it involves a hierarchical approach that moves from a comprehensive, but largely qualitative analysis of risk (level 1), to a more focused and semi-quantitative
95
approach (level 2), and finally to a highly focused and fully quantitative approach (level 3, Hobday et al. 2011; Smith et al. 2007). Level 1 (Scale, Intensity, Consequence Analysis) evaluation of risk is mostly based on the perception from interaction with stakeholders, level 2 (Productivity Susceptibility Analysis, PSA) is semi-quantitative in nature but it relies on a good scientific basis, and level 3 is fully quantitative (full stock
100
assessment and analysis of uncertainty).
Tuna and tuna-like species are important socio-economic resources worldwide, both for industrial fleets operating in distant waters as well as for artisanal fleets operating in
coastal waters. Until recently, there have been few ERA applications to tuna and tuna-like fisheries, in spite of the fact that many bycatch species are caught in association
105
with the main target species. Kirby (2006) conducted a PSA analysis for species caught in the Western and Central Pacific Ocean tuna fisheries which included marine
mammals, turtles, teleosts, sharks and seabirds. This approach was also applied in the Indian Ocean by Murua et al. (2009). In the Atlantic, Cortés et al. (2009) conducted a PSA analysis restricted to eleven species of pelagic elasmobranches in order to assess
110
their vulnerability to pelagic longline fisheries. Also, the seabird assessment conducted by the International Commission for the Conservation of Atlantic Tunas (ICCAT, 2008) included an initial PSA analysis that facilitated the identification of those seabird
species most at risk, and those for which a fully quantitative risk assessment could be pursued.
115
In this paper we followed a two step approach with the objective of assessing the relative risk of both target and bycatch species being negatively impacted by Atlantic tuna fisheries managed by ICCAT. First, a general descriptive analysis of species caught in ICCAT fisheries was conducted which included all species reported caught and all gears operating in the Atlantic tuna fisheries. The gears that interact with the
120
most species groups were identified. Also, the biological characteristics and the intrinsic vulnerability of the species were analyzed. Secondly, a productivity and susceptibility analysis was conducted for two fleets for which data collected by scientific observer programs were readily available (i.e., EU Purse Seine and US Pelagic Longline fleets) with the aim of ranking the species most at risk. In this paper, we refer to productivity
125
as the capacity of the stock to rapidly recover when depleted, whereas susceptibility is the potential for the stock to be negatively impacted by the fishery (Patrick et al 2010). Some alternative approaches to conduct productivity susceptibility analyses in the context of ecological risk assessments are also discussed.
130
Material and Methods
As a first step, we reviewed the list of all the ICCAT bycatch species that have been reported as caught in tuna fisheries. The ICCAT bycatch list includes 242 species recorded as having been caught by a major tuna fishery in the Atlantic at some time.
135
The database includes information from three basic sources: (i) catch reports by the different countries, (ii) scientific documents presented to the ICCAT Standing
Committee for Research and Statistics, and, mainly, (iii) a survey in which each country’s experts identified the species that have ever interacted with their fisheries. The presence of a species in the list does not imply that it is caught in significant
140
quantities, or that the individuals caught died as a result of the interaction. In fact, the database does not provide any information on the level or amount of catches and it is only a register of species names associated to one or various fishing gears (available at http://www.iccat.int/en/bycatchspp.htm). Neither there is any information about the potential fraction of species caught but not reported. We assumed that a reasonably high
145
amount of the species interacting with Atlantic tuna fisheries are included in this database, and we used it to identify the contribution of each of the main fishing gears operating in the Atlantic (i.e. baitboat, gillnets, harpoon, longline, purse seine, traps and others) to the total bycatch and bycatch by species groups i.e. Scombridae and billfish, other teleosts, skates and rays, coastal sharks, pelagic sharks, marine mammals, sea
150
turtles and seabirds in the ICCAT Convention area. Nineteen of the 242 species recorded in the database were only identified to the genera or the family level.
Therefore, in order to avoid potential duplication, we only used records identified to the species level.
We consulted web based libraries (Froese and Pauly 2010, Palomares and Pauly 2010,
155
www.searoundus.org, http://www.flmnh.ufl.edu/fish/) as well as published literature (Compagno 2001; ICCAT 2010; Jefferson et al. 1994; Marquez 1990), to collate additional information about life history parameters. The basic information collected included maximum length, length at maturity, intrinsic vulnerability (according to Cheung et al. 2005; Cheung et al. 2007) and IUCN red list status (IUCN 2010). The
160
intrinsic vulnerability index measures vulnerability to exploitation based on life history traits (as opposed to total vulnerability that also takes into account environmental or fishing effects), while the IUCN status also considers population trends.
This information was used to calculate the average intrinsic vulnerability of all species within a group and of all species by gear type. Also, the number of species affected by
165
ICCAT fisheries in the different categories of the IUCN red list, namely not evaluated (NE), data deficient (DD), least concern (LC), near threatened (NT), vulnerable (VU), endangered (EN) and critically endangered (CR), and the relative contribution of each fishing gear to the bycatch of those species was also analyzed.
Finally, we used data collected by scientific observer programs to conduct a
170
tropical tuna purse seine fishery operating in the eastern equatorial Atlantic and the US pelagic longline fishery operating in the northwestern Atlantic. The European tropical tuna purse seine fishery observer program has an observer coverage ranging between 5% and 10% and the dataset used includes years 2003 to 2007 (Amande et al. 2010),
175
while the observer coverage for the US pelagic longline fishery ranges between 6% and 9% and the dataset includes years 1992 to 2008 (Diaz et al. 2009). Due to the relatively high observer coverage and the long observation period, we assumed that the list of species that interacted with these fisheries as recorded by each observer program is a representative sample. The PSA was conducted mainly following Kirby’s (2006)
180
approach, which identifies species most at risk among those caught by each of the fleets. The productivity index was defined according to Kirby (2006):
P1= (RS)/3+(Lmat /Lmax)
185
Where RS is the reproductive strategy of a given specie, Lmat is its length at maturity, and Lmax is the maximum length. RS was scored as follows:
1.- Broadcast spawners-> external fertilization: Fish which release their gametes into the water, where fertilization may occur; without parental care.
2.- Egg layers-> internal fertilization: species that lay eggs (oviparity); species where
190
the pups are protected by egg cases.
3.- Live bearers-> internal fertilization: ovoviviparity and viviparity; species where pups are born alive.
As a sensitivity test, a simpler alternative productivity index was defined as:
195
P2=Lmat / Lmax
High P1 and P2 values indicate high risk due to low productivity (broadcast spawners
are considered to be more productive than egg layers and live bearers, and a low length
200
at maturity to maximum length ratio indicates a higher chance of being able to reproduce as it is more likely to reach sexual maturity prior to capture). The susceptibility index was defined as:
S1= (Lcatch / Lmax + Pdead)/2
Where Lcatch is the average length of the catch for each species, according to the observer datasets, computed as the arithmetic mean of observed lengths over all fishing operations sampled, and Pdead is the proportion of dead animals after interacting with the fishing gear. Note that, according to Kirby (2006), the first term of the equation is
210
proportional to susceptibility assuming that natural mortality is higher at smaller sizes and, thus, fishing mortality is a smaller component of total mortality than for larger sizes (as suggested by Fonteneau and Pallares, 2005). However, this term might also appear counter intuitive since the larger the size at capture is, the higher the chance for spawning. Thus, as a sensitivity test, a simpler alternative susceptibility index was
215
defined as:
S2= Pdead
In the case of tropical purse seiners, Pdead was calculated assuming that the categories
220
“escaped from net (for cetaceans and whale shark)”, “taken out of the net (for cetaceans and whale shark)” and “discarded alive” had no associated mortality. This assumption may well have resulted in an under-estimation of the proportion of dead animals. In the case of longliners, it was assumed that all finned sharks died. The categories “lost at surface” and “released” were not considered to estimate the percentage of dead animals
225
since they do not provide information about the fate of the animals.
The productivity and susceptibility indices as well as alternative P and S indices were scaled to the maximum value of the series. The risk scores R1 and R2 for each species
were calculated as the euclidean distance between the origin and their position in a bidimensional Productivity Susceptibility space,
230 2 1 2 1 1 P S R = + 2 2 2 2 2 P S R = +
Alternative productivity, susceptibility and risk scores were compared using Pearson
235
correlation tests. For each of the fisheries (European Purse Seine and US Longline), the risk scores were ranked in order to highlight the species and species groups most at risk of being negatively impacted by the fisheries.
The susceptibility indices considered so far are independent of the number of
individuals caught. Therefore, a species could score high even if a single individual was
240
caught and died during the entire observed period. To overcome this situation, alternative risk scores could be developed by multiplying S1 (or S2) by the numbers
caught by the fishery. However, the amounts of different species caught by a fishery not only depend on the species selectivity of the fishing gear, but also on the relative
abundances of the species themselves (i.e. catching several tuna might have a smaller
245
impact than catching one shark). Thus, we suggest that a better approach would be to multiply S1 (or S2) by the catch to abundance ratio of each species. To illustrate this, we
compared alternative risk scores (Rc and Rc/a) that incorporate catch and catch to
abundance ratio information on S1, respectively, as described above, for those species
caught by the EU Purse Seine fishery for which recent abundance estimates were
250
available from ICCAT (2009).
Results
An “occurrence” was defined as a species reported to have interacted at least once with
255
a fishing gear (i.e. it is included in the ICCAT bycatch list). The analysis of the ICCAT bycatch list revealed that most occurrences occurred in longline fisheries, followed by gillnets, purse seines, other fisheries, harpoons, traps and baitboats (Fig. 1a).
Information on species specific intrinsic vulnerability was not available for some coastal sharks (2%), marine mammals (4%), seabirds (41%), skates and rays (8%) and other
260
teleosts (15%). Based on the available information, the average intrinsic vulnerabilities for the species groups caught in ICCAT fisheries are given in Fig. 2a. Marine mammals and coastal sharks are the species groups which show the highest average intrinsic vulnerabilities, although their confidence intervals overlap with those of pelagic sharks, sea turtles and skates and rays. On the other hand, seabirds (for which there were no
265
scores in 15 out of 37 species) show lowest average intrinsic vulnerability, their confidence interval overlapping with that for Scombridae and billfish, as well as sea turtles. Intrinsic vulnerability reflects vulnerability based on biological characteristics. Highest intrinsic vulnerabilities are expected for species with longer life spans, later sexual maturation, slower growth and lower natural mortalities (Morato et al. 2006).
270
However, total vulnerability might significantly differ from intrinsic vulnerability, as it is also affected by the environment and fishing. Seabirds, for example, are highly
vulnerable to longline fishing given their tendency to be hooked on longlines operating in certain regions of the Atlantic.
Harpoon and trap gears, in spite of their low contribution to total catch of tuna and tuna
275
like species, showed the highest average intrinsic vulnerability of the species interacting with each gear (Fig. 2b). The average intrinsic vulnerability of species interacting with gillnets is similar to that of longliners and purse seiners.
Most species (including most teleosts) are not evaluated by the IUCN (Fig. 3a). Most ICCAT species (Scombridae and billfish) are either not evaluated (19) or categorized as
280
data deficient (3), with only one species in each of the “low concern” and “vulnerable” categories. According to the IUCN red list, 7 species are critically endangered: 3 coastal sharks (Squatina aculeata, Squatina oculata and Squatina squatina), 3 turtles
(Dermochelys coriacea, Eretmochelys imbricata and Lepidochelys kempii) and one seabird (Puffinus mauritanicus). Moreover,16 species are endangered (9 seabirds, 2
285
marine mammals, 2 turtles, 1 teleost, 1 coastal shark and 1 ray).
Among the species evaluated as CR by the IUCN, 45% of the interactions occurred in longline, 27% in purse seine, 18% in gillnets and 9% in harpoons (Fig. 3b). Traps, baitboats and others do not catch species evaluated as CR. Considering vulnerable (VU), endangered (EN) and CR species, 45% of occurrences occur in longline, 19% in
290
gillnets, 15% in purse seine, 10% in harpoon fisheries, 7% in other fisheries, 2% in traps and 1% in baitboats.
Productivity Susceptibility Analysis:
295
According to the ICCAT bycatch list, the purse seine gear interacted with 75 different species. Observers on the EU tropical tuna purse seine fleet have recorded catch for 52 different species (including target and bycatch species). Thirty one of these species were assigned productivity and susceptibility scores. The information needed to estimate P and S was not available for the rest of the species. The species that were included in the
300
PSA analysis included 3 coastal sharks, 12 Scombridae and billfish, 3 pelagic sharks, 2 skates and rays, 4 sea turtles and 7 other non-ICCAT teleosts. Only 2 individual marine mammals have been observed to interact with tropical tuna purse seiners during the observer program, neither of which died and their lengths were not recorded. Hence, it was not possible to compute a susceptibility score for any of the marine mammals and
305
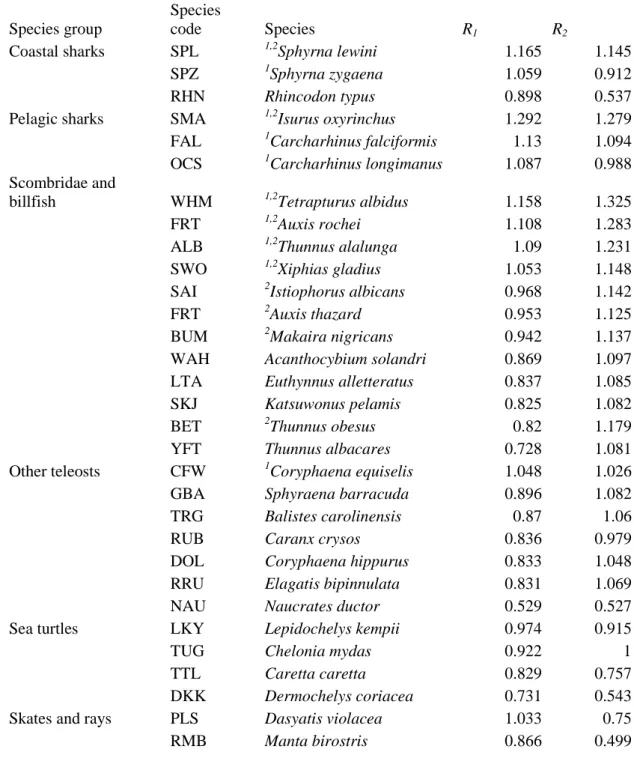
The results of the PSA analysis for European purse seiners identified two main risk groups according to the R1 score (Fig. 4). The first group is comprised of pelagic and
coastal sharks characterized by relatively low productivities. The second group comprised teleosts including both ICCAT (Scombridae and billfish) and non-ICCAT
310
species characterized by higher productivities, but also higher susceptibility to purse seine gear. The 10 species with highest risk scores included 3 pelagic sharks, 2 coastal sharks, 4 Scombridae and billfish and 1 other teleost according to the R1 score and 8
Scombridae and billfish, 1 pelagic shark and 1 coastal shark according to the R2 score
(Table 1).
315
According to the ICCAT bycatch list, 164 different species interacted with pelagic longline gear. Observers on the US pelagic longline fleet recorded catch of 82 different species (including target and bycatch species). Fifty four of these species were assigned productivity and susceptibility scores. The information needed to estimate P and S was not available for the rest of the species. The species that were included in the PSA
320
analysis were 17 coastal sharks, 13 Scombridae and billfish, 11 other teleosts, 9 pelagic sharks and 4 sea turtles.
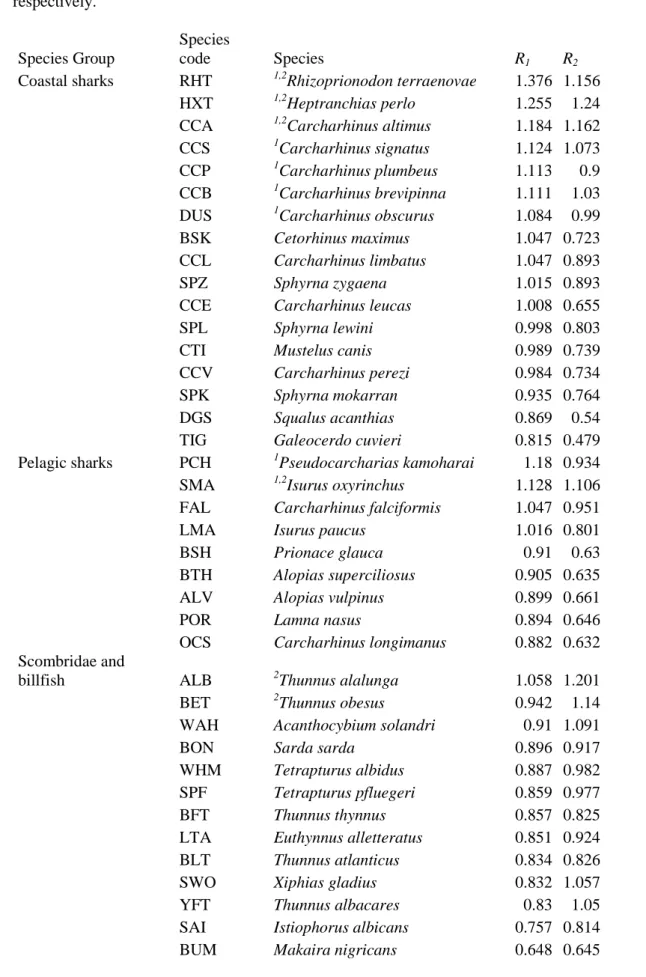
The PSA analysis for the US pelagic longline fishery revealed that some coastal sharks are, according to the R1 score, at the top of the risk rank with both low productivities
and relatively high susceptibility to the fishing gear (Table 2 and Fig. 5). A mixed group
325
of pelagic and coastal sharks also share low productivity values, but slightly lower susceptibility to capture. Some teleosts (both ICCAT and other species) also showed high risk scores, mainly because of their high susceptibility to the fishing gear even though their productivity was relatively high. Among the teleosts, several non-ICCAT species (Sciaenops ocellatus, Scomber scombrus and Scomber japonicus) showed
330
higher risk values than ICCAT species (e.g. albacore tuna). Among the 10 species with the highest risk scores were 7 coastal sharks, 2 pelagic sharks and 1 non-ICCAT teleost according to the R1 score and 3 coastal sharks, 4 non-ICCAT teleosts, 2 ICCAT species
and 1 pelagic shark according to the R2 score (Table 2).
For both the European purse seine and the US pelagic longline fisheries, the evaluated
335
sea turtles were not highly ranked in terms of R1 or R2. Although considered to be
animals with relatively low productivity, their susceptibility scores were low for these fisheries, mainly due to the fact that most are released alive. Other sensitive species groups (like marine mammals or seabirds) were not included in the analysis essentially
because the data showed that these two particular fisheries rarely interact with them
340
(e.g. purse seine observer data contains no interaction with seabirds). The alternative productivity scores (P1 and P2) showed positive correlations
(R2=0.6577; p=8.013e-12) as did the alternative susceptibility scores (S1 and S2,
R2=0.9045; p=2.2e-16) and the alternative risk scores (R1 and R2, R2=0.5376,
p=1.122e-07).
345
When including catch information on the risk score (Rc), target species (Katsuwonus
pelamis and Thunnus albacares) were upgraded in the risk rank (Table 3). However,
when including the catch to abundance ratio in the risk estimate (Rc/a), these two species
had the lowest scores, while bycatch species (Tetrapturus albidus, Makaira nigricans
and Istiophorus albicans) had the highest scores. 350
Discussion
In the paper we follow a two stage approach. The descriptive analysis of the ICCAT
355
bycatch list is more inclusive than the PSA as it considers all species that were reported to interact with ICCAT fisheries. The subsequent PSA analysis we performed is more quantitative in nature, but it was restricted only to those species for which data collected by scientific observer programs and life history parameters were available. This kind of analysis that includes all species, followed by semi-quantitative PSA analysis is to some
360
extent comparable to the multilevel ERA framework (Hobday et al. 2011)
recommended by Dulvy et al. (2004) and Astles et al. (2006) as a way to triage or rapidly assess large numbers of species. However, it is not hierarchical in the sense that the first analysis does not restrict the scope of the second analysis. However, the first analysis is important as it stresses the relevance of the second analysis and it helps to
365
identify future needs.
For both the ICCAT bycatch list and the observer datasets, we assumed that a reasonably high proportion of the species interacting with the respective gears and fisheries was included in these datasets. However, in the case of the ICCAT bycatch list, there is no information about the fraction of species that might have been non-reported,
370
and the real number of species interacting with Atlantic tuna fisheries might be higher than the already high number (242 species) registered in the database. Similarly, in spite of the relatively long observed period and the high observer coverage for the US pelagic
longline fishery and the EU tropical tuna purse seine fishery observer programs, the number of species recorded in the respective databases is likely to increase in the future
375
as more fishing operations are observed. Thus, it must be stressed that the results of updated analyses might change as new species are identified as interacting with these fisheries.
The analysis of the ICCAT bycatch list showed that longline, gillnet and purse seine gears interact with the highest number of bycatch species which generally have
380
relatively high intrinsic vulnerabilities. However, the number of species caught by each gear is only a coarse measure of potential impact since the risk itself is not evaluated. The species in the ICCAT bycatch list are not necessarily species at risk, or species at similar levels of risk. In fact, the presence of a species in the bycatch list does not imply that it is caught in significant quantities relative to its population size, or that the
385
individuals that are caught necessarily died due to the interaction. For instance, although gillnets catch a lower number of species than longlines, they catch more marine
mammals. On the other hand, almost all seabird interactions are reported to occur in longline fisheries (Fig. 1b). However, it should be taken into consideration that different longline types operate in different areas and at different depths, time of day, etc.,
390
potentially affecting and interacting with different species of different resilience. In fact, the interaction of a certain gear with a certain species might differ from one region to another, due to differences in environmental conditions.
The average intrinsic vulnerability of species interacting with a fishing gear depends on the relative proportion of species with differing vulnerabilities. It is clear that catches by
395
harpoon and trap gears are minor when compared to other gears like longline, purse seine or baitboat. For that reason, the average vulnerability by gear should ideally be weighted by the relative magnitude of gear specific catches or mortalities (not estimated here). This may well provide a different picture to when vulnerability is considered in isolation and may be a more meaningful method for assessing the impact of a particular
400
gear type. This is of course dependant on the availability and/or quality of catch data available for the bycatch species.
Given that purse seine and longline gears interact with a relatively high number of species and that the total tuna and tuna like species catch of both these gears is high in comparison to other gears, the selection of a purse seine and a longline fishery for the
405
PSA seemed adequate for the purpose of this analysis. Moreover, both the EU purse seine and the US longline fisheries have relatively good observer coverage (Diaz et al.
2009; Amande et al. 2010). However, the list of bycatch species that interacted with these two fisheries might not be representative of all the longline and purse seine
fisheries operating throughout the Atlantic. This suggests the need to conduct additional
410
PSA analyses on other purse seine and longline fleets operating in different areas, at different times and with different targets, as they might interact with bycatch species at different levels of risk. In addition, it would also be of interest to analyze observer data on gillnet fisheries which are also reported to interact with many bycatch species, including a high proportion of marine mammals (which showed highest intrinsic
415
vulnerability indices), and other critically endangered and vulnerable species. Extending the PSA analyses to gillnet fisheries would allow the development of a more global picture of fishing effects on the ecosystem and to better focus research and management efforts.
The PSA for the two fleets considered in this analysis showed several similarities.
420
Overall, two high risk groups were identified that deserve enhanced scientific
monitoring and management action in the near future, namely coastal and pelagic sharks characterized by low productivity and relatively high susceptibility to capture, and teleosts (both ICCAT and non-ICCAT species) with higher productivity but also higher susceptibility to capture. However, the PSA was conducted on a subset of species that
425
are caught by these two fleets for which enough information was available to produce productivity and susceptibility scores. Thus, it should be noted that the results may change in the future as new information for other species becomes available. Most of the “top 10” species identified by the R1 score as being most negatively
impacted by purse seine and longline fisheries were also identified by R2, because
430
strong positive correlations where obtained between both scores over the entire dataset mainly due to the high correlation between the alternative susceptibility scores. The correlation between alternative productivity scores is lower because they differ by an offset (i.e. the reproductive strategy) that, in the case of P1, separates species into groups
according to their different reproductive strategies. There is no point in using P1 to score
435
relative productivities of species with the same reproductive strategy, but the use of P1
may be preferred when species with different reproductive strategies are being scored (as in the present analysis). However, the precise values for the alternative reproductive strategies should be discussed between experts in the different species groups, as well as the relative weight between reproductive strategy and the length at maturity to
440
In fact, it should be taken into consideration that the risk ranking is likely to change under different definitions of risk. Different authors have adopted alternative definitions of productivity and or susceptibility, depending on the species characteristics and data availability. For instance, the scoring procedure for the same variable differs between
445
authors (e.g. Stelzenmüller et al. 2010 considered 4 levels of Reproductive Strategy for their analysis, while only 3 levels were considered in our study). Moreover, the
variables considered by Furness and Tasker (2000) to score seabird sensitivity to fishing (e.g. potential foraging range, ability to dive, ability to switch diet, cost of foraging, etc.) significantly differed from those used by Stelzenmüller et al. (2010) for their
450
spatially explicit risk assessment for fish (e.g. importance for fisheries, habitat vulnerability and affinity to seabed). This raises the debate as to which are the most appropriate variables to use (and how to score them) when species of very different nature are simultaneously analyzed (e.g. seabirds, turtles, marine mammals and fish). Such analyses are of great importance to better focus research and management efforts.
455
Scientists may, however, have difficulties in agreeing on the appropriate way to conduct this type of PSA. Interestingly enough, and according to our analysis, sea turtles do not appear to be at high risk even though the IUCN (that considers interactions with a wider range of stressors) lists 2 of the 5 sea turtle species as endangered, and the other 3 as critically endangered. The reason of this apparent discrepancy is that, although some sea
460
turtle species have a relatively high interaction rate with longline gear, fishing practices by the US pelagic longline fleet (e.g. mandatory use of circle hooks and de-hooking devices for sea turtles) resulted in a high proportion of sea turtles being released alive. In general, although the PSA has proved to be a useful methodology to simultaneously compare large numbers of species and identify those most at risk, further
465
methodological development is needed to address analyses that include species groups of a significantly different nature (Hope 2006). Alternative risk scores could be
developed that take into consideration the amount of catch for each of the species. This
Rc would accentuate species most frequently caught by the fishery (usually the target
species), and would avoid cases such as that for shortfin mako that appeared at the top
470
of the R1 risk rank for the EU purse seine fishery even though only one individual was
captured during the entire observer program (which suggests that the total vulnerability of this species to the purse seine gear may not be high). In this sense, the catch to abundance ratio might better reflect susceptibility than catch itself. In fact, using Rc
target species became most at risk while Rc/a ranked species more in accordance with
their respective population status. The disadvantage of using Rc/a is that the number of
species or populations included in the analysis is reduced substantially since more information is demanded. In fact, this is largely a circular argument as, according to Hobday et al. (2011), stock assessments from which abundance data for this kind of PSA analysis can be obtained correspond to fully quantitative analyses that are
480
conducted to assess the risk to those species that have been prioritized in earlier PSA analyses and for which enough data were available. For that reason, it makes sense to use R1 in the PSA analysis covering as many species as possible to prioritize those most
at risk, and then to conduct fully quantitative risk assessments on those species. Our analysis produced relative risk scores for species belonging to different species groups.
485
These scores (or those produced using the alternatives discussed above) allowed the identification of species most at risk and for which more quantitative risk assessments can be pursued (e.g. following Zhou and Griffiths 2008; Zhou et al. 2009). Spatially explicit risk assessments (e.g. Stelzenmüller et al. 2010) might also be conducted for species with known spatial distributions facilitating the identification of potential
490
marine protected areas. In cases where not enough information is available to conduct such quantitative assessments, specific data collection and research programs can be designed.
In the mean time, the hierarchical approach is particularly useful for assessment of numerous Atlantic bycatch species in data-limited fisheries. In spite of the arguments
495
against using a common risk metric for fish, birds, turtles and mammals, the steps involved and the decision criteria used to determine risk levels are transparent and logical and can be applied to a wide range of different fisheries, allowing stakeholders to be involved in the process. This approach allows for a management response at any level, optimizing research and management efforts by identifying and excluding
low-500
risk species from data intensive assessments (Braccini et al. 2006). In essence,
hierarchical ecological risk assessments are useful tools for the ecosystem approach to fishery management in the Atlantic Ocean.
Acknowledgements 505
We thank three anonymous referees for their valuable comments. This work was partially supported by the Basque Government grant ATM2010Templados to AZTI Tecnalia. This paper is contribution number XXX from AZTI-Tecnalia (Marine Research).
References 510
- Amande J.M., Ariz J., Chassot E., Chavance P., Delgado de Molina A., Gaertner D., Murua H., Pianet R., Ruiz J., (in press), By-catch and discards of the European purse seine tuna fishery in the Atlantic ocean. Estimation and characteristics for the 2003-2007 period. Collect. Vol. Sci. Pap. ICCAT.
- Astles K.L., 2008, A systematic approach to estimating ecological risks in marine fisheries. 515
CABI Reviews: Perspectives in Agriculture, Veterinary Science, Nutrition and Natural Resources 3, 16.
- Astles K.L., Holloway M.G., Steffe A., Green M., Ganassin C., Gibbs P.J., 2006, An ecological method for qualitative risk assessment and its use in the management of fisheries in New South Wales, Australia. Fish. Res. 82, 290–303.
520
- Braccini J.M., Gillanders B.M., Walker T.I., 2006, Hierarchical approach to the assessment of fishing effects on non-target chondrichthyans: Case study of Squalus megalops in
southeastern Australia. Can. J. Fish. Aq. Sci. 63, 2456-2466.
- Cheung W., Pitcher T., Pauly D., 2005, A fuzzy logic expert system to estimate intrinsic extinction vulnerability of marine fishes to fishing. Biol. Conserv. 124, 97–111. 525
- Cheung W.W.L., Watson R., Morato T., Pitcher T.J., Pauly D., 2007, Intrinsic vulnerability in the global fish catch. Mar. Ecol. Prog. Ser. 331, 1-12.
- Compagno L.J.V., 2001, Sharks of the world. An annotated and illustrated catalogue of shark species known to date. Volume 2. Bullhead, mackerel and carpet sharks
(Heterodontiformes, Lamniformes and Orectolobiformes). FAO Species Catalogue for 530
Fishery Purposes. No. 1, Vol. 2. Rome, FAO. 269p. [
- Cortés E., Arocha F., Beerkircher L., Carvalho F., Domingo A., Heupel M., Holtzhausen H., Santos M.N., Ribera M., Simpfendorfer C., 2009, Ecological risk assessment of pelagic sharks caught in Atlantic pelagic longline fisheries. Aq. Liv. Res. In press.
- Diaz G.A., Beerkircher L.R., Restrepo V.R., 2009, Description of the U.S. Pelagic Observer 535
Program (POP). Collect. Vol. Sci. Pap. ICCAT 64, 2415-2426.
- Dulvy N.K., Ellis J.R., Goodwin N.B., Grant A., Reynolds J.D., Jennings S., 2004, Methods of assessing extinction risk in marine fishes. Fish Fish. 5, 255-276.
- Fletcher W.J., 2005, The application of qualitative risk assessment methodology to prioritize issues for fisheries management. ICES J. Mar. Sci. 62, 1576-1587.
540
- Fletcher W.J., Chesson J., Sainsbury K.J., Hundloe T.J., Fisher M., 2005, A flexible and practical framework for reporting on ecologically sustainable development for wild capture fisheries. Fish. Res. 71, 175-183.
- Fonteneau A., Pallarés, P. 2005, Tuna natural mortality as a function of their age: the bigeye tuna (Thunnus obesus) case. Collect. Vol. Sci. Pap. ICCAT 57, 127-141.
- Francis R.I.C.C., Shotten R., 1997, “Risk” in fisheries management: a review. Can. J. Fish. Aquat. Sci. 54, 1699-1715.
- Froese R., Pauly D, Editors, 2010, FishBase. World Wide Web electronic publication. www.fishbase.org, version (03/2010).
- Furness R.W., Tasker M.L., 2000, Seabird-fishery interactions: Quantifying the sensitivity of 550
seabirds to reductions in sandeel abundance, and identification of key areas for sensitive seabirds in the North Sea. Mar. Ecol. Prog. Ser. 202, 253-264.
- Goldsworthy S.D., Page B., 2007, A risk-assessment approach to evaluating the significance of seal bycatch in two Australian fisheries. Biol. Conserv. 139, 269–285.
- Griffiths S.P., C D.T.B., Heales D.S., Milton D.A., Stobutzki I.C., 2006, Validating ecological 555
risk assessments for fisheries: assessing the impacts of turtle excluder devices on elasmobranch bycatch populations in anAustralian trawl fishery. Mar. Fresh. Res. 57, 395–401.
- Hobday A.J., Smith A.D.M., Stobutzki I.C., Bulman C., Daley R., Dambacher J.M., Deng R.A., Dowdney J., Fuller M., Furlani D., Griffiths S.P., Johnson D., Kenyon R., Knuckey 560
I.A., Ling S.D., Pitcher R., Sainsbury K.J., Sporcic M., Smith T., Turnbull C., Walker T.I., Wayte S.E., Webb H., Williams A., Wise B.S., Zhou S., 2011, Ecological Risk Assessment for the effects of fishing. Fish and Fisheries, in press.
- Hollowed A.B., Bax N., Beamish R., Collie J., Fogarty M., Livingston P., Pope J.G., Rice.J.C., 2000, Are multispecies models an improvement on single-species modelsfor 565
measuring fishing impacts on marine ecosystems? ICES J. Mar. Sci. 57, 707-719. - Hope B.K., 2006, An examination of ecological risk assessment and management practices.
Env. Int. 32, 983-995.
- ICCAT, 2008, Report of the 2007 meeting of the Sub-Committee on Ecosystems. Collect. Vol. Sci. Pap. ICCAT 62, 1671-1720.
570
- ICCAT, 2009. Report of the Standing Committee on Research and Statistics (Madrid, October 2009), 273 pp.
- ICCAT, 2010, ICCAT Manual. Chapter 2, Description of species. First edition (January 2010), 325 pp.
- IUCN 2010. IUCN Red List of Threatened Species. <www.iucnredlist.org>. Downloaded on 575
15 June 2009.
- Jefferson T.A., Leatherwood S. and Webber M.A., 1994, FAO species identification guide. Marine mammals of the world. Rome, FAO. 1993. 320 p.
- Kirby D.S., 2006, Ecological risk assessment for species caught in WCPO tuna fisheries: inherent risk as determined by productivity-susceptibility analysis WCPFC-SC2-2006/EB 580
- Márquez M.R., 1990, FAO species catalogue. Vol.11: Sea turtles of the world. An annotated and illustrated catalogue of sea turtle species known to date. FAO Fisheries Synopsis No. 125, Vol. 11. Rome, FAO. 81 p.
- Morato T., Cheung W.W.L., Pitcher T.J., 2006, Vulnerability of seamount fish to fishing: 585
fuzzy analysis of life-history attributes. J. Fish Biol. 67, 1-13.
- Murawski S.A., 2000, Definitions of overfishing from an ecosystem perspective. ICES J. Mar. Sci. 57, 649–658.
- Murua H., Arrizabalaga H., Huang J.J.H.-W., Romanov E., Bach P., Bruyn P.d., Chavance P., Molina A.D.d., Pianed R., Ariz J., Ruiz J., 2009, Ecological Risk Assessment (ERA) for 590
species caught in fisheries managed by the Indian Ocean Tuna Commission (IOTC): a first attempt. IOTC-2009-WP-20, 9 pp.
- Palomares M.L.D., Pauly D., Editors, 2010, SeaLifeBase. World Wide Web electronic publication. www.sealifebase.org, version (03/2010).
- Patrick W.S., Spencer P., Link J., Cope J., Field J., Kobayashi D., Lawson P., Gedamke T., 595
Cortés E., Ormseth O., Bigelow K., Overholtz W., 2010, Using productivity and susceptibility indices to assess the vulnerability of United States fish stocks to overfishing. Fish Bull. 108, 305–322.
- Scandol J.P., Ives M.C., Lockett M., 2009, Development of national guidelines to improve the application of risk-based methods in the scope, implementation and interpretation of stock 600
assessments for data-poor species (Final Draft). FRDC Project No. 2007/016, NSW Department of Primary Industries 182 pp.
- Smith A.D.M., Fulton E.J., Hobday A.J., Smith D.C., Shoulder P., 2007, Scientific tools to support the practical implementation of ecosystem-based fisheries management. ICES J. Mar. Sci. 64, 633–639.
605
- Stelzenmüller V., Ellisa J.R., Rogers S.I., 2010, Towards a spatially explicit risk assessment for marine management: Assessing the vulnerability of fish to aggregate extraction. Biol. Conserv. 143, 230-238.
- Stobutzki I.C., Miller M.J., Brewer D.T., 2001a, Sustainability of fishery bycatch: a process for assessing highly diverse and numerous bycatch. Env. Conserv. 28, 167-181.
610
- Stobutzki I.C., Miller M.J., Heales D.S., Brewer D.T., 2001b, Sustainability of elasmobranchs caught as bycatch in a tropical prawn (shrimp) trawl fishery. Fish. Bull. 100, 800-821. - Zhou S., Griffiths S.P., 2008, Sustainability Assessment for Fishing Effects (SAFE): A new
quantitative ecological risk assessment method and its application to elasmobranch bycatch in an Australian trawl fishery. Fish. Res. 91, 56-68.
615
- Zhou S., Griffiths S.P., Miller M., 2009, Sustainability assessment for fishing effects (SAFE) on highly diverse and data-limited fish bycatch in a tropical prawn trawl fishery. Mar. Fresh. Res. 60, 563–570.
Figure legends: 620
Figure 1. Summary plots of the ICCAT bycatch list. a) Number of species reported to have interacted with each fishing gear, by species group. b) Number of species reported to have interacted with each species group, by fishing gear. An
occurrence is defined as a species reported to have interacted at least once with a given fishing gear. The presence of a species in the list does not imply that it is
625
caught in significant quantities, or that individuals that are caught necessarily died as a result of the interaction.
Figure 2. Average instrinsic vulnerability (sensu Cheung et al. 2005; Cheung et al. 2007) by a) species groups and b) main fishing gears. The line in b) represents average yearly catch by gear since 1990. Vertical bars indicate one standard error.
630
Figure 3. a) Number of species under the alternative IUCN red list status categories. b) Percentage of species caught by fishing gear under the alternative IUCN red list status categories.
Figure 4. Results of the productivity susceptibility analysis for species caught by EU tropical tuna purse seiners. Elliptical 80% confidence intervals are provided for
635
each species group. See table 1 for correspondence between species codes and species names.
Figure 5. Results of the productivity susceptibility analysis for species caught by US longliners. Elliptical 80% confidence intervals are provided for each species group. See table 2 for correspondence between species codes and species names.
Table 1. Productivity Susceptibility Analysis for the European purse seine fishery: alternative risk scores (R1 and R2) obtained in the Productivity Susceptibility analysis for the European purse seine fishery. The table is ordered in descending order according to R1 within each specie 645
group. The species ranked among the top ten according to R1 and R2 are marked with 1 and 2 superscripts, respectively.
Species group
Species
code Species R1 R2
Coastal sharks SPL 1,2Sphyrna lewini 1.165 1.145
SPZ 1Sphyrna zygaena 1.059 0.912
RHN Rhincodon typus 0.898 0.537
Pelagic sharks SMA 1,2Isurus oxyrinchus 1.292 1.279
FAL 1Carcharhinus falciformis 1.13 1.094
OCS 1Carcharhinus longimanus 1.087 0.988
Scombridae and
billfish WHM 1,2Tetrapturus albidus 1.158 1.325
FRT 1,2Auxis rochei 1.108 1.283
ALB 1,2Thunnus alalunga 1.09 1.231
SWO 1,2Xiphias gladius 1.053 1.148
SAI 2Istiophorus albicans 0.968 1.142
FRT 2Auxis thazard 0.953 1.125
BUM 2Makaira nigricans 0.942 1.137
WAH Acanthocybium solandri 0.869 1.097
LTA Euthynnus alletteratus 0.837 1.085
SKJ Katsuwonus pelamis 0.825 1.082
BET 2Thunnus obesus 0.82 1.179
YFT Thunnus albacares 0.728 1.081
Other teleosts CFW 1Coryphaena equiselis 1.048 1.026
GBA Sphyraena barracuda 0.896 1.082
TRG Balistes carolinensis 0.87 1.06
RUB Caranx crysos 0.836 0.979
DOL Coryphaena hippurus 0.833 1.048
RRU Elagatis bipinnulata 0.831 1.069
NAU Naucrates ductor 0.529 0.527
Sea turtles LKY Lepidochelys kempii 0.974 0.915
TUG Chelonia mydas 0.922 1
TTL Caretta caretta 0.829 0.757
DKK Dermochelys coriacea 0.731 0.543
Skates and rays PLS Dasyatis violacea 1.033 0.75
Table 2. Productivity Susceptibility Analysis for the US pelagic longline fishery: risk scores (R1 650
and R2) obtained in the Productivity Susceptibility analysis for the US pelagic longline fishery. The table is ordered in descending order according to R1 within each specie group. The species ranked among the top ten according to R1 and R2 are marked with 1 and 2 superscripts,
respectively. 655
Species Group
Species
code Species R1 R2
Coastal sharks RHT 1,2Rhizoprionodon terraenovae 1.376 1.156
HXT 1,2Heptranchias perlo 1.255 1.24
CCA 1,2Carcharhinus altimus 1.184 1.162
CCS 1Carcharhinus signatus 1.124 1.073
CCP 1Carcharhinus plumbeus 1.113 0.9
CCB 1Carcharhinus brevipinna 1.111 1.03
DUS 1Carcharhinus obscurus 1.084 0.99
BSK Cetorhinus maximus 1.047 0.723
CCL Carcharhinus limbatus 1.047 0.893
SPZ Sphyrna zygaena 1.015 0.893
CCE Carcharhinus leucas 1.008 0.655
SPL Sphyrna lewini 0.998 0.803
CTI Mustelus canis 0.989 0.739
CCV Carcharhinus perezi 0.984 0.734
SPK Sphyrna mokarran 0.935 0.764
DGS Squalus acanthias 0.869 0.54
TIG Galeocerdo cuvieri 0.815 0.479
Pelagic sharks PCH 1Pseudocarcharias kamoharai 1.18 0.934
SMA 1,2Isurus oxyrinchus 1.128 1.106
FAL Carcharhinus falciformis 1.047 0.951
LMA Isurus paucus 1.016 0.801
BSH Prionace glauca 0.91 0.63
BTH Alopias superciliosus 0.905 0.635
ALV Alopias vulpinus 0.899 0.661
POR Lamna nasus 0.894 0.646
OCS Carcharhinus longimanus 0.882 0.632
Scombridae and
billfish ALB 2Thunnus alalunga 1.058 1.201
BET 2Thunnus obesus 0.942 1.14
WAH Acanthocybium solandri 0.91 1.091
BON Sarda sarda 0.896 0.917
WHM Tetrapturus albidus 0.887 0.982
SPF Tetrapturus pfluegeri 0.859 0.977
BFT Thunnus thynnus 0.857 0.825
LTA Euthynnus alletteratus 0.851 0.924
BLT Thunnus atlanticus 0.834 0.826
SWO Xiphias gladius 0.832 1.057
YFT Thunnus albacares 0.83 1.05
SAI Istiophorus albicans 0.757 0.814
Other teleosts MAS 1,2Scomber japonicus 1.131 1.221
MAC 2Scomber scombrus 1.063 1.11
RDM 2Sciaenops ocellatus 1.053 1.126
GES Gempylus serpens 1.024 0.992
ANG Lophius americanus 0.961 1.081
NAU Naucrates doctor 0.908 1.08
RRU 2Elagatis bipinnulata 0.874 1.094
LAG Lampris guttatus 0.845 0.942
BLU Pomatomus saltatrix 0.81 0.885
CBA Rachycentron canadum 0.806 0.879
CVJ Caranx hippos 0.507 0.55
Sea turtles TUG Chelonia mydas 0.99 1.009
LKY Lepidochelys kempii 0.879 0.915
TTL Caretta caretta 0.819 0.742
Table 3. Productivity Susceptibility Analysis for the European purse seine fishery: alternative risk scores (R1, Rc and Rc/a) obtained in the Productivity Susceptibility analysis for Scombridae and billfish caught by the European purse seine fishery for which enough data were available. In 660
Rc and Rc/a, the susceptibility score (S1) of each species is multiplied by the catch and by the catch to abundance ratio, respectively. The table is ordered in descending order according to R1. The species ranked among the top three according to Rc and Rc/a scores are marked with 1 and 2 superscripts, respectively.
665
Species code Species Rc Rc/a R1
WHM 1,2Tetrapturus albidus 1.00 1.00 1.16
ALB Thunnus alalunga 0.90 0.88 1.09
SWO Xiphias gladius 0.75 0.75 1.05
SAI 2Istiophorus albicans 0.75 1.25 0.97
BUM 2Makaira nigricans 0.78 1.04 0.94
SKJ 1Katsuwonus pelamis 1.18 0.64 0.83
BET Thunnus obesus 0.82 0.80 0.82
Arrizabalaga et al. Figure 1
a)
0 50 100 150
Other teleosts Scombridae and billfish Skates and rays Pelagic sharks Coastal sharks Seabirds Sea Turtles Marine mammals Number of ocurrences Longline Purse seine Gillnet Trap Baitboat Harpoon Others b) 0 50 100 150 Others Harpoon Baitboat Trap Gillnet Purse seine Longline Number of ocurrences Marine mammals Sea Turtles Seabirds Coastal sharks Pelagic sharks
Skates and rays
Scombridae and billfish
Other teleosts
Arrizabalaga et al. Figure 2 a) 0 20 40 60 80 100 Coastal sharks Marine mammals Pelagic sharks Seabirds Sea Turtles Skates and rays Other teleosts Scombridae and billfish
Average intrinsic vulnerability rate b) 40 50 60 70 80 90 100
Baitboat Gillnet Harpoon Longline Others Purse seine Trap A v e ra g e i n tr in s ic v u ln e ra b il it y r a te 0 50 100 150 200 250 300 C a tc h ( 1 0 0 0 t o n n e s )
Arrizabalaga et al. Figure 3 675 a) 0 20 40 60 80 100 Not evaluated Data deficient Least concern Near threatened Vulnerable Endangered Critically endangered Number of species Marine mammals Sea Turtles Seabirds Coastal sharks Pelagic sharks Skates and rays
Scombridae and billfish Other teleosts b) 0% 20% 40% 60% 80% 100% Not evaluated Data deficient Least concern Near threatened Vulnerable Endangered Critically endangered Percentage of species Longline Purse seine Gillnet Trap Baitboat Harpoon Others a) 0 20 40 60 80 100 Not evaluated Data deficient Least concern Near threatened Vulnerable Endangered Critically endangered Number of species Marine mammals Sea Turtles Seabirds Coastal sharks Pelagic sharks Skates and rays
Scombridae and billfish Other teleosts b) 0% 20% 40% 60% 80% 100% Not evaluated Data deficient Least concern Near threatened Vulnerable Endangered Critically endangered Percentage of species Longline Purse seine Gillnet Trap Baitboat Harpoon Others
Arrizabalaga et al. Figure 4 680 0.0 0.2 0.4 0.6 0.8 1.0 1.2 0 .0 0 .2 0 .4 0 .6 0 .8 1 .0 1 .2 Productivity (P1) S u s c e p ti b ili ty t o c a p tu re ( S 1 ) SAI BUM WHM SWO RRU WAH DOL RUB GBA TRG CFW NAU TUG TTL LKY DKK FAL RHN SPZ SPL OCS SMA RMB PLS FRT FRT LTA SKJ ALB YFT BET HIGH RISK LOW RISK Other teleosts Coastal sharks Scombridae and billfish Pelagic sharks Skates and rays Sea turtles
Arrizabalaga et al. Figure 5 0.0 0.2 0.4 0.6 0.8 1.0 1.2 0 .0 0 .2 0 .4 0 .6 0 .8 1 .0 1 .2 Productivity (P1) S u s c e p ti b ili ty t o c a p tu re ( S 1 ) Other teleosts Coastal sharks Scombridae and billfish Pelagic sharks Sea turtles WAH BTH ALV CVJ CCA CCB FAL CCECCL OCS DUS CCV CCP CCS TTL BSK TUG DKK RRU LTA TIG GES HXT
SAI LMA SMA
POR LAG LKY ANG BUM CTI NAU BLU BSH PCH CBA RHT BON RDM MAS MAC SPL SPK SPZ DGS WHM SPF ALB YFTBLT BET BFT SWO HIGH RISK LOW RISK 685