HAL Id: inserm-00663617
https://www.hal.inserm.fr/inserm-00663617
Submitted on 27 Jan 2012
HAL is a multi-disciplinary open access
archive for the deposit and dissemination of
sci-entific research documents, whether they are
pub-lished or not. The documents may come from
teaching and research institutions in France or
abroad, or from public or private research centers.
L’archive ouverte pluridisciplinaire HAL, est
destinée au dépôt et à la diffusion de documents
scientifiques de niveau recherche, publiés ou non,
émanant des établissements d’enseignement et de
recherche français ou étrangers, des laboratoires
publics ou privés.
storage myopathy revealed inflammation, glycogenesis
inhibition, hypoxia and mitochondrial dysfunctions.
Eric Barrey, Elodie Mucher, Nicolas Jeansoule, Thibaut Larcher, Lydie
Guigand, Bérénice Herszberg, Stéphane Chaffaux, Gérard Guérin, Xavier
Mata, Philippe Benech, et al.
To cite this version:
Eric Barrey, Elodie Mucher, Nicolas Jeansoule, Thibaut Larcher, Lydie Guigand, et al.. Gene
expres-sion profiling in equine polysaccharide storage myopathy revealed inflammation, glycogenesis
inhibi-tion, hypoxia and mitochondrial dysfunctions.. BMC Veterinary Research, BioMed Central, 2009, 5
(1), pp.29. �10.1186/1746-6148-5-29�. �inserm-00663617�
Open Access
Research article
Gene expression profiling in equine polysaccharide storage
myopathy revealed inflammation, glycogenesis inhibition, hypoxia
and mitochondrial dysfunctions
Eric Barrey*
†1,3, Elodie Mucher
†1, Nicolas Jeansoule
5, Thibaut Larcher
2,
Lydie Guigand
2, Bérénice Herszberg
3, Stéphane Chaffaux
3, Gérard Guérin
3,
Xavier Mata
3, Philippe Benech
4, Marielle Canale
4, Olivier Alibert
5,
Péguy Maltere
5and Xavier Gidrol
5Address: 1Unité de Biologie Intégrative des Adaptations à l'Exercice -INSERM 902, Genopole Evry, France, 2INRA, UMR 703, Ecole Nationale
Vétérinaire de Nantes, France, 3INRA, UMR1313 Génétique Animale et Biologie Intégrative, F-78350 Jouy-en-Josas, 4GenoSciencePharma, 2, rue
Mascaron, 13006 Marseille, France and 5CEA, Laboratoire d'Exploration Fonctionnelle des Génomes (LEFG), Genopole Evry, France
Email: Eric Barrey* - eric.barrey@inserm.fr; Elodie Mucher - elodie.mucher@yahoo.fr; Nicolas Jeansoule - nicolas.jeansoule@voila.fr; Thibaut Larcher - larcher@vet-nantes.fr; Lydie Guigand - guigand@vet-nantes.fr; Bérénice Herszberg - herszberg@ifrance.com;
Stéphane Chaffaux - stephane.chaffaux@jouy.inra.fr; Gérard Guérin - gerard.guerin@jouy.inra.fr; Xavier Mata - xavier.mata@jouy.inra.fr; Philippe Benech - philippe.benech@3dgenoscience.com; Marielle Canale - marielle.canale@wanadoo.fr; Olivier Alibert - olivier.alibert@cea.fr; Péguy Maltere - peggy.maltere@cea.fr; Xavier Gidrol - xavier.gidrol@cea.fr
* Corresponding author †Equal contributors
Abstract
Background: Several cases of myopathies have been observed in the horse Norman Cob breed. Muscle histology examinations revealed that some families suffer from a polysaccharide storage myopathy (PSSM). It is assumed that a gene expression signature related to PSSM should be observed at the transcriptional level because the glycogen storage disease could also be linked to other dysfunctions in gene regulation. Thus, the functional genomic approach could be conducted in order to provide new knowledge about the metabolic disorders related to PSSM. We propose exploring the PSSM muscle fiber metabolic disorders by measuring gene expression in relationship with the histological phenotype.
Results: Genotypying analysis of GYS1 mutation revealed 2 homozygous (AA) and 5 heterozygous (GA) PSSM horses. In the PSSM muscles, histological data revealed PAS positive amylase resistant abnormal polysaccharides, inflammation, necrosis, and lipomatosis and active regeneration of fibers. Ultrastructural evaluation revealed a decrease of mitochondrial number and structural disorders. Extensive accumulation of an abnormal polysaccharide displaced and partially replaced mitochondria and myofibrils. The severity of the disease was higher in the two homozygous PSSM horses.
Gene expression analysis revealed 129 genes significantly modulated (p < 0.05). The following genes were up-regulated over 2 fold: IL18, CTSS, LUM, CD44, FN1, GST01. The most down-regulated genes were the following: mitochondrial tRNA, SLC2A2, PRKCα, VEGFα. Data mining analysis showed that protein synthesis, apoptosis, cellular movement, growth and proliferation were the main cellular functions significantly associated with the modulated genes (p < 0.05). Several
up-Published: 7 August 2009
BMC Veterinary Research 2009, 5:29 doi:10.1186/1746-6148-5-29
Received: 11 December 2008 Accepted: 7 August 2009 This article is available from: http://www.biomedcentral.com/1746-6148/5/29
© 2009 Barrey et al; licensee BioMed Central Ltd.
This is an Open Access article distributed under the terms of the Creative Commons Attribution License (http://creativecommons.org/licenses/by/2.0), which permits unrestricted use, distribution, and reproduction in any medium, provided the original work is properly cited.
regulated genes, especially IL18, revealed a severe muscular inflammation in PSSM muscles. The up-regulation of glycogen synthase kinase-3 (GSK3β) under its active form could be responsible for glycogen synthase (GYS1) inhibition and hypoxia-inducible factor (HIF1α) destabilization.
Conclusion: The main disorders observed in PSSM muscles could be related to mitochondrial dysfunctions, glycogenesis inhibition and the chronic hypoxia of the PSSM muscles.
Background
Several cases of metabolic myopathies have been observed in the Norman Cob horse breed used to pull car-riages [1]. Muscle histology examinations revealed that one bloodline suffers from a glycogenosis described as polysaccharide storage myopathy (PSSM) in Quarter horses [2,3] and classified as non-exertional myopathies with rhadomyolysis in equine muscle disorders [4]. The disease has also been observed in Andalusian horses (Spanish purebred horses) [5], Belgian Draft Horses, Mor-gan, Arabian, Standardbred, ponies, Warm-blooded horses [6] and a mule [7]. The prevalence of PSSM among overtly healthy Quarter Horses in the United States is likely to be between 6% and 12% [8]. A PSSM phenotype has been characterized in a Norman Cob horse pedigree and in a population of stallions, by histological demon-stration in striated muscular fibers of an accumulation of some periodic acid Schiff (PAS)-positive amylase-resistant polysaccharides appearing ultrastructurally as glycogen-like particles [1,9]. Using this criteria, the affection preva-lence was 33% among a sample of French stallions. The prevalence of PSSM in Norman Cob stallions was closer to the 36% PSSM affected horses diagnosed in Belgian Draft Horses [10] than the 8% observed in draft horses in the United Kingdom [11]. The common clinical signs of PSSM in various breeds are abnormal hind limb gait, poor muscling, generalized muscle atrophy, poor performance, back soreness, exercise intolerance, spontaneous decum-bency with inability to rise, episodic "colic" and rhab-domyolysis [12].
In Humans, 11 types of glycogenosis (or glycogen storage diseases) have been described, each containing several sub-types [13]. The genes responsible for glycogen storage diseases in humans [13] or involved in the glycogen path-way were identified in the PubMed data basis and could be considered as candidates for equine PSSM: G6PC, SLC37A4, NPT4, GAA, AGL, GBE1, GBE2, PYGM, PYGL, PFKM, PHKA2, PHKB, PHKG2, PHKA1, PHKG1, GYS1, GYS2. However, in equine PSSM, the aetiology and phys-iopathology are not known. The excessive glycogen stor-age and formation of abnormal polysaccharide in PSSM horses therefore appears to reflect an increase in glycogen synthesis rather than a decrease in its utilisation [3]. Glu-cose tolerance tests showed that PSSM horses have enhanced cellular uptake of glucose and an increased sen-sitivity to insulin [14]. Neither glycogenolytic or glycolytic
enzyme deficiencies, nor abnormality in the phosphofruc-tokinase (PFKM) regulation, have been identified in affected horses [2,15]. The enhanced insulin sensitivity in PSSM horses is not due to an increase of the glucose trans-porter GLUT4 content or insulin receptor quantity [16]. Attempts to measure branching enzyme activities with methods developed for human muscle were unsuccessful [2]. Linkage studies did not demonstrate the relationships between PSSM and the candidate genes AMPK [17,18] or AGL [19]. A specific form of fatal glycogen storage disease was observed in a Quarter horse foal where a nonsense mutation in codon 34 of the glycogen branching enzyme (GBE1) was identified [20]. This metabolic myopathy can be compared to human glycogenosis type IV where several mutations and deletions explain the total or partial defi-ciency of the GBE1 gene. In adult horses, a new G-to-A mutation within the gene encoding glycogen synthase 1 (GYS1) has recently been observed in Quarter horses and some warm-blooded horses [21]. It is assumed that the metabolic disorders of PSSM muscles could be observed in detail at the transcription level because the gene(s) responsible for glycogen storage disease would also be linked to other dysfunctions and to some failure in gene regulatory networks. Thus, the functional genomics approach could be conducted in order to provide new knowledge about the metabolic disorders related to PSSM. For a better understanding of the PSSM physiopa-thology in Norman Cob horses, we propose exploring the PSSM muscle fiber metabolic disorders by measuring gene expression in relationship with the histological pheno-type.
Methods
Horses, genotyping and muscle biopsies
All the horses were genotyped for the GYS1 c.926G>A mutation [21] (wild type GG, heterozygous GA or homozygous AA).
A biopsy of the gluteus medius muscle was performed in 13 Norman adult horses: 4 females and 9 males, 4–17 years old. This muscle was chosen because of (i) its important propulsion function in horse locomotion, (ii) its early and major histological involvement in the course of the disease [1] and (iii) the good standardization of biopsy sampling [22]. The horses were sedated and received a local anaesthesia before making a small skin incision according to a standardized protocol used in routine for
muscle disease diagnostic. The biopsy of the dorsal com-partment of the gluteus medius was performed at the first third distance between the sacral and coxae tuber. A biopsy needle with automatic sampling was vertically inserted until its extremity just under the fascia corresponding to a 3.5 cm depth for the gluteus medius. Each muscle biopsy was divided in two parts, and the first part was frozen in isopentane cooled with liquid nitrogen for histological analysis and the second part was collected for genomic analysis. The blood was removed by absorbing it with a compress and immediately frozen in the RNA later® at
-80°C. Informed consent was obtained from the horse owner, the French National Studs (Les Haras Nationaux), and the study was approved by the animal care committee of the National Research Institute of Agriculture (INRA).
Histological analysis
Briefly, the muscle samples were serially sectioned (8 mm thick) and each section was stained with either hematox-ylin-eosin-safranine (HES), or periodic acid-Schiff (PAS) with or without incubation for 20 minutes at 37°C with α-amylase [1]. Intracytoplasmic presence of amylase-resistant material was used as diagnosis criteria for PSSM: seven were PSSM horses and six were control horses [2]. Morphometric analysis was performed additionally for histologic quantitative evaluation using a digital camera (Nikon DXM 1200, Badhoevedo, Netherlands) combined with image-analyzing software (Lucia imaging software, Laboratory Imaging Inc., Prague, Czech Republic). Per-centages of aggregate-containing and vacuolated fibers were calculated as described previously [1] from each PAS-amylase-stained and HES-stained sections respectively. Additional biopsies from one PSSM horse (#49) was des-ignated for routine electron microscopy and subsequently fixed in 2.5% buffered glutaraldehyde, postfixed in osmium tetroxide, embedded in epoxy resin, cut into 1-mm-thick sections, stained with uranyl acetate and lead citrate, and examined by transmission electron micros-copy.
Production of the equine long oligonucleotide microarray
Gene expression analysis was performed using a home-made equine long oligonucleotide microarray which included 384 equine transcripts: 50 probes of the mito-chondrial genome and 334 probes of the nuclear genome [see Additional file 1 and GEO Platform accession number GPL8349: http://www.ncbi.nlm.nih.gov/geo/ query/acc.cgi?acc=GPL8349]. This equine oligonucleotide microarray was designed according to the derived method used for open access human and mouse long oligonucle-otide microarrays [23]. Briefly, the list of human anno-tated genes (available in the NCBI public data base) involved in muscle structure, contraction, energetic
metabolism and inflammation processes was used to identify the equine candidate genes that could be interest-ing to put on the microarray. Then, this list of candidates was crossed with the orthologous equine sequences avail-able in 2006 on the NCBI data base using a blast method [24]. In addition, 50 other probes of the equine mito-chondrial genome were designed to measure the expres-sion of the 13 genes (2 different probes per protein gene) coding for the protein units of the respiratory chain as well as 22 tRNA and 2 rRNA. Finally, 384 probes of 50 nucleotides long were calculated and synthesized with a 5' terminal – NH2 modification in order to attach the probe on the slides. The microarrays were spotted at the micro-array service (LEFG, CEA, Evry, France) by printing the equine probes, suspended in a spotting buffer composed of 50% dimethyl sulfoxide (DMSO) and TE on hydrogel slides (Schott Nexterion), with a Microgrid-II-robot. The equine microarray can be spotted alone on a slide or jointly with the 25 K mouse oligonucleotide microarray [23].
This equine microarray has been validated by a reproduc-ibility test, competition test, biological test for equine transcript analysis extracted from different muscles of dif-ferent equine breeds and health status [unpublished data]. Fourteen microarrays were used for analysis of each PSSM muscle sample against reference control muscles using two fluorochromes in a dye-swap design (duplicate measurements).
RNA extraction
Total RNA was extracted from tissues by a phenol-chloro-form method (TRIZOL® reagent). The quality of total RNA
was verified by micro channel electrophoresis (RNA 6000 Nano LabChip®, Bioanalyzer®). The total RNA
concentra-tion and RNA purity were measured by optical density with a spectrophotometer at 260 nm and the ratio 260/ 280 (Nanodrop®). RNA was considered as pure when the
260 nm out of 280 nm absorbance ratio was close to 2. The RNA were stored at -80°C.
RNA in vitro transcription
The synthesis of RNA with a polyA tail was performed using in vitro transcription with aminoallyl UTP. A total RNA (1 μg) was used to start the synthesis using the in vitro transcription kit according to the manufacturer's protocol (Aminoallyl MessageAmp® II aRNA). This
method equally increased the number of mRNA copies of each transcript without changing the proportion of the initial population of transcripts. The integrity and concen-tration of aminoallyl RNA (aaRNA) were checked again by micro channel electrophoresis (RNA 6000 Nano LabChip®, Bioanalyzer®) and a spectrophotometer
Microrray hybridization and signal quantification
All the samples of PSSM muscles were hybridized against the reference control muscles. This reference was made by pooling together all the mRNA extracted after in vitro transcription from the 6 control muscles of the sound horses. Briefly, the hybridization protocol [24] included the following steps. After purification of the amino-mod-ified RNA, monofunctional forms of the Cyanine 3 (Cy3) or Cyanine 5 (Cy5) fluorochrome were coupled to 5 μg of the studied sample and control sample by an indirect method: the ester groups linked to the fluorochromes were bound on the amino-allyl groups incorporated on the RNA during the in vitro transcription. The marked tar-gets were then mixed and hybridized on the same chip for immediate comparison of the two nucleic acid popula-tions. For each sample, a dye-swap (duplicate measure-ment) was performed to avoid asymmetry of marker affinity (Cy3 and Cy5). The two results were averaged before statistical results.
The 5 μg of aaRNA were completely vacuum-dried and resuspended in 9 μL of coupling buffer and 11 μL of dye, the tubes were mixed by vortexing and incubated for 30 minutes in the dark. The reaction was quenched by addi-tion of 0.73 M Hydroxylamine and incubaaddi-tion for 15 minutes in the dark. Excess dye was removed from the labeled aaRNA by purification on a column. Purified labeled aaRNA were subsequently mixed with 10 μg poly (A) RNA, 10 μg yeast tRNA, 10 μg Cot 1 mouse RNA, then precipitated with 0.5 volumes of 7.5 M ammonium ace-tate and 2.5 volumes of absolute ethanol. After centrifuga-tion at 16,000 × g for 45 minutes to 1 hour at 4°C, the supernatant was removed and the pellet was washed once with 700 μL of 70% ethanol. The samples were centri-fuged at 16000 g for 15 minutes at 4°C. The aaRNA pellet was vacuum-dried for 1 minute and then dissolved in 50 μL of the hybridization mix preheated at 50°C: 2 × SSC, 0.1% SDS and 0.1% Salmon sperm DNA. It was mixed by vortexing and incubated in a water bath at 50°C to dis-solve the mRNA pellet. Each slide was rehydrated in a humidified chamber for 1 hour at room temperature then dried in a dessicator for 1 hour. The slides were prehybrid-ized in 0.3% Ethanolamine and 0.05 M Na Borate pH9. The slides were plunged 1 minute in water and dried by centrifugation for 7 minutes at 100 × g. The probe was heated for 2 minutes at 100°C and placed between the slide and a cover slip. The arrays were incubated overnight in a water bath at 50°C in a humidified slide chamber and washed in a first solution of 0.1 × SSC with 0.1% SDS for 5 minutes followed by two washing steps in 0.1× SSC for 5 minutes each at room temperature, under agitation and safe from the light. The arrays were dried by centrifugation at 100 × g for 7 minutes. The image of fluorescence inten-sities of Cy3 (532 nm) and Cy5 (635 nm) were scanned separately with the laser scanner (GenePix® 4000B).
The tiff images (10 μm/pixel) were analyzed using a spe-cific software for microarray image analysis (GenePix® Pro
6.0 software) which allowed locating the spots automati-cally with manual control and quantifying the fluores-cence intensity of each spot. For each microarray, the data output were the fluorescence intensities of all the spots corresponding to each gene. These data were imported in a genomic data analysis software (Gene Spring® software)
to normalize the data before filtering and statistical anal-ysis. For each sample (horse), a duplicate analysis (dye-swap) was made and the average fluorescence results were used. Then, all the results were normalized per spot and per microarray by the Lowess regression method in order to remove systematic variations. Finally, for each sample and each gene an expression ratio was obtained:
Ratio = Expression of each PSSM muscle/expression in the reference control muscle
For statistical analysis, a log transformation ratio was used to normalize the distribution. A list of the significant genes were obtained by filtering the genes with a cuoff t-test p-value p < 0.05 with Benjamini and Hochberg mul-tiple testing correction method to avoid a false discovery rate [25]. The Student t-test detected the mean expression ratio of replicates which are significantly different from one (expression ratio = 1, means no gene expression change).
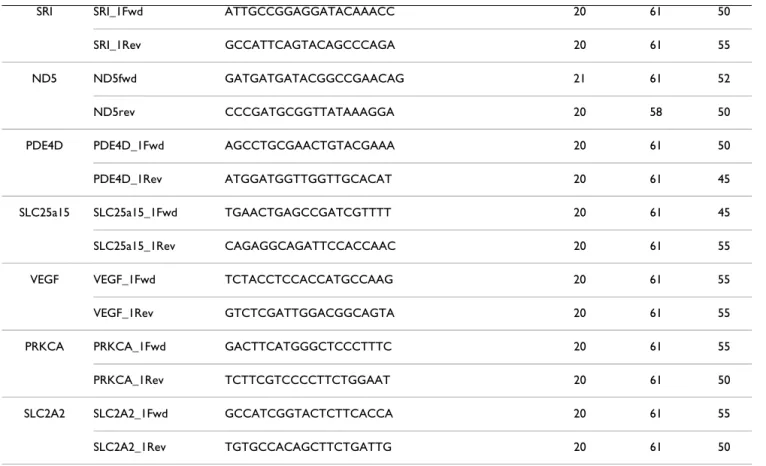
Real time quantitative RT-PCR
In order to validate the equine microarray results, quanti-tative RT-PCR were conducted in triplicate for the top ten up and down-regulated gene transcripts both in control and PSSM horses. The primers were designed using Primer express software (Applied Biosystem) (Table 1). All the reactions were carried out on the real time PCR system 7500 (Applied Biosystems). Briefly, reverse transcription was performed on 20 ng of aaRNA obtained by aminoallyl amplification (RNA used for microarray hybidization and RT-PCR were issued from the same preparation). Random primers (100 ng) and 10 pmol of dATP, dCTP, dGTP and dTTP were added to RNA in a 13 μL final volume. The reaction tubes were incubated at 70°C for 5 min. The ran-dom annealing primer was performed by an incubation at room temperature (~25°C) for 10 min. Four microliters of 5× first strand buffer, 200 pmol of DTT and 200 U of Superscript II reverse transcriptase were added in the tube for a 20 μL final volume and incubated at 42°C for 1 hour. The enzyme was inactivated by incubating the mix-ture at 70°C for 15 min. The cDNA concentration was measured by optical density with a spectrometer that measured absorbance at 260 and 280 nm (Nanodrop®).
The equine cDNA solution was diluted in water to obtain a final concentration of 20 ng/μL and stored at -20°C. Complementary DNA (100 ng) obtained from aaRNA was
Table 1: List of the primers used for real time quantitative RT-PCR.
Gene Primer name Primer sequence Length Salt Tm GC%
IL18 IL18_1Fwd TGCATTAGCTTGGTGGAAATG 21 61 42 IL18_1Rev AGGTTCAAGCCTGCCAAAGT 20 61 50 CTSS CTSS_1Fwd ACAACGGCATCGATTCAGAC 20 61 50 CTSS_1Rev GCCAAAGGGAAGTTCGGTAT 20 60 50 LUM LUM_1Fwd CCTGGAGGTCAATGAACTTGAA 22 61 45 LUM_1Rev ACGCAAATGCTTGATCTTGG 20 61 45 CD44 CD44_1Fwd GATCCACCCCAACTCCATCT 20 61 55 CD44_1Rev TGACCGAGGTGCAGTCTTCT 20 61 55 FN1 FN1_1Fwd CCCTGGTGTCACAGAGGCTA 20 61 60 FN1_1Rev AGTTGGGGAGGCTCATCTGT 20 61 55 GSTO1 GSTO1_1Fwd TACCTCATCTGGCCCTGGTT 20 62 55 GSTO1_1Rev ATGGCTTCCATCCAGAGCTT 20 61 55 VCAM1 VCAM1_1Fwd GCACTGCCATTGAGATGTGA 20 61 50 VCAM1_1Rev TGCAATGTTGCTATGGCTCA 20 61 45 ITGB1 ITGB1_1Fwd TCTCCAGAAGGTGGCTTTGA 20 61 50 ITGB1_1Rev TCCGTGGAAAATACCAGCAG 20 61 50 CXCR4 CXCR4_1Fwd GCAGCAGCAGGTAGCAAAGT 20 61 55 CXCR4_1Rev CCACGTCATCCTCCGTGTAG 20 61 60 HIF1A HIF1A_1Fwd GGACTCGGATCATCTGACCA 20 61 55 HIF1A_1Rev TATCCCCCTCTTTTGGCAAG 20 61 50 NFKBIB NFKBIB_1Fwd CGTCATCCACAAAGATGCAG 20 60 50 NFKBIB_1Rev CTGGGCCTCAACAGCCTAGT 20 62 60 PLCG2 PLCG2_1Fwd CATCTTGTACGGCACCCAGT 20 61 55 PLCG2_1Rev TTCAAGCCAGACAGCCACTT 20 61 50 ND3 ND3fwd CCACAACTAAACATCTATGCAGAAAAA 27 62 33 ND3rev GGAGGCGTGCTGACCCTAT 19 62 63 SLC25a17 SLC25a17_1Fwd GCAATCTGGGTCAAAGGTCA 20 61 50 SLC25a17_1Rev GCCCCTTGCAGCTTTAGTCT 20 61 55
amplified in a 20 μL PCR reaction with 10 μmol of each specific primer and 10 μL SYBR® Green PCR Master Mix.
Amplification steps were as follows: 10 min denaturation at 95°C, 40 cycles of denaturation at 95°C for 15 s and annealing extension at 60°C for 1 min. The comparative threshold cycle (CT) method was used for the calculation of amplification as specified by the manufacturer. The expression results of the quantitative RT-PCR of the con-trol and PSSM horses were normalized by the mean CT of the reference gene 12S rRNA measured in all the muscle samples and the relative expression ratio of PSSM against the control group was calculated.
Data mining
A biological interpretation of the data was performed using two types of analysis to identify the main biological functions and the main metabolic pathway disorders revealed by the expression profile of the PSSM muscles. The categorization of the gene functions was generated through the use of Ingenuity® Pathway Analysis http://
www.ingenuity.com. The analysis identified the biologi-cal functions that were the most significant to the gene list results. The significant genes associated with biological functions in the knowledge database (gene functions described in published papers) were considered for the
analysis. The Fischer exact test was used to calculate a p-value determining the probability that each biological function assigned to that data set is due to chance alone. The analysis of the main metabolic pathways and their dysfunctions was performed using a Java/Perl software, Predictsearch® (Prediguard, http://prediguard.com/pre
dictsearch.htm) which has been previously described in [26]. This software allows the characterization of the path-ways as well as the functional networks in which the selected genes were involved. Briefly, gene aliases corre-sponding to the significant modulated genes were submit-ted as queries to PubMed in order to collect titles and abstracts of all related publications. The results are pre-sented in a 2D graph that shows the relationships between each gene and cell type, cellular compartment, and bio-logical function.
Results
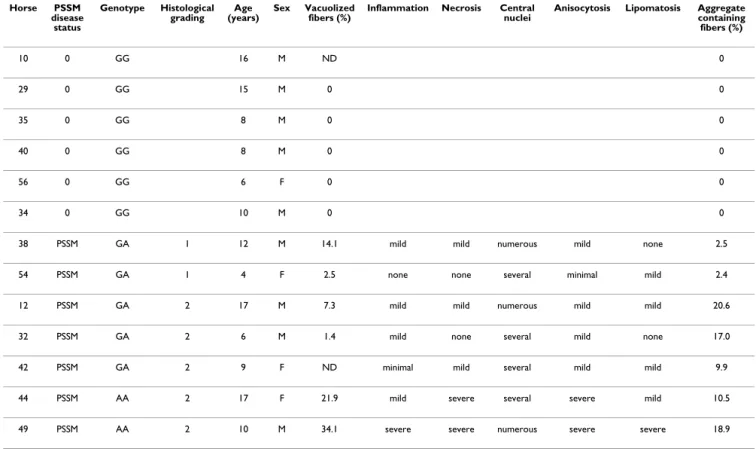
Genotypes and histological phenotypes
The PSSM horse genotypes for the GYS1 c.926G>A muta-tion were 5 heterozygous (AG) and 2 homozygous (AA) (Table 2). The 6 control horses were wild type (GG). Het-erozygosity seemed to be consistent with the dominant mode of inheritance.
SRI SRI_1Fwd ATTGCCGGAGGATACAAACC 20 61 50 SRI_1Rev GCCATTCAGTACAGCCCAGA 20 61 55 ND5 ND5fwd GATGATGATACGGCCGAACAG 21 61 52 ND5rev CCCGATGCGGTTATAAAGGA 20 58 50 PDE4D PDE4D_1Fwd AGCCTGCGAACTGTACGAAA 20 61 50 PDE4D_1Rev ATGGATGGTTGGTTGCACAT 20 61 45 SLC25a15 SLC25a15_1Fwd TGAACTGAGCCGATCGTTTT 20 61 45 SLC25a15_1Rev CAGAGGCAGATTCCACCAAC 20 61 55 VEGF VEGF_1Fwd TCTACCTCCACCATGCCAAG 20 61 55 VEGF_1Rev GTCTCGATTGGACGGCAGTA 20 61 55 PRKCA PRKCA_1Fwd GACTTCATGGGCTCCCTTTC 20 61 55 PRKCA_1Rev TCTTCGTCCCCTTCTGGAAT 20 61 50 SLC2A2 SLC2A2_1Fwd GCCATCGGTACTCTTCACCA 20 61 55 SLC2A2_1Rev TGTGCCACAGCTTCTGATTG 20 61 50
Intracytoplasmic presence of amylase-resistant material, used as diagnosis criteria for PSSM, was observed in biop-sies of the 7 out of the 13 horses (Figure 1). Two horses were graded as mildly affected (less than 3% of fibers con-taining PAS positive amylase resistant material) and five horses as severely affected (10 to 20% of affected fibers) (Table 2) using quantitative evaluation of aggregate-con-taining fibers as previously published [1]. The two homozygous horses were histologically severely affected. Heterozygous horses could present the mild (n = 2) or the severe (n = 3) phenotype.
Some other myopathic changes were also identified in affected horses with marked individual variations. Numerous fibers underwent segmental necrosis that was associated with mononuclear cell infiltration foci (Figure 1). Some of these foci were centered on fragmented fibers with many macrophages phagocytizing cellular necrotic debris. Strikingly, fiber necrosis was more prominent in homozygous PSSM horses. In this marked inflammatory context, some endomysial fibrosis was also present. Addi-tionally, in all PSSM muscles, we noted an increased number of central nuclei. This change corresponds to muscular regeneration. Some degree of anisocytosis of
muscular fibers was always present in affected muscles and was more severe in the two homozygous horses. Fatty infiltration of muscular fascia and replacement of muscle fibers by adipose tissue was also sometimes observed, this change being particularly severe in one homozygous horse.
Ultrastructural evaluation of one severely affected horse (#49) was performed (Figure 2). Extensive accumulation of an abnormal polysaccharide appearing as dense parti-cles, displaced and partially replaced mitochondria and myofibrils, a number of which was severely decreased. This accumulation was exclusively cytoplasmic, mem-brane unbound and particularly abundant around nuclei and in the subsarcolemmal region of the cytoplasm, where numerous mitochondria are normally present in sound animals. Strikingly, we also reported some mito-chondrial ultrastructural changes, namely a decrease of the cristae number, formation of myelinic bodies and swelling.
Gene transcript expressions
Thirty-three percent of the probes of the micorarray were significantly hybridized with a high fluorescence value,
Table 2: Genotype of GYS1 mutation and histological data of the horses.
Horse PSSM disease status Genotype Histological grading Age (years) Sex Vacuolized fibers (%)
Inflammation Necrosis Central nuclei
Anisocytosis Lipomatosis Aggregate containing fibers (%) 10 0 GG 16 M ND 0 29 0 GG 15 M 0 0 35 0 GG 8 M 0 0 40 0 GG 8 M 0 0 56 0 GG 6 F 0 0 34 0 GG 10 M 0 0
38 PSSM GA 1 12 M 14.1 mild mild numerous mild none 2.5
54 PSSM GA 1 4 F 2.5 none none several minimal mild 2.4
12 PSSM GA 2 17 M 7.3 mild mild numerous mild mild 20.6
32 PSSM GA 2 6 M 1.4 mild none several mild none 17.0
42 PSSM GA 2 9 F ND minimal mild several mild mild 9.9
44 PSSM AA 2 17 F 21.9 mild severe several severe mild 10.5
49 PSSM AA 2 10 M 34.1 severe severe numerous severe severe 18.9
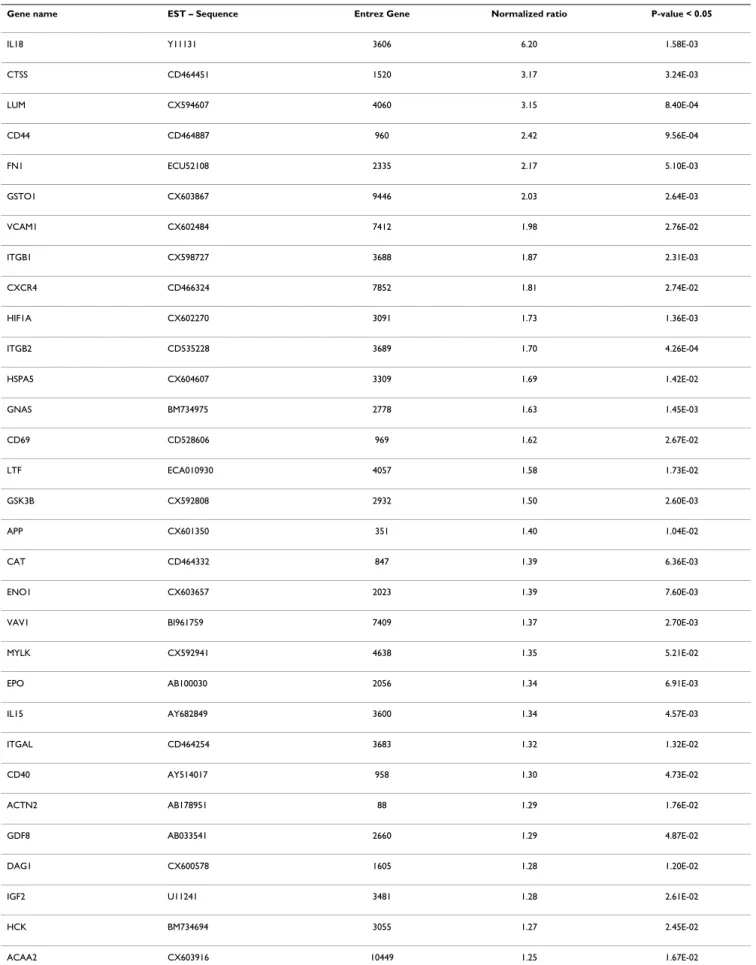
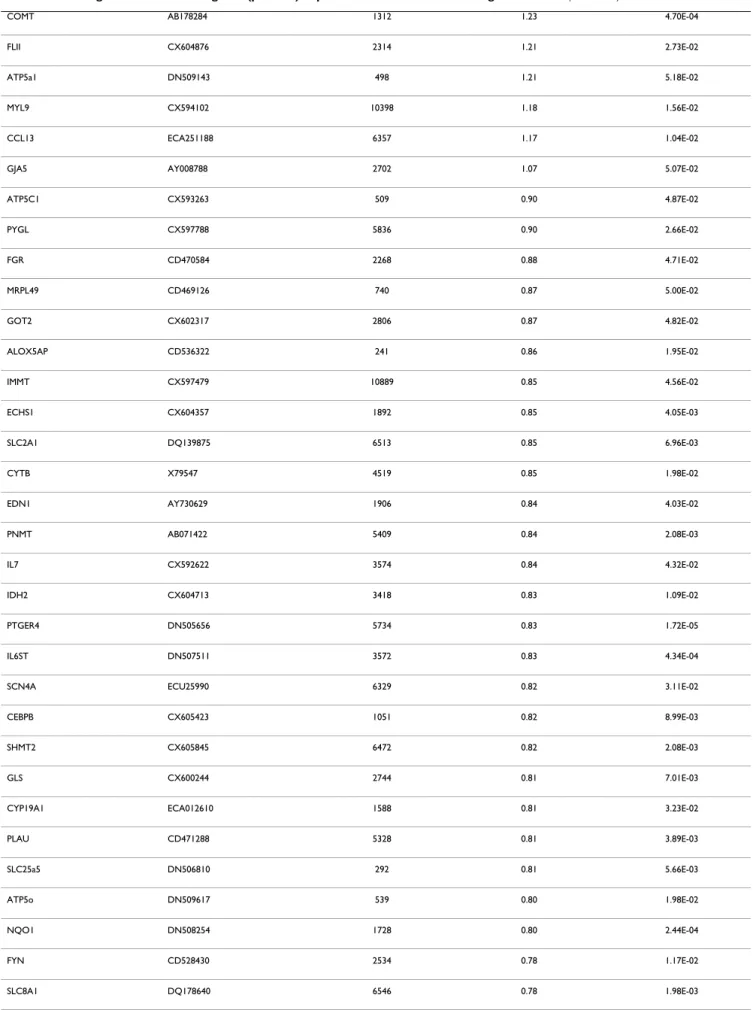
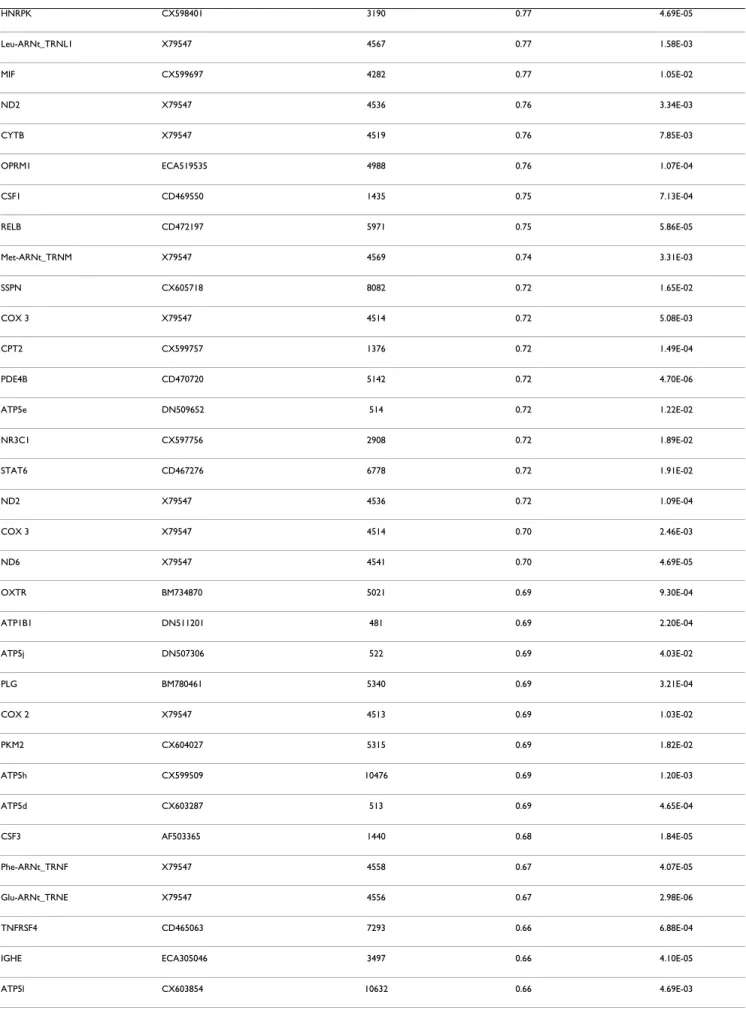
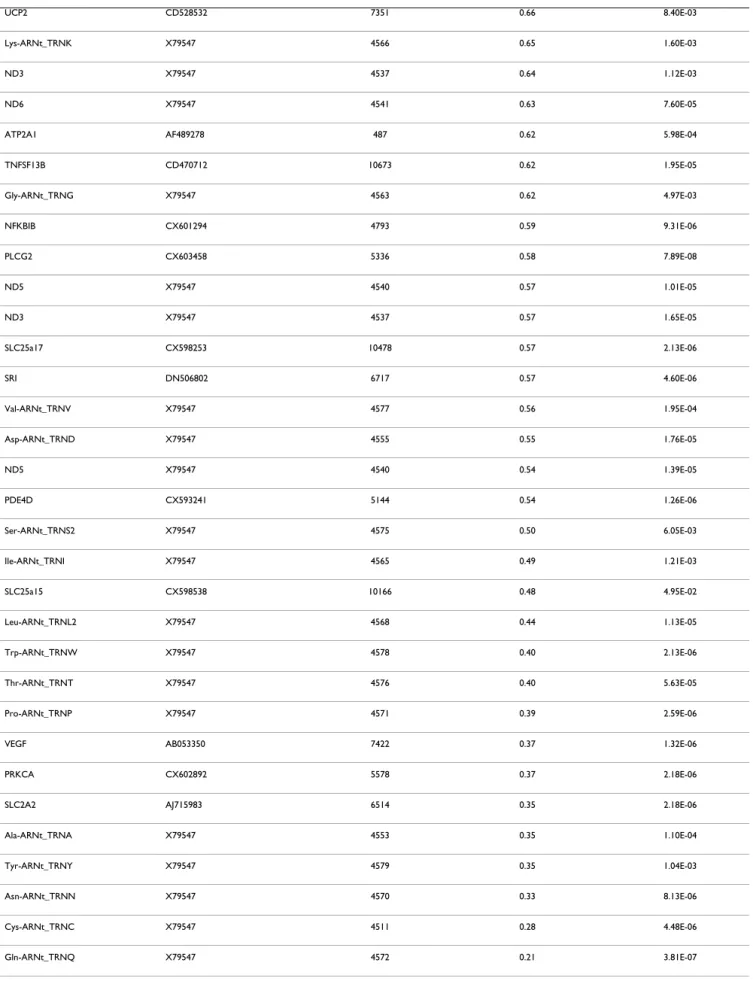
especially for mitochondrial genes. All the data of the present study have been deposited in NCBI's Gene Expres-sion Omnibus and are accessible through GEO series acces-sion number GSE15572 http://www.ncbi.nlm.nih.gov/ sites/entrez?db=gds&cmd=search&term=GSE15572. After filtering the normalized expression ratios with a cut-off at p < 0.05 (normalized ratio significantly different from 1), a total of 129 genes exhibited significant changes of expression levels between PSSM and control muscles (Table 3). This set contained 16 up-regulated genes (nor-malized ratio > 1.5), 37 down-regulated genes
(normal-ized ratio < 0.66) and 76 moderately modulated genes (0.66 < normalized ratio < 0.9 and 1.07 < normalized ratio < 1.5). This list of significant genes was used for the rest of the study. The maximal up-regulation value was observed for interleukin 18 (IL18) 6.2 fold change, and the following genes were up-regulated up to 2 fold: CTSS, LUM, CD44, FN1, GST01. The maximum down regula-tion was observed for the mitochondrial tRNA genes (TRNQ, TRNC, TRNN, TRNY, TRNA) from -4.83 to -2.86 fold changes. The three most down-regulated genes cod-ing for proteins were the followcod-ing: SLC2A2 or GLUT2 (-2.84), PRKCα (-2.72), VEGFα (-2.68).
Ultrastructural evaluation of muscular biopsy from a PSSM affected Norman Cob horse #49
Figure 2
Ultrastructural evaluation of muscular biopsy from a PSSM affected Norman Cob horse #49. (A) Transversal section. (B) Longitudinal section. Severe mitochondrial (m) and myofibrillar (f) loss due to abnormal accumulation of granular material (arrowhead) resembling glycogen. Some myelinic bodies (arrow) were present that demonstrated mitochondrial degeneration. A nucleus is indicated (n).
A
B
Histological evaluation of muscular biopsies from Norman Cob horses
Figure 1
Histological evaluation of muscular biopsies from Norman Cob horses. (A) Severe form of polysaccharide storage myopathy corresponding to a homozygous horse (# 44) for the GYS1 c.926 A allele. Numerous muscle fibers contained abnormal accumulation of polysaccharidic material (arrowheads). The endomysium was focally infiltrated by mononuclear cells (°), some adipocytes (*) and was diffusely thickened by fibrosis (arrows). (B) Mild form of polysaccha-ride storage myopathy corresponding to a heterozygous horse (# 54) for the GYS1 c.926 A allele. Compared to the severe form of the disease, the number of polysaccharide containing fibers (arrowheads) was lower and the endomy-sium was subnormal except for some fatty infiltration (°). (C) Muscle aspect of a control horse (#56). (A-C) Hematoxylin-eosin-safranine staining.
A
B
The relative expression ratio of the top ten genes up- or down-regulated between PSSM and the control group were compared to the results obtained by microarray anal-ysis (Table 4). A significant correlation of r = 0.54 (p < 0.01) between the two methods was calculated. As in microarray results, the mitochondrial genes ND3 and ND5 were found down-regulated using quantitative RT-PCR analysis. The hypoxia markers were also in agree-ment: VEGFα was down-regulated and HIF1α was up-reg-ulated. All inflammation markers (IL18, CTSS, LUM, CD44, GSTO1, VCAM1, ITGB1, CXCR4) were up-regu-lated as in microarray results except FN1 and ITGB1 which were found down-regulated. The gene markers of aerobic pathway SLC25a17 was found up-regulated by quantita-tive RT-PCR and SCL25a15 down-regulated as in microar-ray data.
Gene functions and pathways
Our list of modulated genes was classified by categories of cellular functions, canonical pathways and signaling path-ways using Ingenuity Pathway Analysis®. Protein
synthe-sis, apoptosynthe-sis, cellular movement, growth and proliferation are the main significant cellular functions (p < 0.05) that are associated to the modulated genes (Figure 3). The main significant (p < 0.05) canonical pathways concerned oxidative phosphorylation, ubiquinone bio-sythesis, aminosugar and purine metabolism. The main significant signaling pathways (p < 0.05) were related to G-protein couple receptor, hypoxia, NF-κB, VEGFα and IL6, IL10, apoptosis and leukocyte extravasation signal-ing. The main metabolic disorders significantly (p < 3.3 10-4) detected were mitochondrial dysfunction, hypoxia
and alteration of NF-κB activity.
The main tissue, organ and cellular context and the bio-logical activities that were cited in relationship with the set of genes were further investigated using Predictsearch®
analysis. Using the PubMed database, it was found that a part of the significant modulated genes were strongly associated with the following terms: skeletal muscle, mitochondria, myoblast, endoplasmic reticulum. (Figure 4). In addition, the more frequent biological activities cited in relationship with the set of genes were glycolysis, respiratory chain, hypoxia, glycogen synthase, inflamma-tory myopathy (Figure 5). The main metabolic pathway disorders are described in the figures 6, 7 and 8 using these data (see Additional file 2 for the legends of the pathway drawings). In the mitochondria, all the genes were down regulated (Figure 6). The tRNA were severely down regulated (fold change between -4.83 and -2.27). The other mitochondrial genes ND2, ND3, ND5, ND6, COX2 and COX3 were moderately down regulated but with low expression values (fold changes between -1.31 and -1.85). Other nuclear genes involved in the aerobic metabolism of the mitochondria were down regulated as
well: UCP2, GNAS, SLC25a15, SLC2a2 (GLUT2), ATP5L, ATP5J, ATP5D and ATP5H.
A chronic inflammation process of the muscle was revealed by many up-regulated genes like interleukin 18 (IL18), CD44, CD69, CTSS, FN1, HSPA5, ITGB1, ITGB2, VCAM, CXCR4 LTF, GSTO1 and LUM (Figure 7).
The up-regulation of the glycogen synthase kinase-3 (GSK3β) under its active form could be responsible for glycogen synthase inhibition, and for hypoxic transcrip-tion factor inhibitranscrip-tion (HIF1α) by phosphorylatranscrip-tion as indicated by data mining analysis (Figure 8). In addition, VEGFα was down-regulated and avoided capillarization and oxygen distribution of the new regenerated muscle fibers. These gene regulations increased muscle hypoxia. Other interesting genes were slightly up-regulated: ENO1 (1.39) was involved in the end of glycolysis; IGF2 (1.34) was involved in the growth hormone activity in muscle differentiation; EPO (1.28) was involved in hematopoi-etic function. Some other genes were slightly down-regu-lated: PYGL (-1.11) was involved in glycogen metabolism; IL6ST (-1.20), IL7 (-1.19) were involved in hematoprotein signaling; MIF (-1.30) was involved in cell inflammatory regulation. GSK3β, PYGL, GLUT2 are the only genes closely related to glycogen metabolism.
Discussion
The equine genome has been recently sequenced and pub-lished. However, there is no equine DNA microarray com-mercially available to date. Three homemade cDNA microarrays have been designed using transcripts extracted from equine joint cartilage and synoviocytes [27-29]. This first cDNA microarray was tissue specific and poorly annotated. Another approach to analyse gene expression in equine leukocytes and muscles was to use a heterologous 15 K cDNA microarray designed from murine embryonic tissues by the National Institute on Aging [30]. It includes 15,264 unique genes for which about 11,000 are annotated. It has been demonstrated by several tests that mouse cDNA microarrays can adequately hybridize equine genes expressed in muscles [31]. It was assumed that interspecific hybridization between an equine cDNA and a probe of 1,500 nucleotide length is possible between two mammal species because the genes involved in the basic cellular functions are highly con-served during mammal evolution as obcon-served for myosin heavy chains [32]. The same mouse 15 K cDNA microar-ray has been used to detect inflammation and oxidative stress by the study of leukocyte gene expression in endur-ance horses performing a race of 140 km [33]. In order to improve specificity of the hybridization and to focus on a few numbers of functions of the genes (inflammation, muscle metabolism), an equine oligonucleotide
microar-Table 3: List of significant modulated genes (p < 0.05) expressed in the muscles suffering from PSSM.
Gene name EST – Sequence Entrez Gene Normalized ratio P-value < 0.05
IL18 Y11131 3606 6.20 1.58E-03
CTSS CD464451 1520 3.17 3.24E-03 LUM CX594607 4060 3.15 8.40E-04 CD44 CD464887 960 2.42 9.56E-04 FN1 ECU52108 2335 2.17 5.10E-03 GSTO1 CX603867 9446 2.03 2.64E-03 VCAM1 CX602484 7412 1.98 2.76E-02 ITGB1 CX598727 3688 1.87 2.31E-03 CXCR4 CD466324 7852 1.81 2.74E-02 HIF1A CX602270 3091 1.73 1.36E-03 ITGB2 CD535228 3689 1.70 4.26E-04 HSPA5 CX604607 3309 1.69 1.42E-02 GNAS BM734975 2778 1.63 1.45E-03 CD69 CD528606 969 1.62 2.67E-02 LTF ECA010930 4057 1.58 1.73E-02 GSK3B CX592808 2932 1.50 2.60E-03 APP CX601350 351 1.40 1.04E-02 CAT CD464332 847 1.39 6.36E-03 ENO1 CX603657 2023 1.39 7.60E-03
VAV1 BI961759 7409 1.37 2.70E-03
MYLK CX592941 4638 1.35 5.21E-02
EPO AB100030 2056 1.34 6.91E-03
IL15 AY682849 3600 1.34 4.57E-03
ITGAL CD464254 3683 1.32 1.32E-02
CD40 AY514017 958 1.30 4.73E-02
ACTN2 AB178951 88 1.29 1.76E-02
GDF8 AB033541 2660 1.29 4.87E-02
DAG1 CX600578 1605 1.28 1.20E-02
IGF2 U11241 3481 1.28 2.61E-02
HCK BM734694 3055 1.27 2.45E-02
COMT AB178284 1312 1.23 4.70E-04
FLII CX604876 2314 1.21 2.73E-02
ATP5a1 DN509143 498 1.21 5.18E-02
MYL9 CX594102 10398 1.18 1.56E-02
CCL13 ECA251188 6357 1.17 1.04E-02
GJA5 AY008788 2702 1.07 5.07E-02
ATP5C1 CX593263 509 0.90 4.87E-02 PYGL CX597788 5836 0.90 2.66E-02 FGR CD470584 2268 0.88 4.71E-02 MRPL49 CD469126 740 0.87 5.00E-02 GOT2 CX602317 2806 0.87 4.82E-02 ALOX5AP CD536322 241 0.86 1.95E-02 IMMT CX597479 10889 0.85 4.56E-02 ECHS1 CX604357 1892 0.85 4.05E-03 SLC2A1 DQ139875 6513 0.85 6.96E-03 CYTB X79547 4519 0.85 1.98E-02
EDN1 AY730629 1906 0.84 4.03E-02
PNMT AB071422 5409 0.84 2.08E-03
IL7 CX592622 3574 0.84 4.32E-02
IDH2 CX604713 3418 0.83 1.09E-02
PTGER4 DN505656 5734 0.83 1.72E-05
IL6ST DN507511 3572 0.83 4.34E-04
SCN4A ECU25990 6329 0.82 3.11E-02
CEBPB CX605423 1051 0.82 8.99E-03
SHMT2 CX605845 6472 0.82 2.08E-03
GLS CX600244 2744 0.81 7.01E-03
CYP19A1 ECA012610 1588 0.81 3.23E-02
PLAU CD471288 5328 0.81 3.89E-03 SLC25a5 DN506810 292 0.81 5.66E-03 ATP5o DN509617 539 0.80 1.98E-02 NQO1 DN508254 1728 0.80 2.44E-04 FYN CD528430 2534 0.78 1.17E-02 SLC8A1 DQ178640 6546 0.78 1.98E-03
HNRPK CX598401 3190 0.77 4.69E-05
Leu-ARNt_TRNL1 X79547 4567 0.77 1.58E-03
MIF CX599697 4282 0.77 1.05E-02
ND2 X79547 4536 0.76 3.34E-03
CYTB X79547 4519 0.76 7.85E-03
OPRM1 ECA519535 4988 0.76 1.07E-04
CSF1 CD469550 1435 0.75 7.13E-04 RELB CD472197 5971 0.75 5.86E-05 Met-ARNt_TRNM X79547 4569 0.74 3.31E-03 SSPN CX605718 8082 0.72 1.65E-02 COX 3 X79547 4514 0.72 5.08E-03 CPT2 CX599757 1376 0.72 1.49E-04 PDE4B CD470720 5142 0.72 4.70E-06 ATP5e DN509652 514 0.72 1.22E-02 NR3C1 CX597756 2908 0.72 1.89E-02 STAT6 CD467276 6778 0.72 1.91E-02 ND2 X79547 4536 0.72 1.09E-04 COX 3 X79547 4514 0.70 2.46E-03 ND6 X79547 4541 0.70 4.69E-05 OXTR BM734870 5021 0.69 9.30E-04 ATP1B1 DN511201 481 0.69 2.20E-04 ATP5j DN507306 522 0.69 4.03E-02 PLG BM780461 5340 0.69 3.21E-04 COX 2 X79547 4513 0.69 1.03E-02 PKM2 CX604027 5315 0.69 1.82E-02 ATP5h CX599509 10476 0.69 1.20E-03 ATP5d CX603287 513 0.69 4.65E-04 CSF3 AF503365 1440 0.68 1.84E-05 Phe-ARNt_TRNF X79547 4558 0.67 4.07E-05 Glu-ARNt_TRNE X79547 4556 0.67 2.98E-06 TNFRSF4 CD465063 7293 0.66 6.88E-04
IGHE ECA305046 3497 0.66 4.10E-05
UCP2 CD528532 7351 0.66 8.40E-03
Lys-ARNt_TRNK X79547 4566 0.65 1.60E-03
ND3 X79547 4537 0.64 1.12E-03
ND6 X79547 4541 0.63 7.60E-05
ATP2A1 AF489278 487 0.62 5.98E-04
TNFSF13B CD470712 10673 0.62 1.95E-05 Gly-ARNt_TRNG X79547 4563 0.62 4.97E-03 NFKBIB CX601294 4793 0.59 9.31E-06 PLCG2 CX603458 5336 0.58 7.89E-08 ND5 X79547 4540 0.57 1.01E-05 ND3 X79547 4537 0.57 1.65E-05 SLC25a17 CX598253 10478 0.57 2.13E-06 SRI DN506802 6717 0.57 4.60E-06 Val-ARNt_TRNV X79547 4577 0.56 1.95E-04 Asp-ARNt_TRND X79547 4555 0.55 1.76E-05 ND5 X79547 4540 0.54 1.39E-05 PDE4D CX593241 5144 0.54 1.26E-06 Ser-ARNt_TRNS2 X79547 4575 0.50 6.05E-03 Ile-ARNt_TRNI X79547 4565 0.49 1.21E-03 SLC25a15 CX598538 10166 0.48 4.95E-02 Leu-ARNt_TRNL2 X79547 4568 0.44 1.13E-05 Trp-ARNt_TRNW X79547 4578 0.40 2.13E-06 Thr-ARNt_TRNT X79547 4576 0.40 5.63E-05 Pro-ARNt_TRNP X79547 4571 0.39 2.59E-06
VEGF AB053350 7422 0.37 1.32E-06
PRKCA CX602892 5578 0.37 2.18E-06
SLC2A2 AJ715983 6514 0.35 2.18E-06
Ala-ARNt_TRNA X79547 4553 0.35 1.10E-04
Tyr-ARNt_TRNY X79547 4579 0.35 1.04E-03
Asn-ARNt_TRNN X79547 4570 0.33 8.13E-06
Cys-ARNt_TRNC X79547 4511 0.28 4.48E-06
Gln-ARNt_TRNQ X79547 4572 0.21 3.81E-07
Significant p-value (p < 0.05) indicated that the expression ratio was significantly different from 1.
ray database was designed and validated according to the same methods as previously described [24,31].
The muscle biopsies mainly collected muscle fiber cells and also some leucocytes that were in the muscular blood vessels and in the muscle connective tissue itself because
of chronic inflammation observed in PSSM muscles. His-tological data showed mild or severe inflammation with macrophages and lymphocyte infiltration. These leuco-cytes should have an important signaling activity which was observed in the present results. However, the relative amount of muscle RNA extracted from the muscle was
Table 4: Real time quantitative RT-PCR Results of the top ten up- and down-regulated genes measured by the microarray analysis. Gene Normalized ratio of microarray
analysis
Relative expression ratio of quantitative RT-PCR
RT-PCR ratio different from 1 p-value UP IL18 6.20 4.29 0.01 CTSS 3.17 1.61 0.05 LUM 3.15 1.75 0.05 CD44 2.42 2.87 0.01 FN1 2.17 0.72 0.05 GSTO1 2.03 3.23 0.01 VCAM1 1.98 7.21 0.01 ITGB1 1.87 0.09 0.05 CXCR4 1.81 3.43 0.01 HIF1A 1.73 2.99 0.01 DOWN NFKBIB 0.59 0.60 0.05 PLCG2 0.58 0.97 NS ND3 0.57 0.60 0.05 SLC25a17 0.57 1.77 0.05 SRI 0.57 0.98 NS ND5 0.54 0.49 0.05 PDE4D 0.54 0.67 0.05 SLC25a15 0.48 0.96 NS VEGF 0.37 0.35 0.05 PRKCA 0.37 0.16 0.05 SLC2A2 0.35 0.79 0.05 One sample T-test compared the relative expression ratio of RT-PCR results against 1. For p > 0.05,
Categories of cellular gene functions
Figure 3
Categories of cellular gene functions. Our list of modulated genes was classified by categories of cellular functions using a data mining software (Ingenuity Pathway Analysis®). The analysis identified the biological functions that were the most
signifi-cant to the gene list results. The signifisignifi-cant genes associated with biological functions in the knowledge database (gene func-tions described in published papers) were considered for the analysis. The Fischer exact test was used to calculate a p-value determining the probability that each biological function assigned to that data set is due to chance alone. In the present figure, protein synthesis, apoptosis, cellular movement, growth and proliferation are the main significant cellular functions (p < 0.05) that are associated to the modulated genes.
more than 98% of the total RNA according to the relative mass of tissue. In addition, very little blood was collected with the automatic biopsy needle and the blood at the surface of the sample was absorbed before freezing the biopsy into nitrogen.
The gene expression analysis of the PSSM muscles mainly revealed the metabolic disorders due to this equine gly-cogenosis but not directly the genes suspected to be responsible for this pathology. The candidates GBE1, PFKM, AGL and even GYS1 were not significantly modu-lated. GYS1 with a G-to-A mutation has been identified to be associated with PSSM in different breeds [21]. Most of the PSSM cases (77) diagnosed by histology were hetero-zygous for the mutation but 22 PSSM cases were of the homozygous wild type and the GYS1 mutation alone
could not explain the glycogenosis. It has been suggested that another non-GYS1 glycogenosis could explain these 22 PSSM cases. The glycogen synthase activity measured in vitro was higher in PSSM muscle. In the present study, all the PSSM horses were mutated for GYS1. The homozygous horses exhibited more severe histological disorders with characteristic amylase-resistant aggregates but also tissular damages, namely fiber necrosis, anisocy-tosis, some endomysial fibrosis and fatty infiltration. The main dysfunctions observed were a chronic inflam-matory myopathy and a severe hypoxia associated with a very low activity of the oxidative energetic metabolism. The chronic inflammation of the PSSM muscle was revealed both by histological observations and the number of up-regulated genes involved in inflammation
Relationships between pairs of genes and cellular compartments
Figure 4
Relationships between pairs of genes and cellular compartments. The analysis of the main metabolic pathways and their dysfunctions was performed using a data mining software (Predictsearch®). Briefly, gene aliases corresponding to the
sig-nificant modulated genes were submitted as queries to PubMed in order to collect titles and abstracts of all related publica-tions. The results showed that a part of the significant modulated genes were strongly associated with the following terms: skeletal muscle, mitochondria, myoblast, endoplasmic reticulum.
pathways: IL18, CD44, CD69, CTSS, FN1, HSPA5, ITGB1, ITGB2, VCAM, CXCR4, LTF, GSTO1 and LUM. These genes could be expressed in the leukocytes present in the PSSM muscle and/or in muscle fibers. Interleukin 18 (IL18) was the most up-regulated gene and four other genes had the highest expression ratios: CTSS, LUM, CD44 and FN1. The chemokine receptor 4 (CXCR4) has been observed more specifically in some idiopathic inflammatory myopathies in humans [34]. This gene encodes a CXC chemokine receptor specific for stromal cell-derived factor-1. This protein has 7 transmembrane regions and is located on the cell surface.
According to the histological data, it was postulated that this inflammatory context was stimulated by muscle fiber necrosis and progressed to fiber regeneration and endomysial fibrosis. This mecanism is illustrated by (i) the insulin like growth hormone type II (IGF2) that was also up-regulated and contributed to myoblast differenti-ation [35] and mitochondrial biogenesis [36]; (ii) the up-regulation of lumican (LUM) gene that encodes for a small keratan sulfate proteoglycan molecule, which is involved in the collagen fibrillogenesis and fibrous tissue formation.
IL18 is an interferon gamma-induced protein that is involved in immune cell activation, proliferation,
infiltra-tion, apoptosis and cytotoxicity. In humans, the plasmatic concentration of IL18 is an interesting predictor of the risk of myocardial infarction, artherosclerosis and metabolic syndrome observed in obesity [37,38]. A high plasmatic concentration of IL18 is correlated with insulin resistance and body mass index. In PSSM horses, an increased sensi-tivity to insulin has also been observed [14]. The measure of IL18 concentration could be an interesting blood marker of PSSM. As indicated by the data mining analysis, the chronic inflammation and IL18 up-regulation could be responsible of PI3K/Akt/GSK3β activation [39]. The up-regulation GSK3β under its active form could be responsible for the glycogen synthase (GYS1) inhibition as indicated by data mining analysis. The down-regula-tion of the glycogen metabolism was also indicated by a low expression value of PYGL. The up-regulation of active GSK3β could be responsible of hypoxia and low capillar-ization of the PSSM muscle. The GSK3β activity increases the HIF1α destabilization by phosphorylation which is finally degraded in the proteasome [39,40]. Conse-quently, the low expression of HIF1α should down-regu-late VEGFα expression [41] which contributes to a poor capillarization and increased chronic hypoxia of the regenerated muscle fibers. The down-regulated protein kinase Cα (PRKCα) gene is involved in many important signaling pathways like calcium, MAPK and VEGFα.
Relationships between metabolic pathways or disorders and genes
Figure 5
Relationships between metabolic pathways or disorders and genes. The analysis of the main metabolic pathways and their dysfunctions was performed using a data mining software (Predictsearch®). Briefly, gene aliases corresponding to the
sig-nificant modulated genes were submitted as queries to PubMed in order to collect titles and abstracts of all related publica-tions. The PubMed ID of the related publications were indicated on the figures 6, 7 and 8. The results showed that the more frequent biological activities cited in relationship with the set of genes were glycolysis, respiratory chain, hypoxia, glycogen syn-thase and inflammatory myopathy.
Other genes involved in hematoprotein signaling were down-regulated IL6ST, IL7. It was interesting to observe the up-regulation of the erythropoietin cytokine gene (EPO), which also demonstrated hypoxia in the PSSM muscle. This EPO transcript could be expressed both in blood and muscle cells. This plasmatic cytokine is well known to regulate red cell production by promoting erythroid differentiation and initiating hemoglobin syn-thesis. This cytokine also has neuroprotective activity and an anti-apoptotic neuronal effect useful for treatment of a variety of potential brain injuries [42,43]. The use of EPO
in chronic kidney disease [44], heart failure and other car-diovascular diseases [45] demonstrated the pleiotropic cytokine activity of EPO as anti-apoptotic and with a tis-sue protective effect against hypoxia. Erythropoietin injec-tion could be useful for the treatment of hypoxia in PSSM cases.
Hypoxia could also be related to the severe oxidative metabolism dysfunction observed at the mitochondrial level. Ultrastructural observations showed a decrease in the number of mitochondria and mitochondrial damages
Mitochondrial dysfunctions
Figure 6
Mitochondrial dysfunctions. Mitochondria is one of the compartment detected by electronic microscopy and data mining as illustrated in figure 4. In the mitochondria, the tRNA were severely down regulated (fold change between -4.83 and -2.27). The other mitochondrial genes ND2, ND3, ND5, ND6, COX2 and COX3 were moderately down-regulated but with low expression values (fold changes between -1.31 and -1.85). Other nuclear genes involved in the aerobic metabolism of the mito-chondria were down regulated as well: UCP2, GNAS, SLC25a15, SLC2a2 (GLUT2), ATP5L, ATP5J, ATP5D and ATP5H. The PubMed ID of the related publications found by the data mining analysis were indicated on the figure (8611159; 7533543; 2988521).
with reduction the cristae number, swelling and forma-tion of myelinic bodies. The genomic markers of the mito-chondrial dysfunction were the low level of most of the tRNA and the down-regulated genes coding for the respi-ratory chain sub-units (ND2, ND3, ND5, ND6, COX2 and COX3). The respiratory chain dysfunction in conjunction with a low expression of UCP2 could increase the reactive oxygen species accumulation in the mitochondria and could be responsible for muscle fiber apoptosis and necrosis. In addition, other nuclear genes involved in the mitochondrial oxidative metabolism were down-regu-lated (GNAS, SLC25A15, SLC2a2 (GLUT2), ATP5L, ATP5J, ATP5D and ATP5H). The down-regulation of the glucose transporter GLUT2 could also be related to the hypoxia. This transporter facilitates bidirectional trans-port of glucose through the cellular membrane and
decreases the glucose available for glycogen synthesis, gly-colysis and the Krebs cycle. The mitochondrial carrier ornithine transporter (SLC25A15) down-regulation also indicates a reduction of mitochondrial activity.
Conclusion
Protein synthesis, apoptosis, cellular movement, growth and proliferation were the main cellular functions associ-ated with the modulassoci-ated genes. This was in agreement with the histological observations of active muscle fiber regeneration in PSSM muscles. Several up-regulated genes, especially interleukine 18 (IL18), revealed a severe muscular inflammation in PSSM muscles as confirmed by histological findings of leucocyte infiltrations. The up-reg-ulation of active glycogen synthase kinase-3 (GSK3β) could be responsible for both glycogen synthase (GYS1)
Inflammatory process
Figure 7
Inflammatory process. The chronic inflammation of the PSSM muscle was revealed both by histological observations and the number of up-regulated genes involved in inflammation pathways as illustrated in data mining results figure 5: IL18, CD44, CD69, CTSS, FN1, HSPA5, ITGB1, ITGB2, VCAM, CXCR4, LTF, GSTO1 and LUM. These genes could be expressed in the leu-kocytes present in the PSSM muscle and/or in muscle fibers. The PubMed ID of the related publications found by the data min-ing analysis were indicated on the figure (15574430; 15661938; 12742663; 12101280; 15019705; 2988521; 11890723).
inhibition and hypoxia-inducible factor (HIF1α) destabi-lization. Many genes involved in mitochondrial functions were down-regulated and utltrastructural observations revealed many mitochondrial disorders. Consequently, the main disorders observed in PSSM muscles could be related to mitochondrial dysfunctions, glycogenesis inhi-bition and the chronic hypoxia.
Authors' contributions
EB designed and carried out the study and wrote the man-uscript. EM carried out the RNA extraction and microarray hybridization. NJ carried out the equine microarray
design. TL carried out the histopathological and ultrastructural analysis. LG carried out the histological processing. BH and SC collected the PSSM cases and mus-cle biopsies. GG participated in the collection of PSSM cases and data analysis. XM participated in the quantita-tive RT-PCR analysis. PB and MC participated in the data mining analysis. OA and PM produced the home made equine microarrays and check quality. XG participated in the equine microarray design and the functional genomic analysis of the data. All authors read and approved the final manuscript.
Relationships between inflammatory process, inhibition of glycogen synthase and hypoxia according to data mining Results of figure 5
Figure 8
Relationships between inflammatory process, inhibition of glycogen synthase and hypoxia according to data mining Results of figure 5. The up-regulation of the glycogen synthase kinase (GSK3β) under its active form was responsible for the glycogen synthase (GYS1) inhibition. The up-regulation of GSK3β has another effect on hypoxia and low capillarization of the PSSM muscle. Phosphorylation of GSK3β increases the HIF1α destabilization which is degraded in the proteasome. Con-sequently, the low expression of HIF1α down-regulates VEGFα expression which contributes to a poor capillarization and increases chronic hypoxia of the regenerated muscle fibers. The PubMed ID of the related publications found by the data min-ing analysis were indicated on the figure (16464907; 15574430; 15227652; 15642371; 12764143; 11890723; 11029398).
Additional material
Acknowledgements
This study was supported by the grants of the French National Studs (Les Haras Nationaux), Genopole® ATIGE project and INRA.
Mrs Wendy Brand-Williams (INRA, genetic Department) is greatly acknowledged for her English revision.
References
1. Larcher T, Herszberg B, Molon-Noblot S, Guigand L, Chaffaux S, Guerin G, Cherel Y: Polysaccharide Storage Myopathy in Cob Normand Draft Horses. Veterinary Pathology 2008, 45:154-158. 2. Valberg SJ, Cardinet GH 3rd, Carlson GP, DiMauro S:
Polysaccha-ride storage myopathy associated with recurrent exertional rhabdomyolysis in horses. Neuromuscular Disorders 1992, 2:351-359.
3. Valberg SJ, Macleay JM, Billstrom JA, Hower-Moritz MA, Mickelson JR: Skeletal muscle metabolic response to exercise in horses with 'tying-up' due to polysaccharide storage myopathy. Equine veterinary Journal 1999, 31:43-47.
4. Aleman M: A review of equine muscle disorders. Neuromuscular Disorders 2008, 18:277-287.
5. Quiroz-Rothe E, Novales M, Aguilera-Tejero E, Rivero JL: Polysac-charide storage myopathy in the M. longissimus lumborum of showjumpers and dressage horses with back pain. Equine veterinary Journal 2002, 34:171-176.
6. Valentine BA, Cooper BJ: Incidence of polysaccharide storage myopathy: necropsy study of 225 horses. Veterinay Pathology 2005, 42:823-827.
7. McCue ME, Ribeiro WP, Valberg SJ: Prevalence of polysaccharide storage myopathy in horses with neuromuscular disorders. Equine veterinary Journal Supplement 2006, 36:340-344.
8. McCue ME, Valberg SJ: Estimated prevalence of polysaccharide storage myopathy among overtly healthy Quarter Horses in the United States. Journal of American Veterinary Medecine Associa-tion 2007, 231(Sept 1):746-750.
9. Firshman AM, Valberg SJ, Bender JB, Annandale EJ, Hayden DW: Comparison of histopathologic criteria and skeletal muscle fixation techniques for the diagnosis of polysaccharide stor-age myopathy in horses. Veterinary Pathology 2006, 43:257-269. 10. Firshman AM, Baird JD, Valberg SJ: Prevalences and clinical signs
of polysaccharide storage myopathy and shivers in Belgian draft horses. Journal of American Vetereinary Medecine Association 2005, 227(15):1958-1964.
11. McGowan CM, McGowan TW, Patterson-Kane JC: Prevalence of equine polysaccharide storage myopathy and other myopa-thies in two equine populations in the United Kingdom. Vet-erinary Journal 2009, 180(3):330-336.
12. Valentine BA: Diagnosis and treatment of equine polysaccha-ride storage myopathy. Journal Equine veterinary Science 2005, 25:52-61.
13. Yoon SS: Glycogen storage disease: clinical, biochemichal and molecular heterogeneity. Seminar in Pediatric Neurology 2006, 13:115-120.
14. De La Corte FD, Valberg SJ, MacLeay JM, Williamson SE, Mickelson JR: Glucose uptake in horses with polysaccharide storage myopathy. American Journal of veterinary Research 1999, 60:458-462. 15. Valberg SJ, Townsend D, Mickelson JR: Skeletal muscle glycolytic capacity and phosphofructokinase regulation in horses with polysaccharide storage myopathy. American Journal of veterinary Research 1998, 59:782-5.
16. Annandale EJ, Valberg SJ, Mickelson JR, Seaquist ER: Insulin sensitiv-ity and skeletal muscle glucose transport in horses with equine polysaccharide storage myopathy. Neuromuscular Disor-ders 2004, 14:666-674.
17. Park HB, Marklund S, Jeon JT, Mickelson JR, Valberg SJ, Sandberg K, Andersson L: Molecular characterization and mutational screening of the PRKAG3 gene in the horse. Cytogenetic and Genome Research 2003, 102:211-216.
18. Dranchak PK, Leiper FC, Valberg SJ, Piercy RJ, Carling D, McCue ME, Mickelson JR: Biochemical and genetic evaluation of the role of AMP-activiated protein kinase in polysaccharide staorag myopathy in Quarter Horses. American Journal of veterinary Research 2007, 68:1079-1084.
19. Herszberg B, Mata X, Giulotto E, Decaunes P, Piras FM, Chowdhary BP, Chaffaux S, Guérin G: Characterization of the equine glyco-gen debranching enzyme glyco-gene (AGL): glyco-genomic and cDNA structure, localization, polymorphism and expression. Gene 2007, 404(1):1-9.
20. Ward TL, Valberg SJ, Adelson DL, Abbey CA, Binns MM, Mickelson JR: Glycogen branching enzyme (GBE1) mutation causing equine glycogen storage disease IV. Mammalian Genome 2004, 15:570-577.
21. McCue ME, Valberg SJ, Miller MB, Wade C, DiMauro S, Akman HO, Mickelson JR: Glycogen synthase (GYS1) mutation causes a novel skeletal muscle glycogenosis. Genomics 2008, 91:458-466. 22. Valette JP, Barrey E, Jouglin M, Courouce A, Auvinet B, Flaux B: Standardisation of muscular biopsy of gluteus medius in French trotters. Equine Veterinary Journal Suppl 1999, 30:342-344. 23. Le Brigand K, Russell R, Moreilhon C, Rouillard JM, Jost B, Amiot F,
Magnone V, Bole-Feysot C, Rostagno P, Virolle V, Defamie V, Dessen P, Williams G, Lyons P, Rios G, Mari B, Gulari E, Kastner P, Gidrol X, Freeman TC, Barbry P: An open-access long oligonucleotide microarray resource for analysis of the human and mouse transcriptomes. Nucleic Acids Research 2006, 34(12):e87. 24. Muller C, Denis M, Gentzbittel L, Faraut T: The Iccare Web
server: an attempt to merge sequence and mapping infor-mation for plant and animal species. Nucleic Acids Research 2004, 32:W429-W434.
25. Benjamini Y, Hochberg Y: Controlling the false discovery rate: a practical and powerful approach to multiple testing. Journal of Royal Statistical Society 1995, 57(Ser. B):289-300.
26. Eyles D, Almeras L, Benech P, Patatian A, Mackay-Sim A, McGrath J, Féron F: Developmental vitamin D deficiency alters the expression of genes encoding mitochondrial, cytoskeletal and synaptic proteins in the adult rat brain. Journal of Steroid Biochemistry and Molecular Biology 2007, 103:538-545.
27. Vandenplas ML, Moore JN, Hurley DJ: Equine cDNA Microarrays for Examining Gene Expression Profiles In Pro-Inflamma-tory Conditions And Other Diseases. Plant and Animal Genome XIII Conference, Equine session. San Diego 2005:W091.
28. McLeod JN: Equine articular cartilage microarray. Plant and Ani-mal Genome XIII Conference, Equine session. San Diego 2005:W092. 29. Gu W, Bertone AL: Generation and performance of an
equine-specific large-scale gene expression microarray. American Jour-nal veterinary Research 2004, 65:1664-1673.
30. Kargul GJ, Dudekula DB, Qian Y, Lim MK, Jaradat SA, Tanaka TS, Carter MG, Ko MS: Verification and initial annotation of the NIA mouse 15k cDNA clone set. Nature Genetics 2001, 28:17-18.
Additional file 1
List of the 384 equine gene probes included in the equine microarray. The file provides the following information for each probe: the gene name, Genebank ID, Entrez Gene ID of the human orthologous gene and loca-tion of the 50nt-oligonucleotides in the equine transcript sequence. More information is available on GEO database under accession number GPL8349: http://www.ncbi.nlm.nih.gov/geo/query/
acc.cgi?acc=GPL8349. Click here for file
[http://www.biomedcentral.com/content/supplementary/1746-6148-5-29-S1.xls]
Additional file 2
Legend of metabolic pathways presented in figures 6, 7 and 8. Signs and conventions used to describe the pathways presented in figures 6, 7 and 8.
Click here for file
[http://www.biomedcentral.com/content/supplementary/1746-6148-5-29-S2.pdf]
Publish with BioMed Central and every scientist can read your work free of charge "BioMed Central will be the most significant development for disseminating the results of biomedical researc h in our lifetime."
Sir Paul Nurse, Cancer Research UK Your research papers will be:
available free of charge to the entire biomedical community peer reviewed and published immediately upon acceptance cited in PubMed and archived on PubMed Central yours — you keep the copyright
Submit your manuscript here:
http://www.biomedcentral.com/info/publishing_adv.asp
BioMedcentral 31. Mucher E, Jayr L, Rossignol F, Amiot F, Gidrol X, Barrey E: Method
of gene expression profiling in equine muscle using cDNA microarrays. Equine veterinary Journal Suppl 2006, 36:359-364. 32. Weiss A, McDonough D, Wertman B, Acakpo-Satchivi L,
Mont-gomery K, Kucherlapati R, Leinwand L, Krauter K: Organization of human and mouse skeletal myosin heavy chain gene clusters is highly conserved. Proceedings of the National Academy of Science USA 1999, 96:2958-2963.
33. Barrey E, Mucher E, Robert C, Amiot F, Gidrol X: Gene expression profiling in blood cells of performer and disqualified endur-ance horses. Equine veterinary Journal Suppl 2006, 36:43-49. 34. De Paepe B, Creus KK, De Bleecker JL: Chemokines in idiopathic
inflammatory myopathies. Front Bioscience 2008, 13:2548-2577. 35. Erbay E, Park IH, Nuzzi PD, Schoenherr CJ, Chen J: IGF-II
tran-scription in skeletal myogenesis is controlled by mTOR and nutrients. Journal of Cellular Biology 2003, 163:931-936.
36. Short KR, Moller N, Bigelow ML, Coenen-Schimke J, Nair KS: Enhancement of muscle mitochondrial function by growth hormone. Journal of Clinical Endocrinology and Metabolism 2008, 93:597-604.
37. Boekholdt SM, Peters RJ, Hack CE, Day NE, Luben R, Bingham SA, Wareham NJ, Reitsma PH, Khaw KT: IL-8 plasma concentrations and the risk of future coronary artery disease in apparently healthy men and women: the EPIC-Norfolk prospective pop-ulation study. Arteriosclerosis and Thrombo Vascular Biolology 2004, 24:1503-1508.
38. Zirlik A, Abdullah SM, Gerdes N, MacFarlane L, Schönbeck U, Khera A, McGuire DK, Vega GL, Grundy S, Libby P, de Lemos JA: Inter-leukin-18, the metabolic syndrome, and subclinical athero-sclerosis: Results from the Dallas Heart Study. Arteriosclerosis and Thrombo Vascular Biology 2007, 27:2043-2049.
39. Chandrasekar B, Mummidi S, Claycomb WC, Mestril R, Nemer M: Interleukin-18 is a pro-hypertrophic cytokine that acts through a phosphatidylinositol 3-kinase-phosphoinositide-dependent kinase-1-Akt-GATA4 signaling pathway in cardi-omyocytes. Journal of Biological Chemistry 2005, 280(6):4553-4567. 40. Schnitzer SE, Schmid T, Zhou J, Eisenbrand G, Brüne B: Inhibition of GSK3beta by indirubins restores HIF-1alpha accumulation under prolonged periods of hypoxia/anoxia. FEBS Letter 2005, 579:529-533.
41. Mottet D, Dumont V, Deccache Y, Demazy C, Ninane N, Raes M, Michiels C: Regulation of hypoxia-inducible factor-1alpha pro-tein level during hypoxic conditions by the phosphatidylinosi-tol 3-kinase/Akt/glycogen synthase kinase 3beta pathway in HepG2 cells. Journal of Biological Chemistry 2003, 278(15):31277-3127785.
42. Genc S, Koroglu TF, Genc K: Erythropoietin and the nervous system. Brain Research 2004, 1000(12):19-31.
43. Yatsiv I, Grigoriadis N, Simeonidou C, Stahel PF, Schmidt OI, Alexan-drovitch AG, Tsenter J, Shohami E: Erythropoietin is neuropro-tective, improves functional recovery, and reduces neuronal apoptosis and inflammation in a rodent model of experimen-tal closed head injury. Federation of American Societies of Experimen-tal Biology Journal 2005, 19:1701-1703.
44. Bahlmann FH, Kielstein JT, Haller H, Fliser D: Erythropoietin and progression of CKD. Kidney International Suppl 2007, 107:S21-25. 45. Manolis AS, Tzeis S, Triantafyllou K, Michaelidis J, Pyrros I, Sakellaris
N, Kranidis A, Melita H: Erythropoietin in heart failure and other cardiovascular diseases: hematopoietic and pleio-tropic effects. Current Drug Targets Cardiovascular and Haematologi-cal Disorders 2005, 5:355-375.