HAL Id: hal-00329256
https://hal.archives-ouvertes.fr/hal-00329256
Submitted on 1 Jan 2003
HAL is a multi-disciplinary open access
archive for the deposit and dissemination of
sci-entific research documents, whether they are
pub-lished or not. The documents may come from
teaching and research institutions in France or
abroad, or from public or private research centers.
L’archive ouverte pluridisciplinaire HAL, est
destinée au dépôt et à la diffusion de documents
scientifiques de niveau recherche, publiés ou non,
émanant des établissements d’enseignement et de
recherche français ou étrangers, des laboratoires
publics ou privés.
B. Heber, G. Sarri, G. Wibberenz, C. Paizis, P. Ferrando, A. Raviart, A.
Posner, R. Müller-Mellin, H. Kunow
To cite this version:
B. Heber, G. Sarri, G. Wibberenz, C. Paizis, P. Ferrando, et al.. The Ulysses fast latitude scans:
COSPIN/KET results. Annales Geophysicae, European Geosciences Union, 2003, 21 (6),
pp.1275-1288. �hal-00329256�
Annales
Geophysicae
The Ulysses fast latitude scans: COSPIN/KET results
B. Heber1, G. Sarri2, G.Wibberenz3, C. Paizis4, P. Ferrando5, A. Raviart5, A. Posner3, R. M ¨uller-Mellin3, and
H. Kunow3
1Fachbereich Physik, Universit¨at Osnabr¨uck, Barbarastr. 7, 49069 Osnabr¨uck, Germany 2IASF/CNR, Milano, Italy
3Institut f¨ur Experimentelle und Angewandte Physik, Universit¨at Kiel, D-24118 Kiel, Germany 4IASF/CNR, and Universit´a di Milano, Milano, Italy
5DAPNIA/Service d’Astrophysique, C.E.Saclay, 91191 Gif-sur-Yvette, France
Received: 13 September 2002 – Revised: 29 January 2003 – Accepted: 7 February 2003
Abstract. Ulysses, launched in October 1990, began its
sec-ond out-of-ecliptic orbit in December 1997, and its secsec-ond fast latitude scan in September 2000. In contrast to the first fast latitude scan in 1994/1995, during the second fast lat-itude scan solar activity was close to maximum. The solar magnetic field reversed its polarity around July 2000. While the first latitude scan mainly gave a snapshot of the spatial distribution of galactic cosmic rays, the second one is dom-inated by temporal variations. Solar particle increases are observed at all heliographic latitudes, including events that produce >250 MeV protons and 50 MeV electrons. Using observations from the University of Chicago’s instrument on board IMP8 at Earth, we find that most solar particle events are observed at both high and low latitudes, indicating either acceleration of these particles over a broad latitude range or an efficient latitudinal transport. The latter is supported by “quiet time” variations in the MeV electron background, if interpreted as Jovian electrons. No latitudinal gradient was found for >106 MeV galactic cosmic ray protons, during the solar maximum fast latitude scan. The electron to proton ra-tio remains constant and has practically the same value as in the previous solar maximum. Both results indicate that drift is of minor importance. It was expected that, with the rever-sal of the solar magnetic field and in the declining phase of the solar cycle, this ratio should increase. This was, how-ever, not observed, probably because the transition to the new magnetic cycle was not completely terminated within the heliosphere, as indicated by the Ulysses magnetic field and solar wind measurements. We argue that the new A<0-solar magnetic modulation epoch will establish itself once both polar coronal holes have developed.
Key words. Interplanetary physics (cosmic rays; energetic
particles; interplanetary magnetic fields)
Correspondence to: B. Heber
(bheber@uni-osnabrueck.de)
1 Introduction
The Ulysses spacecraft was launched on 6 October 1990 in the declining phase of solar cycle 22. In February 1992 the spacecraft encountered the planet Jupiter, and using a gravity assist began its journey out of the ecliptic plane.
The trajectories for the first and second out-of-ecliptic or-bits are displayed in Fig. 1 and some key dates are sum-marized in Table 1. It took more than two years from the Jupiter encounter for Ulysses to reach the highest southern latitude of 80.2◦S, on 13 September 1994. Then, Ulysses moved rapidly northwards, crossed the heliographic equator and climbed to the highest northern latitudes, 80.2◦, on 31 July 1995. On 27 November 2000 and 13 October 2001, the spacecraft reached again the highest southern and northern latitudes. After its second fast latitude scan the spacecraft is now in the declining phase of solar cycle 23 as of June 2002, heading towards the ecliptic plane.
The main scientific goal of the joint ESA-NASA Ulysses deep-space mission is to make the first-ever measurements of the unexplored region of space above the Sun’s poles. The Ulysses scientific investigations encompass studies of the heliospheric magnetic field, heliospheric radio and plasma waves, and the solar wind plasma, including its minor heavy ion constituents, solar and interplanetary energetic particles, galactic cosmic rays and the anomalous cosmic ray compo-nent. The latter three components are the subject of the mea-surements of the Cosmic ray and Solar Particle Investiga-tion Kiel Electron Telescope (COSPIN KET, Simpson et al., 1992).
The intensity of galactic cosmic rays (GCRs) entering the heliosphere – the space defined by the interaction of the su-personic solar wind with the local interstellar medium – is modulated as these particles traverse the turbulent magnetic field embedded in the solar wind. This modulation is caused by a number of physical processes, including spatial diffu-sion, convection and adiabatic deceleration in the expand-ing solar wind, as well as gradient and curvature drift in the large-scale magnetic fields. The strength and relative
1996 1997 1998 1991 1993 1994 1995 1992 Ulysses
First Solar Orbit
Feb 1992 Jupiter Fly-by North Polar Pass
Jun-Sep 1995
South Polar Pass Jun-Nov 1994 Perihelion Mar 1995 Earth Orbit Jupiter Orbit Sun Launch 06.10.1990 Ulysses position on 01.10.1997 (1996) (1997) (1998) 1999 2000 2002 2003 2004 2001 Ulysses
Second Solar Orbit
April 1998 Aphelion North Polar Pass
Sep-Dec 2001
South Polar Pass Sep 2000-Jan 2001 Perihelion
May 2001 Earth Orbit
Jupiter
Sun
Ulysses position on 11.08.19 Fig. 1. Left: The first orbit of Ulysses around the Sun viewed from a perspective of 15 degrees above the ecliptic plane. The dots indicate the position of Ulysses at the beginning of each year. The Jupiter fly-by swung Ulysses out of the ecliptic and into a solar polar orbit. Right: The second orbit of Ulysses viewed from a perspective which shows the 80-degree inclination of the Ulysses orbit to the ecliptic. From http://helio.estec/esa/nl/Ulysses/Orbit.htm.
Table 1. Some key dates in the Ulysses mission
Event Year Month Day
Launch 1990 10 6
Jupiter Encounter (JE) 1992 02 08
1st Polar Pass (S) start 1994 06 26 max. latitude (80.2 S) 1994 09 13 end 1994 11 05 Perihelion (1.3 AU) 1995 03 12 2nd Polar Pass (N) start 1995 06 19 max. latitude (80.2 N) 1995 07 31 end 1995 09 29
Start of 2nd Solar Orbit 1995 10 01
Aphelion (5.4 AU) 1998 04 17 3rd Polar Pass (S) start 2000 09 08 max. latitude (80.2 S) 2000 11 27 end 2001 01 16 Perihelion (1.3 AU) 2001 05 26 4th Polar Pass (N) start 2001 09 03 max. latitude (80.2 N) 2001 10 13 end 2001 12 12
importance of these processes vary with the location in the heliosphere and with the 22-year solar cycle (see Jokipii and Wibberenz, 1998). With Ulysses and especially with the KET instrument it was possible to measure the latitudinal gradients of galactic cosmic ray protons and electrons at solar minimum (Heber et al., 1996b; Ferrando et al., 1996; Heber et al., 1999b) in the inner heliosphere. With the extension of the mission to a second out-of-ecliptic orbit, the investigation of differences in the 3-dimensional modulation of galactic
-30 -20 -10 0 10 1991 1993 1995 1997 1999 2001 2003
Climax Neutron Monitor Sunspot Number
50 100 150 200 Year Climax variation [%] JE FLS EC FLS
Fig. 2. Bartels rotation averaged time profile of >3 GV particles as measured by the Climax neutron monitor (http://ulysses.uchicago. edu/NeutronMonitor/neutron\ mon.html) and monthly averaged sunspot number. The special periods as summarized in Table 1 are marked by shading.
cosmic rays between solar minimum to solar maximum be-came possible. Of special interest are the two periods when Ulysses performed a full latitude survey within 11 months, called Fast Latitude Scans (FLSs, see Table 1). Figure 2 dis-plays the time profile of >3 GV cosmic rays as measured by the Climax neutron monitor. The red curve shows the evo-lution of the smoothed sunspot number during the Ulysses mission. Figure 2 shows the well-known anti-correlation be-tween the intensity of galactic cosmic rays and sunspot num-bers. The times summarized in Table 1 are marked by shad-ing.
The first fast latitude scan in 1994/1995 took place near solar minimum and the second scan in 2000/2001 took place close to solar maximum.
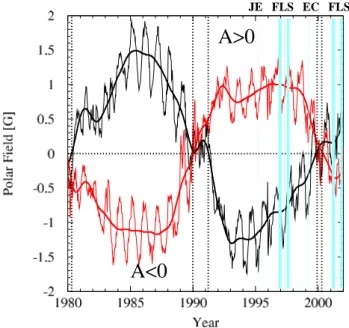
The solar polar magnetic field strength for the South-ern and NorthSouth-ern Hemisphere is displayed in Fig. 3 (http:// quake.stanford.edu/∼wso/). From the superimposed 20 nHz smoothed solar polar magnetic field strength in the North-ern and SouthNorth-ern Hemisphere, it follows that the two hemi-spheres reversed their polarities around 1980, 1990, and 2000. The solar magnetic field is carried by the solar wind from ∼3 solar radii into the heliosphere. Because the solar
FLS EC FLS JE
Fig. 3. Solar polar magnetic field strength (from http://quake. stanford.edu/∼wso/) for the Southern (black) and Northern Hemi-sphere (red). The smoothed curves display the 20 nHz low pass filtered values. The times summarized in Table 1 are marked by shading. The dotted lines indicate time periods of the solar mag-netic field reversals.
wind needs approximately one solar rotation to travel 5 AU, the magnetic polarity of the heliospheric magnetic field will gradually reverse its polarity. It is important to note that it takes approximately a year until the whole region within the termination shock has adapted to the new magnetic field con-figuration.
When the magnetic field is directed outward from the Sun in the north polar region (denoted by A > 0), as in the 1990’s, drift models predict that positively charged particles drift predominantly inward through the solar polar regions and then outward through the equatorial regions along the heliospheric current sheet (Jokipii et al., 1977). In contrast, electrons drift mainly into the inner heliosphere along the heliospheric current sheet and then outward through the po-lar regions (Potgieter and Moraal, 1985). These different drift patterns are responsible for the charge sign dependent latitudinal gradients, as reported by Ferrando et al. (1996); Heber et al. (2002a). However, drift effects also depend on the polarity of the heliospheric magnetic field. Evenson (1998) points out that positive and negative particles cannot have systematic differences in their propagation in a mag-netic field that is symmetric under reflection. In this case, drift patterns for particles of the same rigidity interchange when the solar polarity A or the particle charge q reverse. In the case of a turbulent helicity in the HMF structure, how-ever, the diffusion coefficient for a given polarity state A would depend on the charge sign (see Evenson, 1998).
Models for the long-term modulation of galactic cosmic rays contain time variations of the spatial diffusion coeffi-cients and changes in the structure of the heliospheric
cur-rent sheet (HCS) (see Potgieter et al., 2001). The relative importance of variations in the transport coefficients repre-senting diffusion and drift effects, respectively, is studied by, e.g. Wibberenz et al. (2002). Good indicators for drift ef-fects in modulation are (1) the difference in the latitudinal dependence of oppositely charged cosmic rays during the same polarity epoch (Heber et al., 2002a) and (2) the dif-ferent temporal variation of intensities of oppositely charged cosmic rays (see, e.g. Potgieter et al., 1997; Heber, 2001). The first observation supporting the importance of drifts was the finding of a negative latitudinal gradient by Cummings et al. (1987). With Ulysses at polar latitudes in the inner heliosphere around the A > 0 solar magnetic epoch mini-mum in 1994/1995, the expected positive latitudinal gradi-ents for protons were observed (Heber et al., 1996a; McK-ibben et al., 1996). In contrast, the electron latitudinal gradi-ents were consistent with zero (Ferrando et al., 1996; Heber et al., 1999b).
Burger and Hattingh (1995) showed that the intensity of cosmic ray protons varies as a function of the tilt angle α for both polarity cycles, by solving Parker’s transport equa-tion numerically. This fact, combined with the opposite drift motions of protons and electrons, leads to a characteristic be-havior of the e/p ratio, as the tilt angle varies during the solar cycle, from solar maximum (in the ideal case α ≈ 90◦) to solar minimum (α = 10◦) and then back to high solar activ-ity, as displayed in Fig. 4 in Burger and Potgieter (1999). As shown by these authors the maximum intensity depression for both particle types during solar maximum approaches the no-drift value (diffusion-dominated situation). For the A > 0 epoch protons gain easier access via the polar regions when the tilt angle decreases, so that the e/p-ratio decreases. At low tilt angles α the e/p-ratio is increasing, since protons have nearly recovered while electrons are still sensitive to changes in α. Evenson (1998) and Heber et al. (1999b) could show that the temporal variation of galactic cosmic rays is indeed charge sign dependent at solar minima of either po-larity. Evenson (1998) emphasized the different modulation of the 1.2 GV electrons and helium around solar maximum in 1989. Of special interest are the measurements from the second fast latitude scan in 2000/2001, close to solar maxi-mum. In this paper we report KET observations for different electron and proton channels from this period and compare the observations with the observation of the solar minimum latitude scan, in order to investigate the solar cycle depen-dence, including the transition from the A < 0 to the A > 0 solar magnetic epoch.
2 The Kiel Electron Telescope
The analysis reported here is based on the data from the Kiel Electron Telescope (KET), one of five telescopes of the COs-mic ray and Solar Particle INvestigation (COSPIN), on board the Ulysses spacecraft (Simpson et al., 1992). The KET in-strument measures the intensities and energy spectra of en-ergetic particles separating electrons, hydrogen and helium.
125−250 MeV protons
250−2000 MeV protons
>2 GeV protons
3.5 GV electrons
2.5 GV electrons
1.2 GV electrons
100−125 MeV protons
FLS
EC
FLS
JE
Fig. 4. From top to bottom: Daily averaged count rate of 100–125 MeV (0.3 GV) protons and 52-day “quiet time” count rates of 1.2 GV (black), 2.5 GV (red), and 3.5 GV (green) electrons, and 125–250 MeV (0.8 GV, black), 250–2000 MeV (2.5 GV, red) and >2 GeV (6 GV, green) protons. Ulysses’ distance to the Sun and its heliographic latitude are shown on top.
The instrument covers an energy range from ∼5 MeV/n to above 2 GeV/n for hydrogen and helium, and from ∼3 MeV to above 300 MeV for electrons. In this study we use the nucleon and electron channels listed in Table 2.
From a detailed analysis of the electron channels by Heber et al. (1999b, 2001) it is known that the count rates of the 3– 10 MeV and 7–20 MeV electron channels from 1993 to 1995 contain a significant background induced by γ -rays produced by the Radioisotope Thermoelectric Generator, as well as by the interaction of cosmic ray hadrons with the spacecraft material. Recently, Clem et al. (2002) could determine the background of galactic cosmic ray protons in the 1.2 GV and 2.5 GV electron channels. While the effect is negligible in the 2.5 GV channel, it is of major importance for the 1.2 GV electrons. The time profiles used in this paper will take into account all these corrections.
3 Observations
Figure 4 displays the daily averaged count rate of 100– 125 MeV (0.3 GV) protons and the 52-day averaged “quiet
time” count rates of galactic cosmic ray electrons and protons in several rigidity windows between 0.8 GV and 6 GV from October 1990 to mid 2002, respectively. The 52-day aver-aged “quiet time” counting rates are presented as percentage changes with respect to the rates Cmaxmeasured in mid 1997
at solar minimum, (C(t ) − Cmax)/Cmax. “Quiet time”
pro-files have been determined by using only time periods when the 100-125 MeV proton channel showed no contribution of solar or interplanetary particles (Heber et al., 1999b). The Jo-vian flyby in 1992 (JE), the two rapid pole to pole passages in 1994/1995 and 2000/2001 (FLS), and the ecliptic crossing in 1998 (EC), as given in Table 1, are marked by shading. The observed variations in the particle intensities are caused by the temporal changes during the solar cycle and by spatial variations along the Ulysses trajectory. While the spacecraft remained close to the ecliptic, it encountered solar maximum conditions until mid 1992 and again from 1999 onwards and solar minimum conditions in 1996/1997. During these pe-riods, KET registered minimum and maximum intensities, respectively. The maximum count rates of electrons and pro-tons in 1997 have been used to normalize the data to unity.
10-4 10-3 10-2 10-1 1 10 102 103 1994.8 1995 1995.2 1995.4 1995.6 year count rate [ 1/s ] 2 1.5 1.5 2 -80 -70 -40 0 20 70 80 r [AU] θ[o] 10-4 10-3 10-2 10-1 1 10 102 103 2001 2001.25 2001.5 2001.75 year count rate [ 1/s ] 2 1.5 1.34 1.5 2 -80 -60 -40 -20 0 20 40 60 80 r [AU] θ[o] 10-5 10-4 10-3 10-2 10-1 1 10 102 103 1994.8 1995 1995.2 1995.4 1995.6 year count rate [ 1/s ] 2 1.5 1.5 2 -80 -70 -40 0 20 70 80 r [AU] θ[o] 10-5 10-4 10-3 10-2 10-1 1 10 102 103 2001 2001.25 2001.5 2001.75 year count rate [ 1/s ] 2.5 2 1.5 1.5 2 -80 -60 -40 -20 0 20 40 60 80 r [AU] θ[o]
Protons: 5−25 MeV 250−2000 MeV
38−125 MeV 125−250 MeV
(A)
(B)
30−69 MeV >106 MeV Protons: 11−29 MeV(C)
(D)
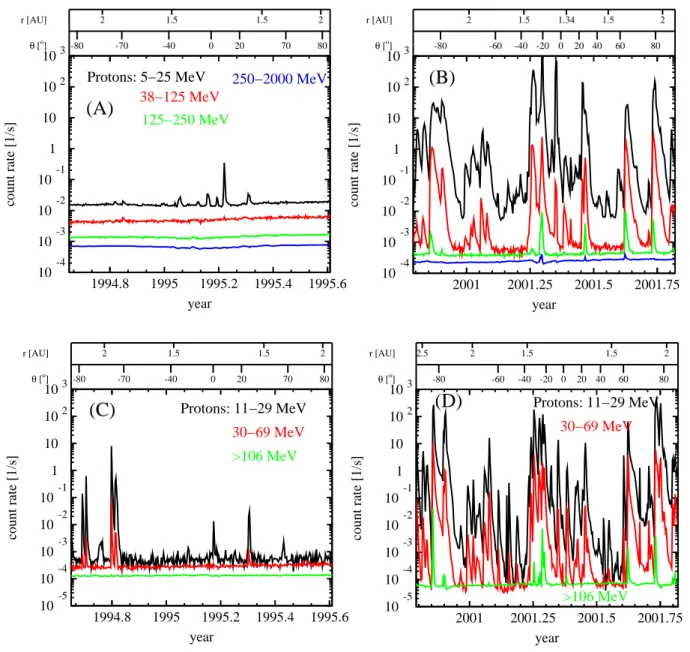
Protons: 11−29 MeV 30−69 MeV >106 MeVFig. 5. Daily averaged count rates of different Ulysses/KET proton channels in the energy range from 5 to 2000 MeV during the first (A) and second (B) fast latitude scan. The lower two panels (C) and (D) display the corresponding proton measurements in the energy range from 11 MeV to >106 MeV at Earth by the University of Chicago’s instrument on board IMP 8.
Therefore, Fig. 4 shows the modulation amplitude from solar minimum to solar maximum in 2000 at different rigidities. The measured values are summarized in the fifth column of Table 2 and show that the modulation decreases with increas-ing rigidity from about 93% for 38–125 MeV/n helium to 17% for >2 GeV/n helium (not shown here). The same trend has been observed in the >1 GV electron channels. It should be noted that a large part of the depression amplitudes be-tween 1998 and 2001 – the steps in modulation – are practi-cally the same for electrons and protons of the same rigidity. One can see, however, that following these depressions after 1998, the recovery time for electrons is slightly larger than for protons; this difference in recovery times also holds for the long-term recovery following 1992, but it is just reversed after the solar maximum in 2001. This agrees with the
con-cept presented by Wibberenz et al. (2002): In the inner solar system, cosmic ray depressions during the onset of modu-lation are related to variations in the radial diffusion coeffi-cient, whereas the different recovery times are related to the difference in drift paths which vary with the polarity A and charge q. Before we discuss the two fast latitude scans with respect to modulation, we investigate the influence of solar activity.
3.1 Solar activity and solar particle events
While the first FLS occurred in the late recovery phase of the solar cycle, the second fast latitude scan appeared around solar maximum. The occurrence of flares and Coro-nal Mass Ejections is low at solar minimum and increases
10-4 10-3 10-2 10-1 1 10 1994.8 1995 1995.2 1995.4 1995.6 year count rate [ 1/s ] 2 1.5 1.5 2 -80 -70 -40 0 20 70 80 r [AU] θ[o] 10-4 10-3 10-2 10-1 1 10 2001 2001.25 2001.5 2001.75 year count rate [ 1/s ] 2 1.5 1.34 1.5 2 -80 -60 -40 -20 0 20 40 60 80 r [AU] θ[o] IMP: 75−95 MeV KET: 69−125 MeV IMP: 75−94 MeV KET: 69−125 MeV
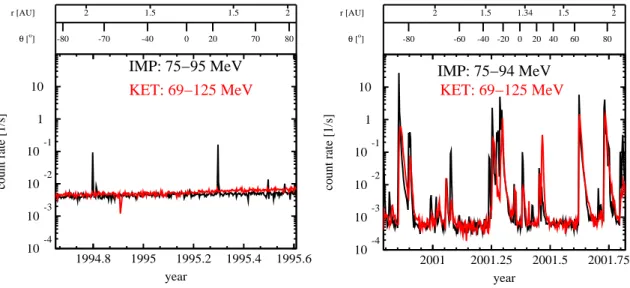
Fig. 6. Daily averaged time profiles of 75–95 MeV and 75–125 MeV protons at Earth and Ulysses for the first and second latitude scan.
Table 2. KET proton, helium and electron channels used in the
cur-rent analysis. The lower (Emin) and upper energy values (Emax)
have been determined by using a GEANT Monte-Carlo model of
the KET. The mean rigidity Pmeanhas been calculated accordingly
(Rastoin, 1995). The modulation amplitudeCminCmax−Cmaxhas been
cal-culated by using Cminand Cmax, the count rates at solar maximum
and minimum in 2000 and 1997, respectively. The mean latitudinal
gradient G2, and the maximum latitudinal gradient G2have been
taken from Heber et al. (1996b) for the first latitude scan
Emin Emax Pmean CminC−Cmax
max G2 G2
particle MeV/n MeV/n MV % %/◦ %/◦
proton 5 25 proton 38 68 proton 100 125 400 91 ± 2 proton 125 250 800 80 ± 2 0.15 0.30 proton 250 2000 2500 70 ± 2 0.21 0.38 proton >106 0.19 0.35 proton >2000 6000 26 ± 1 0.12 0.22 helium 6 25 helium 38 125 800 93 ± 3 0.61 0.95 helium 125 170 1200 81 ± 2 helium 250 2000 3500 64 ± 2 0.23 0.40 helium >2000 12000 17 ± 3 0.09 0.16 electrons 3 10 7 electrons 7 20 14 electrons 460 1200 85 ± 3 electrons 2500 71 ± 2 electrons 3500 62 ± 3
with solar activity. As a consequence, the intensities of the 100–125 MeV protons are highly variable and show several short-term increases. The panels (A) and (B) of Fig. 5 display the Ulysses KET observations of 5 MeV to 2 GeV protons in four different energy channels during the first and second fast
latitude scans. The black, red, green and blue curves corre-spond to 5–25 MeV, 38–125 MeV, 125–250 MeV and 250– 2000 MeV proton channels. 1 AU data from the Chicago in-strument on board IMP8 are shown in the panels (C) and (D) for comparison. Here, the black, red, and green curves corre-spond to the 11–29 MeV, 30–69 MeV, and >106 MeV proton channels. In order to visualize the differences during these paths the same scales have been used. Obviously only a few short-term increases at energies of about 30 MeV have been observed in 1994 and 1995. But more important, most of these increases occurred at latitudes between 30◦south and 30◦north, which was the region controlled by the low speed and variable solar wind, emanating from the streamer belt region. These events are caused by Corotating Interaction Regions (CIRs) and transient interplanetary shocks (Sander-son et al., 1999). A simple inspection of panel (C) in Fig. 5 leads to the conclusion that the time profiles at Earth and at Ulysses are dominated by different particle populations; i. e. the two particle events measured at Earth in late 1994 are not present in the high-latitude Ulysses measurements. If these particle increases are due to solar particle events, one would conclude that either the particle transport perpendicular to the heliospheric magnetic field is small or that shocks related to CMEs have a small latitudinal extent.
In contrast, the observations at solar maximum are char-acterized by many increases in the 5–25 MeV range, which even pile up for several weeks in early 2001. In order to investigate such time periods, the evolution of the energy spectrum, as well as the composition are useful tools. At higher energies it is interesting to note that KET has ob-served nine events in the 125–250 MeV protons, with inten-sities more than two times the background. These events are listed in Table 3. Four of them are accompanied by an in-crease in the 250–2000 MeV range. In comparison to the Ulysses observations panel (D) displays the corresponding measurements at Earth by the University of Chicago’s instru-ment on board IMP. During this time period, from
Novem-10-4 10-3 10-2 10-1 1994.8 1995 1995.2 1995.4 1995.6 year count rate [ 1/s ] 2 1.5 1.5 2 -80 -70 -40 0 20 70 80 r [AU] θ[o] 10-4 10-3 10-2 10-1 2001 2001.25 2001.5 2001.75 year count rate [ 1/s ] 2 1.5 1.34 1.5 2 -80 -60 -40 -20 0 20 40 60 80 r [AU] θ[o] 10-3 10-2 10-1 1 10 1994.8 1995 1995.2 1995.4 1995.6 year count rate [ 1/s ] 2 1.5 1.5 2 -80 -70 -40 0 20 70 80 r [AU] θ[o] 10-3 10-2 10-1 1 10 2001 2001.25 2001.5 2001.75 year count rate [ 1/s ] 2.5 2 1.5 1.5 2 -80 -60 -40 -20 0 20 40 60 80 r [AU] θ[o]
(B)
(D)
(C)
Electrons: 2−12 MeV Electrons: 2−12 MeV(A)
Electons: 3−10 MeV 7−20 MeV15−30 MeV 20−50 MeV
QTI
QTI
Fig. 7. Daily averaged count rates of different Ulysses/KET electron channels in the energy range from 3 to ∼50 MeV during the first (A) and second (B) fast latitude scan. The lower two panels (C) and (D) display the corresponding electron measurements in the energy range from 2 MeV to ∼12 MeV at Earth by the IMP 8 satellite.
ber 2000 to October 2001, two Ground Level Events (GLEs) on 15 and 18 April have been observed at Earth (from http: //helios.izmiran.rssi.ru/cosray/main.htm\#lastGLEs). These two GLEs are seen in the >106 MeV protons at Earth as well. At Ulysses only the second event generated a signifi-cant increase in the 250 MeV to 2 GeV proton channel, in-dicating different geometries and/or propagation conditions during these two events. The KET observations suggests that the energy spectra of most of the solar particle events are soft. Therefore, it is important to compare Earth and Ulysses observations at the same energies. A simple inspection of panels (B) and (D) of Fig. 5 suggests that most of the im-portant particle increases are seen at Earth and Ulysses si-multaneously. In order to compare Ulysses and Earth ob-servations in detail, Fig. 6 displays the count rates of 75 to 95 MeV at Earth and the 69 to 125 MeV at Ulysses. Al-though the energies are not exactly the same, both time
pro-files are dominated by the same events. At solar maximum, there are only a few events that produce an increase at one spacecraft only. Since Ulysses is moving in heliographic lon-gitude, latitude and in radial distance, such a similarity has not been expected, indicating that particles are accelerated at high latitudes, too, or transported efficiently in latitude and longitude. Such a transport might be caused by stochastic perpendicular diffusion, or by a more complex geometry of the heliospheric magnetic field itself (see Fisk and Jokipii, 1999). In order to obtain the observed long lasting decay of the particle events, McKibben et al. (2001) suggested that particles might be stored in the inner heliosphere.
As pointed out by Dr¨oge (2000) electrons provide impor-tant information about the diffusion tensor at low rigidities. In panels (A) and (B) of Fig. 7 four different electron chan-nels from the KET are displayed. The black, red, green, and blue curves correspond to electrons with energies of about
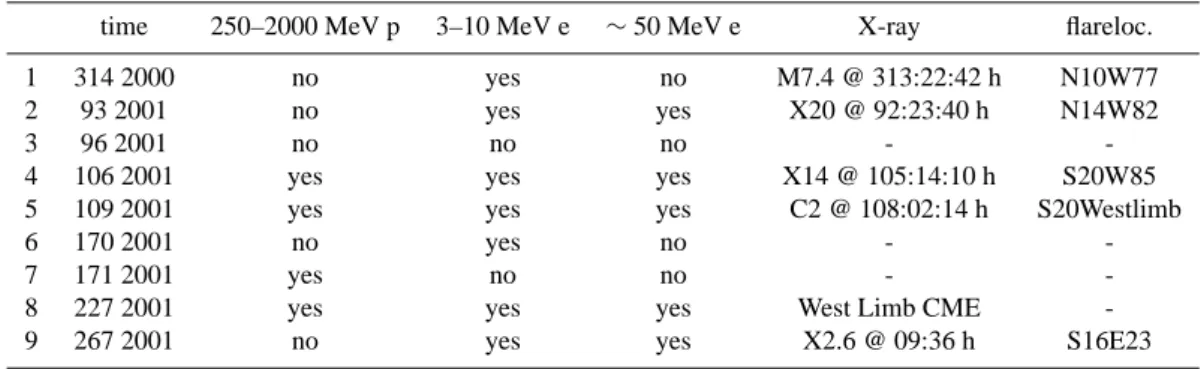
Table 3. List of major solar particle events observed by the KET on board Ulysses. Flare onset times and location taken from Dalla et al. (2002), and http://umbra.nascom.nasa.gov/SEP/seps.html
time 250–2000 MeV p 3–10 MeV e ∼50 MeV e X-ray flareloc.
1 314 2000 no yes no M7.4 @ 313:22:42 h N10W77
2 93 2001 no yes yes X20 @ 92:23:40 h N14W82
3 96 2001 no no no -
-4 106 2001 yes yes yes X14 @ 105:14:10 h S20W85
5 109 2001 yes yes yes C2 @ 108:02:14 h S20Westlimb
6 170 2001 no yes no -
-7 171 2001 yes no no -
-8 227 2001 yes yes yes West Limb CME
-9 267 2001 no yes yes X2.6 @ 09:36 h S16E23
3–10 MeV, 7–20 MeV, ∼30 MeV, and ∼50 MeV. As pointed out by Heber et al. (1999b) the latter two are dominated by a γ -ray background during solar minimum “quiet time” con-ditions, generated by the interaction of >250 MeV protons with the spacecraft material, leading to the same time pro-files as for galactic cosmic ray protons.
All events in Table 3 are accompanied by an increase in the count rate of 3–20 MeV electrons (panel (B) of Fig. 7). During six of these events, electrons have been accelerated up to energies of ∼50 MeV.
As for the protons all major events have been observed at both locations, with similar decay times. A detailed analysis of these solar particle events is beyond the scope of the paper; results have been summarized by McKibben et al. (2003). 3.2 Latitudinal distribution of galactic cosmic rays In the left and right panels of Fig. 8 the daily averaged count rates of >125 MeV protons at Ulysses (red curve) and >106 MeV protons at Earth (black curve) are displayed. A latitudinal gradient of ∼0.3%/degree has been observed around solar minimum (Heber et al., 1996a,b). We interpret the background during the second fast latitude scan as being due to galactic cosmic rays. Note the slight increase in the in-tensity corresponding to a gradual recovery after the preced-ing solar maximum (see also the behavior of the NM data in Fig. 2). In order to correct the data for Ulysses’ position, ra-dial gradients Gr of 2.2%/AU and 3.5%/AU have been used
(Heber et al., 2002a). Since the black and red curves track each other well in 2001, we can conclude that galactic cos-mic ray protons have a spherically symmetric distribution in the inner heliosphere at solar maximum. However, such a vanishing of latitudinal gradients cannot be interpreted as the disappearance of drift effects in modulation only, because an increase in the diffusion coefficient in the polar direc-tion would also lead to a reducdirec-tion of the latitudinal gradi-ent (see discussion in Potgieter, 1997). In comparison, in the 1994/1995 period cosmic ray electrons did not show any significant latitudinal gradient, whereas a proton latitudinal gradient clearly existed (Ferrando et al., 1996; Heber et al., 1999b). The presence of drift effects at this time is confirmed by a variation of the e/p-ratio, as predicted by modulation
models including drifts (Heber et al., 1999b), showing how important it is to analyze particles with opposite charge signs simultaneously.
3.3 The time profile of the electron to proton ratio
The temporal variation of the electron to proton ratio for a lo-cation at 1 AU near the heliographic equator can be derived from the Ulysses data (Heber et al., 2002a). For this purpose, the influence of radial and latitudinal variations has to be con-sidered. With respect to the first point it can be assumed that at a given time the radial gradients of 2.5 GV electrons and protons are approximately the same (Clem et al., 2002). In Heber et al. (2002a) we have shown that
1. for the construction of the “heliographic equator equiv-alent” of the e/p-ratio only the latitudinal variation of the protons has to be considered,
2. the latitudinal gradients of the integral and the differen-tial channels are practically the same, which is consis-tent with the general finding that the latitudinal proton gradient shows only a small variation with rigidity in the several GV rigidity range (Burger et al., 2000). Therefore, we will use the proton spatial gradients that have been derived by Heber et al. (2002a), to construct the “helio-graphic equator equivalent” for the 2.5 GV protons through-out the time period 1990 to mid 2002.
The lowest panel of Fig. 9 displays the maximum latitudi-nal extent of the heliospheric current sheet α shifted by 5 so-lar rotations to later times (http://quake.stanford.edu/∼wso/).
The time shift takes into account that variations in the shape of the current sheet first have to be carried radially outwards with the solar wind until a new regime is established and the cosmic rays are modulated accordingly. Periods (A) and (B) mark the time of the solar minimum and maximum fast lat-itude scans. In the upper and middle panels one can see the directly measured (Ulysses) and the “heliographic equator equivalent” e/p-ratios. The curves in these two panels devi-ate from each other only during the time intervals which are drawn in green in the middle panel. During all other periods,
0.1 0.2 0.3 0.4 0.5 1994.8 1995 1995.2 1995.4 1995.6 year count rate [ 1/s ] 2 1.5 1.5 2 -80 -70 -40 0 20 70 80 r [AU] θ[o] 0.1 0.2 0.3 0.4 0.5 2001 2001.25 2001.5 2001.75 year count rate [ 1/s ] 2 1.5 1.34 1.5 2 -80 -60 -40 -20 0 20 40 60 80 r [AU] θ[o] KET: >125 MeV p KET: >125 MeV p IMP: >106 MeV p IMP: >106 MeV p
Fig. 8. Daily averaged time profile of >106 MeV and >125 MeV protons at Earth and Ulysses for the first and second latitude scan.
0.8
1
1.2
1.4
1.6
1.8
A Be/p
0.8
1
1.2
1.4
1.6
1.8
e/p
cor A B50
Year
α
[
o]
1990 1992 1994 1996 1998 2000 2002 3 5 3.5 2 2 3.5 5 4 2.5 1.5 -5 -25 -50 -70 70 30 -5 -25 -45-70 60 r [AU] θ[o]Fig. 9. From top to bottom: Measured 26-day averaged 2.5 GV
e/p-ratio from launch to mid 2002 along the Ulysses orbit. The
second panel displays the “heliographic equator equivalent” e/p-ratios as described in the text. Periods “A” and “B” mark the time period of the minimum and maximum fast latitude scans. The low-est panel shows the evolution of the maximum latitudinal extent of the heliospheric current sheet α shifted by 5 solar rotations to later
times (http://quake.stanford.edu/∼wso/). Ulysses’ distance to the
Sun and its heliographic latitude are shown at the top.
the curves are practically identical, either due to the small lat-itudinal separation between Ulysses and IMP (before April 1993 and from 1997 to 1999), or due to the negligible proton latitudinal gradient from 2000 onwards (Heber et al., 2002a). Although the ratio e/p = 1 is reached only during short
peri-ods of time, it ought to be representative for a medium range of tilt angles around 40◦–50◦, where the slope of the intensity vs. tilt angle variation is roughly the same for both particle types (see Burger and Potgieter, 1999). The structures in the
e/p-ratio can be characterized as follows. The 3-shape dur-ing the period (A) seen in the e/p-ratio measured along the Ulysses orbit (upper panel) is not found in the “heliographic equator equivalent” (middle panel). The relatively constant value (Ferrando et al., 1996) from mid 1993 to the end of 1994 has been replaced by a continuous increase. The e/p-ratio lies systematically above unity for a time period around solar minimum between about mid 1995 and mid 1998. Dur-ing this time, α is below a value near 15◦, as indicated in the bottom panel. The increase in the e/p-ratios during the oc-currence of low tilt angles near solar minimum periods was found by Heber et al. (1999b,c) and has been extensively dis-cussed there. An increase in the e/p-ratio with the transition to solar maximum conditions commences around mid 1999. The e/p-ratios are roughly the same in 1990/1991 and from 2000 to 2002, both representing periods of solar maximum, indicating that charge sign dependent modulation is small.
3.4 MeV electrons
Not only are the count rate time profiles of MeV electrons due to solar activity very different during the first and sec-ond fast latitude scans (see Fig. 7), but also the variations of the background intensities differ. Between 1 and 10 AU different sources contribute to the few-MeV electron inten-sities. Among them the most important are solar, Jovian and galactic electrons. In the 1970s McDonald et al. (1972) and L’Heureux et al. (1972) reported on the observation of “quiet time” electron increases. Such “quiet time” electron increases are not accompanied by an increase in the proton intensity and are characterized by a hard energy spectrum. In order to distinguish them from solar electrons, these two cri-teria have been used by Heber et al. (2002a), who recently
(A)
(B)
(C)
(D)
(E)
(F)
May 1994
July 1995
Dec. 1994
July 2000
Jan. 2001
Sep. 2001
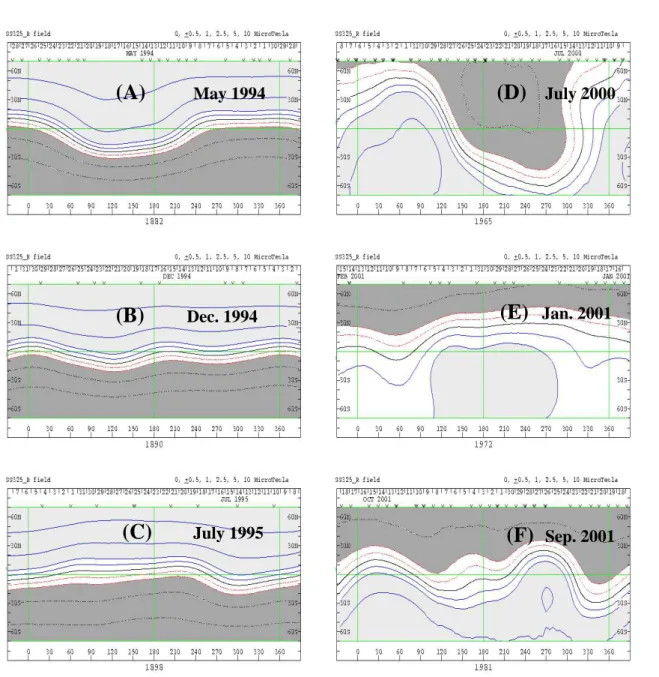
Fig. 10. Configuration of the solar magnetic field as calculated by Hoeksema for a source surface at 3.25 solar radii for the first (left) and second (right) fast latitude scan.
reported the discovery of “quiet time” increases in the 3– 10 MeV electron intensities at polar latitudes. The intensity increased by a factor greater than 2 without any variation in the 38 to 69 MeV proton channel. By comparing Figs. 5 and 7 it is evident that during the two time periods in early and mid 2001, marked by QTI, such “quiet time” increases oc-curred at Ulysses. At those times the spacecraft had been between ∼30◦and ∼60◦. If these electrons are of Jovian ori-gin, as suggested by Heber et al. (2002b), then our measure-ments indicate again an easy transport of energetic particles to high heliographic latitudes. Note that such variations were not present during the first fast latitude scan at Ulysses (see panel (A) in Fig. 7), when the spacecraft was embedded in the fast solar wind emanating from the coronal holes. In con-trast, such variations were obviously present in 1994/1995 at
Earth, which was located in the steamer belt region. Thus, the particle transport in the inner heliosphere is very differ-ent at solar minimum, with coexisting differdiffer-ent solar wind regimes. In this context it is interesting to note that Heber et al. (1998) found only significant latitudinal gradients at solar minimum when Ulysses was embedded in the fast solar wind stream.
4 Discussion and conclusion
During the solar maximum fast latitude scan, we found that 1. solar particle events and “quiet time”-electron increases
are observed at all latitudes, indicating an effective lati-tudinal particle transport,
2. the galactic cosmic ray distribution is nearly spherically symmetric close to solar maximum from 2000 to mid 2001. Unfortunately, in 2002, no appropriate 1 AU data are available, yet,
3. the e/p-ratios are approximately the same at solar max-imum in 1990 and 2000,
4. from 1991 the e/p-ratio is first decreasing until 1993 and then increasing, reaching a relative maximum value in 1997, near solar minimum. After that the e/p-ratio decreases again until early 1999, increases thereafter, and is constant in 2002.
As discussed before, it is evident from the second panel of Fig. 9 that the observed e/p-ratio profile can be described qualitatively by solving Parker’s transport equation numer-ically (Burger and Potgieter, 1999). However, the polarity of the heliospheric magnetic field is also important to un-derstand the time profile of galactic cosmic rays during the 22-year solar magnetic cycle: in an A < 0 epoch (the he-liospheric magnetic field is pointing inward in the Northern Hemisphere), the time profile of positively charged particles is peaked, whereas it is more or less flat in an A > 0 solar magnetic epoch.
The solar and the heliospheric magnetic field reverses ev-ery 11 years around solar maximum. With the reversal of the heliospheric magnetic field and the decrease in the tilt angle, an increase in the e/p-ratio is expected. Of special interest is the transition from an A > 0 to an A < 0 solar magnetic epoch. Close to solar maximum conditions, i.e. for large “tilt angles”, the drift effect is expected to vanish pro-gressively. An indication for small or no drift effects around solar maximum is that the e/p-ratio converges to the same value regardless of the polarity of the heliospheric magnetic field. Later when the new polarity has established itself in the heliosphere, drifts are expected to become more impor-tant, and the e/p-ratio is expected to vary accordingly. In order to search for drift effects at solar maximum, the inter-pretation of the charge sign dependent galactic cosmic ray time profiles has to take into account the complex helio-spheric magnetic field. In order to investigate the fast lat-itude scans in more detail Fig. 10 displays six source sur-face maps (from http://quake.stanford.edu/∼wso/) calculated
by using the newer, probably more accurate model, which assumes a radial boundary condition at the photosphere, and a higher source surface radius (3.25 solar radii). The surface maps (A) in May 1994, (B) in December 1994, and (C) in July 1995 show the solar magnetic field configuration close to the A > 0 solar minimum magnetic epoch during the time period of the first fast latitude scan. The black line separat-ing the light gray (outward polarity) and dark gray (inward polarity) areas corresponds to the heliospheric current sheet. Obviously, the magnetic field was well organized, with a cur-rent sheet having only a small inclination α. In contrast, panels (D) in July 2000, (E) in January 2001, and (F) in September 2001 display these maps during the time period of the second fast latitude scan. Obviously, the solar
mag-netic source field is much more complex and has reversed its polarity. It is important to note that the magnetic field instruments on Ulysses have not measured an outward point-ing field polarity in the Southern Hemisphere in November 2000, but found the inward polarity over the northern polar cap (Smith et al., 2001). The solar wind itself is indistin-guishable from slow solar wind in the Southern Hemisphere, but showed the characteristic of the fast solar wind in the Northern Hemisphere from day 240 to 340 of the year 2001 (McComas et al., 2001a,b). The fact that the polarity mea-sured by Ulysses during the south polar pass is not the same as that of the solar magnetic field can be explained, when one remembers that the source surface maps have been calculated from the measured photospheric magnetic field. Although the photospheric field might be reversed, it could happen that these fields do not merge with open field lines, so that the heliospheric magnetic field might not be extrapolated from these source surface maps (Smith et al., 2001). A good in-dicator for open field lines at polar latitudes is the existence of polar coronal holes. Figure 11 displays coronal hole maps obtained from ftp://ftp.noao.edu/kpvt/synoptic/choles. Note the different latitude scales when comparing the source sur-face with the coronal hole maps. In 1994/1995 the two polar coronal holes are stable features, and extensions of coronal holes are reflected in the corresponding source surface maps. In contrast to solar minimum, no southern polar coronal hole can be found in panels (D) to (F); a stable northern coronal hole is developing during the Ulysses fast latitude scan. Un-der the assumption that it takes several solar rotations until such a new configuration has been established in the inner he-liosphere, the lack of latitudinal gradients and the time profile of the e/p-ratio can be explained when assuming diffusion-dominated modulation. After the second fast latitude scan, in the period from mid 2001 to mid 2002, no changes in the
e/p-ratio were observed. This is in agreement with the latest available coronal hole map (March 2002), where the southern polar coronal hole is still missing. If one would argue that the transition from the A > 0 to the A < 0-solar magnetic epoch is completed when the southern coronal hole re-appears, then we predict the e/p-ratio to increase, and negative and posi-tive latitudinal gradients to appear a few rotations thereafter.
5 Summary
In this paper we used KET 5 MeV/n to 2 GeV/n proton and helium observations and 3 MeV to 2.5 GeV electron obser-vations in different energy windows, to investigate the 3-dimensional distribution of cosmic rays during the Ulysses solar maximum fast latitude scan. In order to interpret these observations, a comparison with Ulysses’ solar minimum fast latitude scan has been performed. University of Chicago IMP 8 measurements have been used to distinguish between temporal and spatial effects. The results can be grouped into three topics, all of which support the conclusion that ener-getic particles are more easily transported in latitude at solar maximum than at solar minimum:
(B)
(C)
(F)
(E)
(D)
(A)
July 2000 Sep. 2001 Jan. 2001 May 1994 Dec. 1994 July 1995Fig. 11. Coronal holes by Carrington rotation number as inferred from 1083 nm He I observations made at Kitt Peak for the first (left) and second (right) fast latitude scan.
1. Solar particle events have been observed independent of latitude, with nine, four and five events producing 125– 250 MeV, 0.25–2 GeV protons and ∼50 MeV electrons, respectively. In contrast to solar minimum the time pro-files at Earth and Ulysses are similar, indicating that par-ticles are either accelerated over a broad latitude range or transported efficiently in latitude.
2. The “quiet time” background of 3 to 10 MeV electrons – with no solar particle events observed in the 38 to 68 MeV proton channel – shows short-term increases by a factor of two or more. Due to the missing protons and the hard energy spectra, these increases are not of solar origin (Heber et al., 2002b). Such variations were not present at solar minimum. If these particles are from
Jupiter, as suggested by Heber et al. (2002b), then an ef-ficient latitudinal transport must exist.
3. The background in the >106 MeV proton channels con-sists of galactic cosmic rays, which show, in contrast to solar minimum, the same time profiles at Earth and Ulysses, when correcting Ulysses for a radial gradient of 3.5%/AU. Hence there is no latitudinal gradient of galactic cosmic ray protons at solar maximum. If the vanishing latitudinal gradients are not caused by van-ishing drifts, then a more efficient latitudinal transport has to cancel drift-generated gradients.
The importance of drifts around solar maximum has also been investigated by analyzing the time profile of the electron to proton ratio. From the KET measurements it is evident
that the electron and proton time profiles are dominated by diffusive processes (see Heber et al., 2002a). Between mid 2001 and mid 2002 the e/p-ratio remained approximately constant. This is despite the fact that the solar magnetic field had reversed, as indicated by the solar surface maps, and the tilt angle is decreasing. However, the reversed polarity has been only verified by Ulysses for the Northern Hemisphere, indicating that the reversed solar magnetic field is not con-nected to heliospheric field lines in the Southern Hemisphere. A good indicator for open field lines is the existence of polar coronal holes. In agreement with the Ulysses’ observations, a polar coronal hole is only present in the northern cap. If the assumption is correct that the southern solar polarity will be carried out into the heliosphere once the southern polar coronal hole has been developed, then we should measure an increase in the e/p-ratio in correlation with the develop-ing southern polar coronal hole. One should also expect a very small latitudinal gradient for the 2.5 GV protons dur-ing the fully developed A < 0 epoch, based on the varia-tion of drift effects with the product qA (see the discussion in Sect. 3). Unfortunately, Ulysses is at ∼30◦N of the he-liographic equator and heading towards the equator, so that the appearance of latitudinal gradients in either the electrons or the protons might not be measurable. However, with the launch of Pamela (Spillantini, 2001), it will be possible to measure for the first time the latitudinal gradients of elec-trons and protons in the inner heliosphere during Ulysses’ fast latitude scan in 2006/2007.
Acknowledgements. We are grateful to the Deutsche
Forschungs-gemeinschaft and the South African National Research Foundation for financial support. The ULYSSES/KET project is supported un-der grant No. 50 ON 9103 by the German Bundesminister f¨ur Bil-dung und Forschung (BMBF) through the Deutsches Zentrum f¨ur Luft- und Raumfahrt (DLR). Coronal hole maps were prepared by Karen Harvey and Frank Recely at National Solar Observatory/Kitt Peak.
Topical Editor R. Forsyth two referees for their help in evaluat-ing this paper.
References
Burger, R. and Hattingh, M.: Steady-state drift dominated modula-tion models for galactic cosmic rays, Astrophys. and Space Sci., 230, 375–382, 1995.
Burger, R. A. and Potgieter, M. S.: The effect of large heliospheric current sheet tilt angles in numerical modulation models: A the-oretical assessment, in Proc. 26th International Cosmic Ray Con-ference, 7, pp. 13–16, 1999.
Burger, R. A., Potgieter, M. S., and Heber, B.: Rigidity depen-dence of cosmic ray proton latitudinal gradients measured by the Ulysses spacecraft: Implications for the diffusion tensor, J. Geo-phys. Res., 105, 27 447–27 456, 2000.
Clem, J., Evenson, P., and Heber, B.: Cosmic Electron Gra-dients in the Inner Heliosphere, Geophys. Res. Lett., 29, doi:10.1029/2002GL015,532, 2002.
Cummings, A. C., Stone, E. C., and Webber, W. R.: Latitudinal and radial gradients of anomalous and galactic cosmic rays in the outer heliosphere, Geophys. Res. Lett., 14, 174–177, 1987.
Dalla, S., Balogh, A., Heber, B., Krucker, S., and Mueller-Mellin, R.: Characterization of SEP events at high heliographic latitudes, in: Proc. solar wind conference, submitted, 2002.
Dr¨oge, W.: The Rigidity Dependence of Solar Particle Scattering Mean Free Paths, Astrophys. J., 537, 1073–1079, 2000. Evenson, P.: Cosmic Ray Electrons, Spac. Sci. Rev., 83, 63–73,
1998.
Ferrando, P., Raviart, A., and Haasbroek, L. J., et al.: Latitude vari-ations of ∼7 MeV and > 300 MeV cosmic ray electron fluxes in the heliosphere: ULYSSES COSPIN/KET results and implica-tions, Astron. Astrophys., 316, 528–537, 1996.
Fisk, L. A. and Jokipii, J. R.: Mechanisms for Latitudinal Transport of Energetic Particles in the Heliosphere, Spac. Sci. Rev., 89, 115–125, 1999.
Heber, B.: Modulation of galactic and anomalous cosmic rays in the inner heliosphere, Adv. Space Res., 27, 451–460, 2001. Heber, B., Dr¨oge, W., Kunow, H., M¨uller-Mellin, R., Wibberenz,
G., Ferrando, P., Raviart, A., and Paizis, C.: Spatial variation of
>106 MeV proton fluxes observed during the Ulysses rapid
lat-itude scan: Ulysses COSPIN/KET results, Geophys. Res. Lett., 23, 1513–1516, 1996a.
Heber, B., Raviart, A., Ferrando, P., Sierks, H., Paizis, C., Kunow, H., M¨uller-Mellin, R., Bothmer, V., and Posner, A.: Determi-nation of 7–30 MeV electron intensities: Ulysses COSPIN/KET results, in Proc. 16th International Cosmic Ray Conference, Salt Lake City, Utah, USA, 17–25 August, 1999, 7, p. 186, 1999a. Heber, B., Ferrando, P., Raviart, A., Paizis, C., M¨uller-Mellin, R.,
Kunow, H., Potgieter, M. S., Ferreira, S., and Fichtner, H.: On the determination of the γ -ray contribution in the 3–10 MeV KET electron channel along the Ulysses trajectory., in Proc. 27th ICRC, 2255, 2001.
Heber, B., Dr¨oge, W., Ferrando, P., et al.: Spatial variation of > 40 MeV/n nuclei fluxes observed during Ulysses rapid latitude scan, Astron. Astrophys., 316, 538–546, 1996b.
Heber, B., Bothmer, V., Dr¨oge, W., et al.: Latitudinal distribu-tion of >106 MeV protons and its reladistribu-tion to the ambient so-lar wind in the inner southern and northern heliosphere: Ulysses COSPIN/KET Results, J. Geophys. Res., 103, 4809–4816, 1998. Heber, B., Ferrando, P., Raviart, A., et al.: Differences in the tem-poral variation of galactic cosmic ray electrons and protons: Im-plications from Ulysses at solar minimum, Geophys. Res. Lett., 26, 2133–2136, 1999b.
Heber, B., Raviart, A., Ferrando, P., et al.: Charge sign dependent modulation: Ulysses COSPIN/KET results, in Proc. 26th Inter-national Cosmic Ray Conference, 7, pp. 99–102, 1999c.
Heber, B., Wibberenz, G., Potgieter, M. S., et al.: Ulysses
COSPIN/KET observations: Charge sign dependence and spa-tial gradients during the 1990–2000 A > 0 solar magnetic cycle, J. Geophys. Res., 107, doi:10.1029/2001JA000,329, 2002a. Heber, B., Ferrando, P., Raviart, A., et al.: 3–20 MeV electrons
in the inner three-dimensional heliosphere at solar maximum: Ulysses COSPIN/KET observations., Astrophys. J., 579, 888– 894, 2002b.
Jokipii, J. R. and Wibberenz, G.: Epilogue: Cosmic rays in the active heliosphere, Spac. Sci. Rev., 83, 365–368, 1998.
Jokipii, J. R., Levy, E. H., and Hubbard, W. B.: Effects of particle drift on cosmic ray transport, I. General properties, application to solar modulation, Astrophys. J., 213, 861–868, 1977. L’Heureux, J., Fan, C., and Meyer, P.: The quiet-time spectra of
cosmic-ray electrons of energies between 10 & 200 MeV ob-served on OGO-5, Astrophys. J., pp. 363–372, 1972.
Sk-oug, R. M., Goldstein, B. E., and Neugebauer, M.: The solar wind’s return to a simple three-dimensional structure: Ulysses’ second fast-latitude scan, in American Geophysical Union, Fall Meeting 2001, abstract #SH42C-03, p. C3, 2001a.
McComas, D. J., Goldstein, R., Gosling, J. T., and Skoug, R. M.: Ulysses second orbit: Remarkably different solar wind, Spac. Sci. Rev., 97, 99–103, 2001b.
McDonald, F. B., Cline, T. L., and Simnett, G. M.: Multivarious temporal variations of low-energy relativistic cosmic-ray elec-trons, J. Geophys. Res., 77, 2213–2231, 1972.
McKibben, R. B., Connell, J. J., and Lopate, C., et al.: ULYSSES/COSPIN observations of the energy and charge de-pendence of the propagation of solar energetic particles to the Sun’s south polar regions, in Proc. 27th ICRC, 3281, 2001. McKibben, R. B., Connell, J. J., and Zhang, M., et al.: Ulysses
COSPIN Observations of Cosmic Rays and Solar Energetic Par-ticles from the South Pole to the North Pole of the Sun during Solar Maximum, Ann. Geophysicae, this issue, 2003.
McKibben, R. B., Connell, J. J., Lopate, C., Simpson, J. A., and Zhang, M.: Observations of galactic cosmic rays and the anoma-lous helium during the Ulysses passage from the south pole to the north pole, Astron. Astrophys., 316, 547–554, 1996. Potgieter, M.: The heliospheric modulation of galactic cosmic rays
at solar minimum, Adv. Space Res., 19, 883–892, 1997. Potgieter, M., Haasbroek, L., Ferrando, P., and Heber, B.: The
mod-eling of the latitude dependence of cosmic ray protons and
elec-trons in the inner heliosphere, Adv. Space Res., 19, 917–920, 1997.
Potgieter, M., Ferreira, S. E. S., and Burger, R. A.: Cosmic Ray Modulation from Solar Minumum to Maximum: A Theoretical Perspective, Spac. Sci. Rev., 97, 295–307, 2001.
Potgieter, M. S. and Moraal, H.: A drift model for the modulation of galactic cosmic rays, Astrophys. J., 294, 425–440, 1985.
Rastoin, C.: Les ´electrons de Jupiter et de la Galaxie dans
l’heliosphere d’apres l’experience KET a bord de la sonde spa-tiale ULYSSE, Ph.D. thesis, Saclay, 1995.
Sanderson, T. R., Lario, D., Maksimovic, M., Marsden, R. G., Tran-quille, C., Balogh, A., Forsyth, R. J., and Goldstein, B. E.: Cur-rent sheet control of recurCur-rent particle increases at 4–5 AU, Geo-phys. Res. Lett., 26, 1785, 1999.
Simpson, J., Anglin, J. D., Balogh, A., et al.: The Ulysses
Cosmic-Ray and Solar Particle Investigation, Astron. and Astro-phys. Suppl., 92, 365–399, 1992.
Smith, E. J., Balogh, A., Forsyth, R. J., and McComas, D. J.: Ulysses in the south polar cap at solar maximum: Heliospheric magnetic field, Geophys. Res. Lett., 28, 4159, 2001.
Spillantini, P. E. A.: The Pamela experiment, in Proc. 27th ICRC, 2215, 2001.
Wibberenz, G., Richardson, I. G., and Cane, H. V.: A simple concept for modeling cosmic ray modulation in the inner he-liosphere during solar cycles 20–23, J. Geophys. Res., 107, doi:10.1029/2002JA009,461, 2002.