HAL Id: hal-00172631
https://hal.archives-ouvertes.fr/hal-00172631
Submitted on 17 Sep 2007HAL is a multi-disciplinary open access archive for the deposit and dissemination of sci-entific research documents, whether they are pub-lished or not. The documents may come from teaching and research institutions in France or abroad, or from public or private research centers.
L’archive ouverte pluridisciplinaire HAL, est destinée au dépôt et à la diffusion de documents scientifiques de niveau recherche, publiés ou non, émanant des établissements d’enseignement et de recherche français ou étrangers, des laboratoires publics ou privés.
Understanding mudslides through micro-seismic
monitoring: The Super-Sauze (South French Alps) case
study.
David Amitrano, Stéphane Gaffet, Jean-Philippe Malet, Olivier Maquaire
To cite this version:
David Amitrano, Stéphane Gaffet, Jean-Philippe Malet, Olivier Maquaire. Understanding mudslides through micro-seismic monitoring: The Super-Sauze (South French Alps) case study.. Bulletin de la Société Géologique de France, Société géologique de France, 2007, 178 (2), pp.149-157. �hal-00172631�
Understanding mudslides through micro-seismic monitoring: The
Super-Sauze (South French Alps) case study.
Amitrano, D. 1,*, Gaffet, S. 2, Malet, J.-P. 3, Maquaire, O. 4
1. LIRIGM-LGIT, Université Joseph Fourrier, Maison des Géosciences, 1381 rue de la Piscine, BP53, F-38041 Grenoble Cedex 9, France.
2. UMR 6526 CNRS, Geosciences Azur, 250 rue Albert Einstein, Sophia Antipolis, F-06560 Valbonne, France.
3. Faculty of Geosciences, UCEL, University of Utrecht, Heidelberglaan 2, Po.Box 80.115, 3508 TC Utrecht, Netherlands.
4. UMR 6554 CNRS, LETG-GEOPHEN, Université de Caen Basse-Normandie, Esplanade de la Paix, F-14032, Caen Cedex, France.
*. Corresponding author: david.amitrano@ujf-grenoble.fr
Abstract :
The macroscopic deformation of rocks, at scales ranging from laboratory samples (cm) to rock hillslopes and earth crust (hm to km), is associated with local irreversible processes (cracks/faults propagation and shearing). These movements involve propagation of acoustic wave’s which can be observed by remote sensing. Seismic monitoring during strain progression can help our understanding of rock behaviour and lead to the recognition of failure precursors. Although of significant potential, this observational tool has had only limited application in the study of gravitational instabilities such as landslides.
This paper presents seismic monitoring data acquired on a mudslide located in the South French Alps. Results show that recordable seismicity exists in the frequency range of 0.01 Hz to 10 Hz associated with landslide deformation. Acceleration of landslide movement is controlled by rainfall and appears to be well correlated with seismic activity. The origin of the seismicity is attributed to shearing of the moving mass at the interface with the in-situ stable bedrock. Spectral analysis of the seismic wave reveals that the range 0.1-1 Hz is the most sensitive to the variations in landslide velocity.
The results emphasize the strong potential of seismic monitoring for improving our understanding of mechanisms controlling rock mass deformation and gravitational instability. The determination of operational failure precursors based on seismic monitoring has yet to be achieved but remains a major target of future research.
Keywords: landslide, seismic monitoring, displacement rate, South French Alps
Résumé :
La déformation des roches, de l’échelle de l’échantillon de laboratoire (cm) à celle de versants rocheux ou de la croûte terrestre (hm- km) est associée à des processus irréversibles locaux (propagation et cisaillement de fissure/faille). Ces mouvements induisent la propagation d’une onde acoustique qui peut être observé par des capteurs distants de la source. La surveillance sismique au cours de la déformation peut permettre de mieux comprendre le comportement des roches et conduire ainsi à l’identification de précurseur de la rupture. Malgré son fort potentiel, cette technique a jusqu’ici été peu utilisée pour l’étude et la compréhension des instabilités de versants de cette technique.
Le travail exposé ici présente des données acquises sur un glissement de terrain argileux situé dans le Sud des Alpes françaises. Les résultats montrent qu’une sismicité enregistrable existe dans la gamme de fréquence de 0.01 Hz à 10 Hz et qu’elle est associée à la déformation du versant. Les variations de la vitesse de déformation du versant sont contrôlées par la
pluviométrie et sont bien corrélées à l’activité sismique. L’origine de cette sismicité peut être attribuée au cisaillement de la masse en mouvement sur le sous-bassement rocheux stable. L’analyse spectrale des ondes sismiques montre que la gamme de fréquence 0.1-1 Hz est la plus sensible aux variations de vitesse du glissement.
Ces résultats montrent le fort potentiel de la surveillance sismique pour l’amélioration de la compréhension des mécanismes de déformation et de rupture des instabilités gravitaires. La détermination de précurseurs de la rupture opérationnels basés sur la surveillance sismique n’est pas réalisable pour l’instant mais reste un objectif majeur pour de futures recherches.
Mots-clés: Instabilité gravitaire, surveillance sismique, vitesse de déformation, Alpes
françaises du sud
1 Introduction
To understand the failure processes and to search for precursory patterns to failure, the microseismicity tool has been extensively used at laboratory rock sample scale (acoustic emission- AE) (for a review on AE see Lockner, 1993) and at an intermediate scale between the laboratory scale and the large tectonic earthquake for studies of seismicity and rockburst in mines or tunnels (e.g. Obert 1977; Nicholson, 1992). A few application of micro-seismic monitoring for slope stability are related either to open mines, quarries or volcano flanks [e.g. Hardy and Kimble, 1991; Kennedy and Niermeyer, 1971]. Concerning natural slope instabilities, some rare experiments have been carried out mainly in rocky cliffs (Kolesnikov et al, 2003, Amitrano et al, 2004; Willenberg et al. 2004, Eberhardt et al, 2004, Amitrano et al. 2005). The seismic sources are generated by the crack propagation and shearing within the rock mass. Thus the seismic activity may be related to the an-elastic deformation of the rock mass. These last studies have shown that seismic monitoring is able to give interesting insight on gravitational instability and in some case to provide failure precursory patterns (Amitrano et al, 2005) useful for failure forecasting and hazard assessment. To our knowledge, this technique has never been used for investigating the behaviour of instabilities developed in soft mudrocks.
The micro-seismic monitoring technics has also been used for the monitoring and the warning of debris flows (e.g. Arratano, 1999, Itakura et al, 2005). In this last case, the amplitude of seismic noise appears to be correlated to the volume and velocity of the debris flow and can be used to trigger an alarm or a video recording (Lavigne et al., 2000).
For slope instabilities developed in soft materials and deforming slowly (such as mudslides), the high attenuation of the material generally avoids the use of micro-seismic monitoring. Some authors have surpassed this difficulty by using passive or active waveguides (Dixon et al, 1996; Kousteni et al, 1999; Dixon et al, 2003; Dixon et al, 2004). The passive waveguide is used to provide a shorter path for transmitting the elastic waves directly to the sensor, whereas the active waveguide generates AE signal by deforming itself within the moving masse (as the principle of inclinometers).
The objective of this paper is to present first results of an experiment of broadband seismic monitoring at the Super-Sauze mudslide. The experiment was initially designed to define the best suitable monitoring method able to detect landslide displacement in a frequency range
overlapping the low frequency measurements already performed by GPS, geodetic and strain instruments. A multi-parameters dataset has been acquired on the site by installing a sensitive broadband seismometer in complex and difficult field conditions; the data acquisition system and its configuration were designed to identify the seismic signatures of both the triggering of failures (rock block slides) in the stable mudrock hillslopes and the friction of the active mudslide on shear surfaces. Unfortunately, an anonymous visitor manipulation of the seismometer broke two of its components 14 days after the start of the experiment. Thus compared to the dataset expected, only partial results are shown hereafter.
2 The Super-Sauze mudslide: geomorphology, geotechnics and kinematics
The studied landslide is the continuously active mudslide of Super-Sauze developed in the black marls of the South French Alps. This mudslide was selected for the study for its representativeness of slope instabilities observed in Callovian-Oxfordian black marls, and because it has been monitored for nearly 10 years (Malet and Maquaire, 2003).
The landslide is the result of a large failure in which several structural rock block slides transform into a slow-moving mudslide progressing downslope in a stream channel. Upslope, the main scarp, inclined at approximately 70°, is cut in moraine deposits and in-situ black marls (Fig. 1a). Once failed the rock blocks are progressively disintegrated by weathering; a tongue-like morphology develops. A terminal lobe dominates the lowermost part of the mudslide (Fig. 1a) which is bordered by two lateral streams. The mudslide extents over a horizontal distance of 850 m and occurs between an elevation of 2105 m and 1740 m with an average 25° slope. The total volume is estimated at 750,000 m3.
The mudslide dynamics may result from sliding and flowing, either singly or in combination (Malet et al., 2005) and is influenced by bedrock geometry, rock mass fabric, and hydrology (Malet and Maquaire, 2003). Morphological features induced by the sliding and flowing mode of the mudslide are easily recognisable. The contact between the active mudslide and the stable hillslopes comprises a shearing zone of a few meters width characterized by tension cracks (Fig. 1b). Shear surfaces show scratches in the direction of the movement (Fig. 1c) as can be observed on an in-situ and stable crest in the central part of the mudslide. Finally, compression levees are locally distinguishable (Fig. 1d).
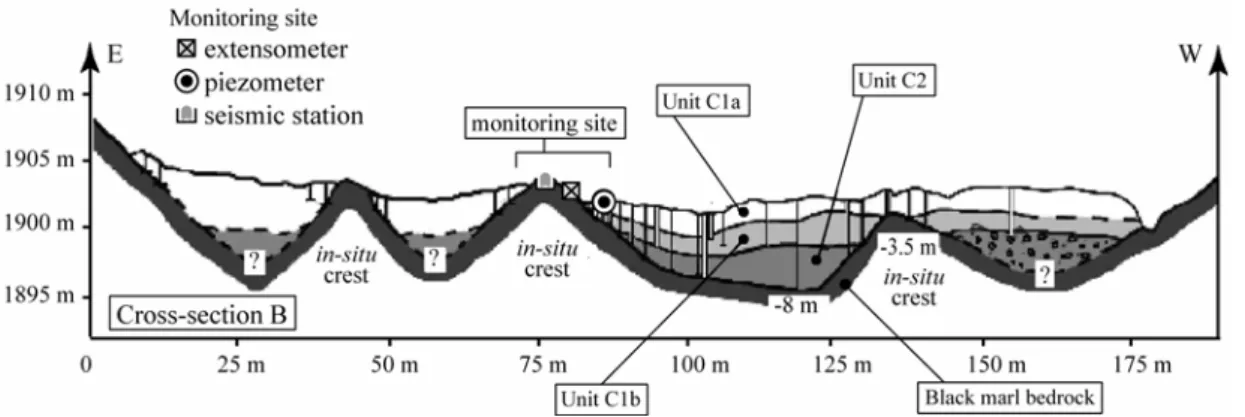
Geotechnical investigations and geophysical prospecting (Maquaire et al., 2001; Grandjean et al., 2006; this issue; Méric et al., this issue) indicate that the mudslide buries an topography of several parallel crests and gullies, as can for instance be observed on cross-section B in the most active part (Fig. 2). The mudslide comprises two vertical units. From a hydrological viewpoint, the first unit (which may be subdivided in layer C1a and layer C1b according to geotechnical and hydrological characteristics) is a semi-permeable material of 5 to 10 m thick, while the second unit (C2, with a maximum thickness of 10 m) is a stiff and impervious material (Malet and Maquaire, 2003). Both materials involve low plasticity intensely fissured reworked marl with a sandy-silt texture (clay content ranging between 16 and 26%; plasticity index ranging between 11 and 19%). Peak strength parameters determined on ‘undisturbed samples’ show cohesion values ranging from to 16 to 37 kPa and friction angle values from 32 to 36° (Malet, 2003). The residual shear strength was measured by ring shear tests on reconstituted specimens providing a residual friction angle of 19 to 21° (Malet, 2003; Maquaire et al., 2003). This value is in accordance with the operative friction angle calculated along a longitudinal cross-section with the limit equilibrium method and the Janbu slope stability model (φ’mob = 18°). In the range of shear rates (approx. 10-10 s-1) and volumetric
water contents (15-35%) observed on the site, both materials are characterized by elasto-plastic strains.
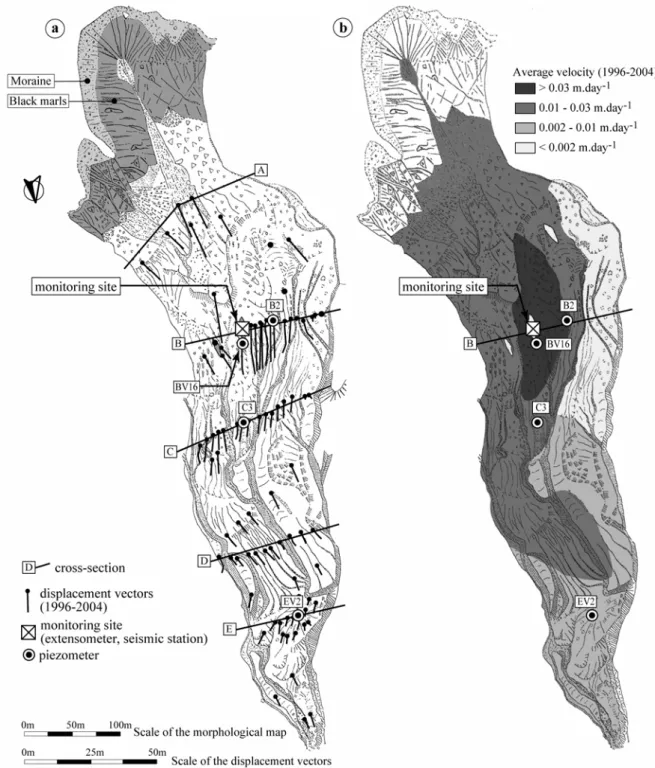
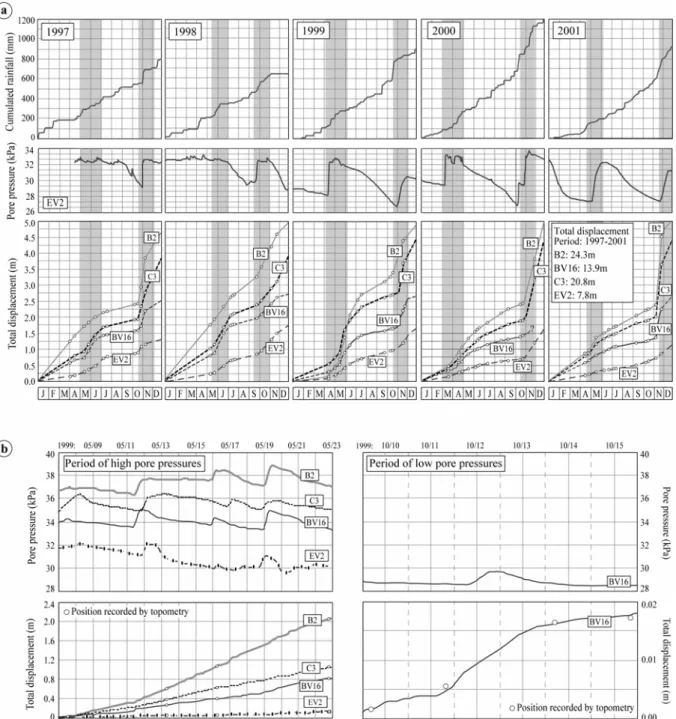
On average, the mudslide velocities lie in the range from 0.002 to 0.03 m.day-1 for the period 1996-2004 (Fig. 3a, 3b). But landslide crises with velocities up to 0.4 m.day-1 may be observed each year in the spring season (Fig. 4a). Displacements along the mudslide correspond mainly to the line of greatest slope. The general direction of the displacements is facing N-10° on cross-sections A, B, C and E and N-340° on cross-section D, emphasizing the influence of the bedrock geometry on the dynamics of the mudslide (Fig. 3a). Several years (1997-2005) of continuous displacements and pore water pressure monitoring have demonstrated that the mudslide accelerations are controlled by the hydro-climatic conditions and are generally the result of the undrained reactivation of the reworked material (Malet et al., 2005); the induced displacements being characterised by a highly variable rate (Fig. 3b). Figure 4 shows some examples of the ‘pore water pressure – displacement’ relationships at both the annual (Fig. 4a) and event scales (Fig. 4b) at several locations. The kinematics exhibit a marked seasonal trend with two acceleration periods (Spring and Autumn) and two deceleration periods in Summer and in Winter when snow covers the mudslide (Fig. 4a). The variations in landslide velocity correlate with the hydrological behaviour at both the annual (Fig. 4a) and event scales (Fig. 4b). Groundwater fluctuations exhibit the same trend throughout the landslide however the relative position of the water level is dependent on local conditions; the highest pore water pressures being observed in the upper part (cross-section B) and decreasing downslope. Consequently, displacement rates are also variable and decrease from the upper to the lower part of the mudslide. One of the most interesting points is the correlation between pore pressures and velocities observed in periods of high (Spring) or low (Autumn) pore water pressures (Fig. 4b).
It appears therefore that hydrology is the main controlling factor of the mudslide mobility. The long-term dynamic is characterized by continuous movements with a seasonal trend; the mudslide may be active for decades or more as is justified by the very low Safety Factor of the landslide body (mean φ’r=20°, mean slope angle β=25°). Once a threshold in pore pressure distribution is attained, the rate of movement increases. During a pore pressure decrease the landslide velocity decreases, however cessation of the movement is not observed. Two pore water pressure thresholds trigger the acceleration of the movement; above these the velocity increases non-linearly. On average, the ‘Spring movements’ are initiated as soon as the pore pressures reach 30 kPa while the ‘Autumn movements’ are triggered by a higher threshold value of around 32 kPa. This higher level is probably explained by shear strength recovery due to an increase in undrained cohesion through consolidation in summer (Salt, 1988; Malet, 2003).
3 Installation of the seismic monitoring station
The seismic sensor was implemented in the most active part of the mudslide, e.g. representing the highest displacement and highest sensitivity to pore pressure (near piezometer BV16, Fig. 3). The occurrence of events exhibiting sudden velocity increases was considered as a potential cause of variations in the recorded seismic noise. The presence of a stable in-situ crest in this part of the moving mass was an advantage for installation of the sensor being located both in stable conditions and near to the active part of the landslide.
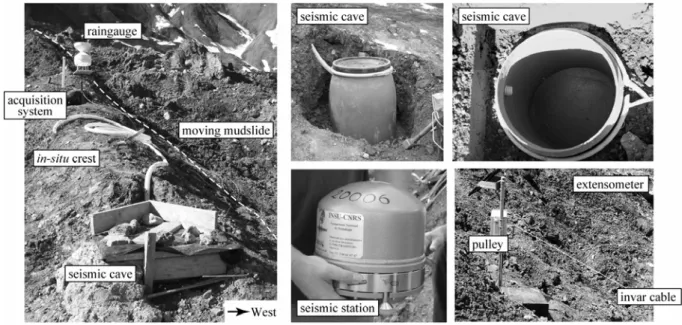
A broadband Streckeisen STS2 seismometer with a peak-to-peak transduction factor of 1500 V.m.s-1, was installed in a small vault excavated within the lower part of the stable crest
(Fig. 5). The vault was constructed using a truncated oilcan sealed into a concrete basement and buried approximately 70 cm below the surface. This configuration was initially designed to protect sensor from rock falls and animal disturbance. The diurnal temperature variation was attenuated using a double layer of polystyrene and concrete slab above the whole device. Ground velocity measured in the frequency range [1/120 – 50] Hz, was recorded using a Titan Agecodagis 24 bits digitizer with a sampling frequency of 80 Hz. Energy was supplied by five 50 Ah batteries connected to two 30 W solar panels. Orographic shade and the northward orientation of the mudslide made difficult to accomplish a sufficiently fast battery loading during the daily available few hours of direct sunlight. Such a configuration will be re-evaluated for future installations.
4 Seismic data and signal processing
Despite the high degree of protection of the sensor, an anonymous manipulation of the seismometer broke two of its components 14 days after the start of the experiment. Thus compared to the dataset expected, only partial results are shown hereafter. During these 13 days of available records, mainly seismic noise and some local earthquakes were recorded. Thus our analysis concerns essentially the temporal and spectral characterization of the seismic noise.
The analysis of the temporal evolution of the seismic noise consists in estimating the signal strength by calculating the root means squared (RMS) for successive temporal windows of one hour. We distinguished horizontal (RMS_H) and vertical (RMS_V) components:
t Z n RMS n i i V =
∑
Δ =1 2 1 (1)(
N E)
t n RMS n i i i H =∑
+ Δ =1 2 2 1 (2)where n is the number of points included in the temporal window; Z is the signal amplitude of vertical component; N and E are the signal amplitude corresponding to the horizontal components in North and East directions respectively; Δt is the sampling period.
To assess the frequency sensitivity of the RMS, this parameter was calculated for three frequency bands (0.01-0.1 Hz; 0.1-1 Hz; 1-10 Hz). The RMS was calculated on the signal after pass-band filtering in each frequency band (2nd order Butterworth filter). For convenience hereafter, LF represents the low-frequency band (0.01-01 Hz); MF, the middle frequency band (0.1-1 Hz); HF, the high frequency band (1-10 Hz).
4 Correlation between seismic activity, weathering and displacement rate
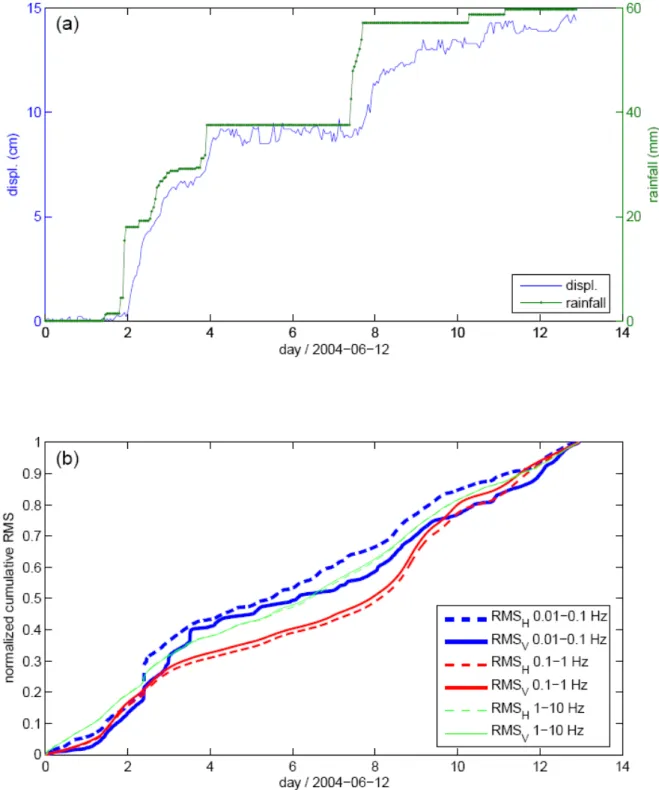
Figure 6 presents the cumulated rainfall, the observed displacement of the mudslide recorded with the extensometer, and the cumulative RMS for the three frequency bands and for the horizontal and vertical components during the 13 days of recorded seismic noise. The displacement rate shows a strong dependence to the rainfall input. Hence during this period, each of the three rain events promoted an increase in the displacement velocity which continues for some time after the rain stopped. The rapid response of the mudslide to the rainfall input is observed each Spring time (April, May, June) when the groundwater table within the landslide is near the ground surface, and so that the material is nearly completely saturated; and the pore water pressures are high (Malet and Maquaire, 2003). The delay in
observation of a decrease in the velocity depends on both the amplitude of the rain event and the pore water pressures.
The seismic noise greatly varies with time. In order to enable the comparison between the three frequency bands, the cumulative RMS was normalized by its maximum value. There is no significant difference between the vertical and horizontal component for MF and HF, whereas this difference is notable for the LF band. Each frequency band exhibits variations which are well correlated with the mudslide displacement, the amplitude of this variation being dependent on the frequency band.
Spectral analysis was performed for successive windows of 1-hour duration in order to check if the frequency content varies with time and if these changes are correlated with the displacements. The horizontal and vertical spectra were calculated using a Fast Fourier Transform algorithm (FFT):
( )
FFT(
Z( )
t)
Sν V =
( )
FFT(
N( )
t E( )
t)
Sν H = 2 + 2
where ν is the frequency, Z(t), N(t) and E(t) are the signal amplitude in the vertical, North and East directions, respectively. The ratio of the horizontal and vertical amplitude spectra, HVR was also calculated:
( )
( )
( )
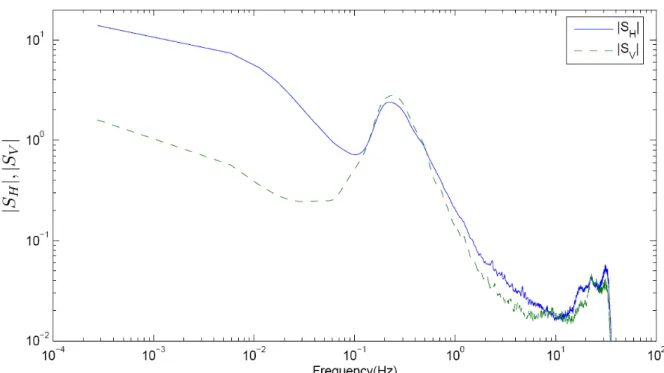
V H S S HVR ν ν ν =Figure 7 shows the normalized mean spectra for the vertical and horizontal components. It was obtained by calculating the mean of all the spectra’s calculated for each period of 1-hour.
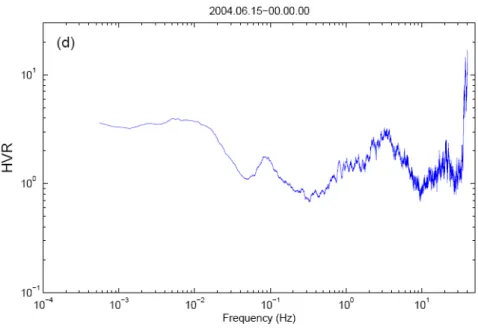
The HVR spectra averaged over all the periods reveals peaks of amplitude at different frequencies (0.01 Hz, 3 Hz, 15 Hz, 20 Hz). When calculating the HVR for successive time windows of 1 hour, different shapes of spectrum were identified that corresponds to the peaks presented in Figure 8. Figure 9 shows the HVR spectra observed at different times with a low frequency peak (<0.1 Hz), middle frequency peak (0.1-10 Hz) and high frequency peak (>10 Hz). Some periods are characterized by peaks on these 3 bands (mixed type). The highest peak in amplitude is about 20 and corresponds to low frequencies.
The changes in HVR peaks may be related to changes in the sources of seismic noise at distance from the landslide (wind, tide), to changes in the properties of the material (due to damage or weathering) or to the deformation of the material (shear of the mudslide material along the bedrock). Further investigations are needed to understand the causes of this behaviour.
5 Discussion and conclusion
A broadband seismic monitoring experiment of an active mudslide has been presented. Despite the short duration of this monitoring (13 days), a few events of displacement
acceleration were observed and recorded. These accelerations seem to be well correlated with the seismic noise calculated in three different frequency bands. The band [0.1-1 Hz] appears to be the more sensitive and provides the best correlation.
As the displacement rate is correlated to the rainfall input, a bias related to the noise of the rain shocking the ground surface near the seismic sensor may be suspected. As the seismometer was located at 0.7 m depth this effect should be low but could exist. The rainfall events have a very short duration compared to the duration of the RMS increase. So this potential bias effect of the water fall can be rejected. A secondary bias could be related to the water flow on the ground surface which can be noisy. In this case we did not observe any surface streams as the water quickly infiltrates into the soil. This bias could be also rejected. The observed correlation between displacement rate and seismic noise can be attributed to changes in the material mechanical properties during the acceleration phase. The shearing of the moving mass on the stable crest located within a few meters of the seismic sensor may explain this correlation. This effect is visible on all the frequency ranges and is enhanced in the range [0.1-1] Hz which displays the best correlation. An interesting observation is the changes in the frequency peaks observed on the HVR spectrum. Additional investigations are needed to clarify this point.
Finally, this case study demonstrates the potential of broadband seismic monitoring in the investigation of the behaviour of slow landslides, including mudslides such as the one investigated in the present work. Extending the frequency range of investigation possibilities and complementing by the low frequency measurements already carried out on landslides (GPS, geodetic and strain measurements) will allow significant improvement in our understanding of landslide failure mechanisms.
6 References
Amitrano D., Grasso J.R. & Senfaute G., (2005) - Seismic precursory patterns before a cliff collapse and critical-point phenomena - Geophysical Research Letters, 32, 8, L08314, doi:10.1029/2004GL022270.
Amitrano D., Senfaute G., Grasso J.R., Got J.L., Gaffet S., & Clement C. (2004) - Potential of the seismic monitoring for the understanding of gravitational instability. In: AGU Fall Meeting, paper n°H44A-06, San Francisco.
Dixon, N., Hill, R. and Kavanagh, J. (2003). Acoustic emission monitoring of slope instability: development of an active waveguide system. Geotechnical Engineering, 156, 2, 83-95.
Dixon, N., Kavanagh, J. and Hill, R. (1996). Monitoring landslide activity and hazard by acoustic emssion. Journal of the Geological Society of China, 39, 4, 437-464.
Dixon, N., Spriggs, M., Hill, R. and Kousteni, A. (2003). Acoustic emission techniques for locating shear surfaces forming with slopes. In: L. Picarelli (Editor), Fast Slope Movement Prediction and Prevention for Risk Mitigation, Naples, 163-168.
Eberhardt, E., Spillmann, T., Maurer, H., Willenberg, H., Loew, S. and Stead, D. (2004). The Randa Rockslide Laboratory: Establishing brittle and ductile instability mechanisms using numerical modelling and microseismicity, 9th International Symposium of Landslides, Rio de Janeiro, 481-487.
Grandjean G., Pennetier C., Bitri A., Meric, O. & Malet, J.-P. (2006) - Characterization of the internal structure and the hydric state of clayey-marly landslides through geophysical tomography: example of the Super-Sauze earthflow - Comptes Rendus Géosciences, 10 p. (in press).
Grandjean G., Malet, J.-P., Bitri A., Méric, O. 2006. Geophysical data fusion by fuzzy logic for imaging the mechanical behaviour of mudslides. Bulletin de la Société Géologique de France (this issue).
Grasso J.R., Amitrano D. & Senfaute G. (2004) - Critical behaviour of the seismic precursors of a cliff collapse. In: AGU Fall meeting, pp. paper n°NG33A-0883, San Francisco.
Hardy H.R. & Kimble E.J. (1991) - Application of high-frequency AE/MS techniques to rock slope monitoring. In: Vth Conf. AE/MS Geol. Str. and Mat., edited by Hardy, pp. 457-477, Trans Tech Publication, Germany, The pennsylvania State University.
Itakura, Y., Inaba, H. and Sawada, T. (2005). A debris-flow monitoring devices and methods bibliography. Natural Hazards and Earth System Science, 5, 971-977.
Kennedy B.A. & Niermeyer K.E. (1971) - Slope monitoring systems used in the prediction of a major slope failure at the Chuquicamata mine, Chile. In: Proc. On Planning Open Pit Mines, pp. 215-225, Blakema, Johannesburg.
Kolesnikov, Y.I., Nemirovich-Danchenko, M.M., Goldin, S.V. and Seleznev, V.S. (2003). Slope stability monitoring from microseismic field using polarization methodology. Natural Hazards
and Earth System Science, 3, 515-521.
Kousteni, A., Hill, R., Dixon, N. and Kavanagh, J. (1999). Acoustic emission technique for monitoring soil and rock slope instability. In: Y.J. Yagi (Editor), Slope Stability Engineering, 151-156.
Lavigne F., Thouret J.-C., Voight, B., Young, K., LaHusen, R., Marso, J., Suwa H., Sumaryono, A., Saydi, D.S., Dejean, M. 2000. Instrumental Lahar Monitoring at Merapi Volcano, Central Java, Indonesia. Journal of Volcanology and Geothermal Research, 100, 1-4, 457-478.
Lockner D.A. (1993) - The role of acoustic emission in the study of rock fracture, Int. J. Rock Mech.
Min. Sci. and Geomech. Abstr., 30, 7, 883-899.
Malet J.-P., Van Asch Th.W.J., Van Beek R. & Maquaire O. (2005) - Forecasting the behaviour of complex landslides with a spatially distributed hydrological model - Natural Hazard and Earth
System Science, 5, 71-85.
Malet J.-P. & Maquaire O. (2003) - Black marl earthflows mobility and long-term seasonal dynamic in
southeastern France. In: Picarelli, L. (Ed). Proceedings of the International Conference on Fast
Slope Movements: Prediction and Prevention for Risk Mitigation. Patron Editore, Bologna: 333-340.
Malet J.-P. (2003) - Les ‘glissements de type écoulement’ dans les marnes noires des Alpes du Sud.
Morphologie, fonctionnement et modélisation hydro-mécanique. Doctoral Thesis, University
Louis Pasteur, Strasbourg, 364 p.
Maquaire O., Flageollet J.-C., Malet J.P., Schmutz M., Weber D., Klotz S., Albouy Y., Descloîtres M., Dietrich, M., Guérin R. & Schott J.J. (2001) - Une approche multidisciplinaire pour la connaissance d’un glissement-coulée dans les marnes noires (Super-Sauze, France) - Revue
Française de Géotechnique, 95/96, 15-31.
Maquaire O., Malet J.P., Remaître A., Locat J., Klotz S. & Guillon, J. (2003) - Instability conditions of marly hillslopes: towards landsliding or gullying? The case of the Barcelonnette Bassin, South East France - Engineering Geology, 70, 1-2, 109-130.
Méric, O., Garambois, S., Malet, J.-P., Cadet, H., Guéguen, P., Jongmans, D. 2006. Seismic noise-based methods for soft rock landslide characterization. Bulletin de la Société Géologique de France (this issue).
Nicholson C. (1992) - Recent developments in rockburst and mine seismicity research. In: Rock
Mechanics, edited by T.a. Wawersik, pp. 1079-1086, Balkema, Rotterdam.
Obert, L. (1977) - The microseismic method: discovery and early history. In: First conf. on acoustic
emission / microseismic activity in geologic structures and materials, pp. 11-12, Trans Tech
Publications.
Salt, G., (1988) - Landslide mobility and remedial measures. In: Bonnard, C. (Ed): Proceedings of the 5th International Symposium on Landslides, Lausanne, Switzerland, Balkema, Rotterdam, 757-766. Willenberg, H., Spillmann, T., Eberhardt, E., Evans, K.F., Loew, S. and Maurer, H. (2002).
Multidisciplinary monitoring of progressive failure processes in brittle rock slopes - Concepts and system design, 1st European Conference on Landslides, Prague, 477-483.
Acknowledgements:
This work was supported by grants from the French Ministry of Research under the ACI-CatNat project SAMOA ‘Surveillance et Auscultation de MOuvements gravitaires Alpins’. Coordinators: C. Delacourt, O. Maquaire and D. Amitrano. Digitizer and STS2 sensor was part of the INSU Mobile National Broad Band Network (RLBM, Strasbourg, France). Contribution INSU N° 457. The authors are grateful to two anonymous reviewers for their improvements of the manuscript.
Figures
Figure 1. Geomorphologic features of the Super-Sauze mudslide. (1a): Orthophotograph of the mudslide in 2000, and location of cross-section B of Figure 2. (1b): Tension cracks (western part of the mudslide). (1c): Striations indicating landslide movement on the flank of a stable in-situ crest (central part of the mudslide, B cross-section); (1d): Compression levees (lower part of the mudslide).
Figure 1. Caractéristiques géomorphologiques du glissement argileux de Super-Sauze. (1a) Orthophotographie du glissement datant de 2000 et localisation de la section B de la Figure 2. (1b) Fissure de tension (partie ouest du glissement). (1c) Stries indiquant le mouvement du glissement sur le flanc d’une crête stable (partie centrale du glissement, section B). (1d) Bourlets de compression (partie basse du glissement).
Figure 2. Geometry and structure of the mudslide on the cross-section B. Figure 2. Géométrie et structure du glissement dans la section B.
Figure 3. Kinematics and displacement field of the Super-Sauze mudslide. (3a). Total displacements observed during the period 1996-2004 by using a network of approx. 50 benchmarks by topometry; (3b). Average velocity field observed during the period 1996-2004.
Figure 3. Champ de déplacement et cinématique du glissement de Super-Sauze. (3a). Déplacement totaux observés durant la période 1996-2004 obtenus par topographie à partir d’un réseau d’environ 50 points. (3b). Champ de vitesse moyen observé pendant la période 1996-2004.
Figure 4. Examples of ‘pore water pressure – displacement’ relationships observed on the mudslide at the annual (Fig. 4a, period 1997-2001) and event scales (Fig. 4b, two periods in 1999) at several locations.
Figure 4. Exemples de relation entre pression de pore et déplacement. Observations annuelles (Fig. 4a, période 1997-2001) et à l’échelle d’un évènement (Fig. 4b, deux périodes en 1999) à différent lieux.
Figure 5. In-situ stable crest of the Super-Sauze mudslide equipped with a seismic station installed in a seismic cave, an extensometer, a raingauge and a piezometer.
Figure 5. Crête stable du glissement de Super-Sauze, sur laquelle a été installée la station sismique dans une cave sismique, un extensomètre, un pluviomètre et un piézomètre.
Figure 6. Correlation between rainfall, landslide displacement and normalized RMS. (6a): Cumulated rainfall and displacements observed au point at the monitoring site; (6b): normalized RMS for three frequency bands and for the horizontal and the vertical components.
Figure 6. Corrélation entre pluviométrie, déplacement du glissement et RMS normalisée. (6a): Pluviométrie cumulée et déplacement observée sur le site. (6b): RMS normalisée pour trios bandes de fréquence et en distinguant la composante horizontal et verticale.
Figure 7: Amplitude spectra of horizontal and vertical components, averaged over the entire monitoring period (13 days).
Figure 7: Spectre d’amplitude des composantes horizontale et verticale, pour l’ensemble de la période d’observation (13 jours).
Figure 8: Amplitude spectrum of Horizontal over Vertical ratio HVR, averaged over all the monitoring period (13 days).
Figure 8: Spectre d’Amplitude du rapport de la composante horizontale sur la composante verticale, pour l’ensemble de la période d’observation (13 days).
Figure 9. HRV spectrum observed at different times (indicated in the title) with peaks at different frequencies. (9a): low frequency peaks (< 0.1 Hz), (9b): middle frequency peaks (0.1-10 Hz), (9c): high frequency peaks (> 10 Hz), (9d) spectrum with several peaks (mixed type).
Figure 9. Spectres HRV observés à différents temps (indiqués dans le titre) présentant des pics à différentes fréquences. (9a): pics basse fréquence (< 0.1 Hz), (9b): pics moyenne fréquence (0.1-10 Hz), (9c): pics haute fréquence (> 10 Hz), (9d) pics à plusieurs fréquences (type mixte).