HAL Id: cea-02016827
https://hal-cea.archives-ouvertes.fr/cea-02016827
Submitted on 12 Feb 2019
HAL is a multi-disciplinary open access
archive for the deposit and dissemination of
sci-entific research documents, whether they are
pub-lished or not. The documents may come from
teaching and research institutions in France or
abroad, or from public or private research centers.
L’archive ouverte pluridisciplinaire HAL, est
destinée au dépôt et à la diffusion de documents
scientifiques de niveau recherche, publiés ou non,
émanant des établissements d’enseignement et de
recherche français ou étrangers, des laboratoires
publics ou privés.
Multivariate haplotype analysis of 96 sulci opening for
15,612 UK-Biobank subjects
S. Karkar, A. Gloaguen, Y. Le Guen, M. Pierre-Jean, C. Dandine-Roulland,
E. Le Floch, C. Philippe, A. Tenenhaus, V. Frouin
To cite this version:
S. Karkar, A. Gloaguen, Y. Le Guen, M. Pierre-Jean, C. Dandine-Roulland, et al.. Multivariate
haplotype analysis of 96 sulci opening for 15,612 UK-Biobank subjects. ISBI 2019 - Proceedings of
the IEEE International Symposium on Biomedical Imaging, Apr 2019, Venice, Italy. �cea-02016827�
MULTIVARIATE HAPLOTYPE ANALYSIS OF 96 SULCI OPENING FOR 15,612
UK-BIOBANK SUJECTS
S. Karkar
1B?, A. Gloaguen
1,2?, Y. Le Guen
1, M. Pierre-Jean
3, C. Dandine-Roulland
3,
E. Le Floch
3, C. Philippe
1, A. Tenenhaus
2, V. Frouin
11
Neurospin, Institut Joliot, CEA - Universit´e Paris-Saclay, 91191, Gif-Sur-Yvette, France
2Ecole CentraleSupelec, 91191, Gif-sur-Yvette, France
´
3
CNRGH, Institut Jacob, CEA - Universit´e Paris-Saclay, 91000, ´
Evry, France
B slim.karkar@cea.fr
ABSTRACT
Imaging genetic studies of large control cohorts such as UK Biobank enable to assess the range of normal variations in brain structures. Previous studies by our group have shown that the width of several cortical sulci is associated with a variant in the upstream region of KCNK2 gene even if this effect is corrected with age. Here we propose to analyze in a multivariate setup the associations between sets of genetic variants and multiple sulci widths. The genetic variants we consider are sets of SNPs of known phase called haplotypes, taken from the upstream region of KCNK2 gene. To the best of our knowledge, multivariate analysis in imaging genetics has never been used in haplotype studies. Our method was able to recover the expected association signal and uncover new associations between imaging data and genetic variants. Index Terms— Imaging genetics, haplotype, multivariate analysis
I. INTRODUCTION
Grey matter thickness is known to shrink with aging in both diseased and normal brains [1], [2], [3]. A related effect is the cortical sulcus widening [4], [5]. The width of a sulcus can be estimated using a feature called opening [6] shown to be robustly related to grey matter thickness and which does not require spatial normalization nor regional atlas. Heri-tability studies pointed to a dozen sulci that appeared to be under strong genetic control [7]. Furthermore, in [8], GWAS has identified a reproducible genetic marker associated with the opening of the left, posterior, Calloso-Marginal sulcus. In this work, we used the Brainvisa cortical sulci recognition pipeline to automatically segment [9] and label [10] nearly one hundred brain sulci. GWAS use a univariate approach and as such, suffer from several drawbacks, in particular the use of an unduly conservative multiple test correction and the fact that the correlation structure of the genome is not accounted for. In the context of complex traits, where individual variant effect size is expected to be small, only
?Authors contributed equally
SNPs that are frequent in the population can significantly be associated with the phenotype. Moreover, univariate analyses are unable to model or predict the role of a genetic variant within the genomic region. Finally, univariate approaches are inadequate in situations where a set of variants are jointly associated to multiple phenotypes (pleiotropy). Using a multiple phenotype multivariate approach, we propose to alleviate these drawbacks by simultaneously analyzing one hundred related phenotypes and to model interactions between genetic variants within the same genomic segment.
II. MATERIAL AND METHODS
We obtained 20,060 T1-weighted MRI from the January 2018 release, under UK Biobank (UKB) data appl. #25251. UKB cohort is particularly suited to study aging, with a mean participants age of 57 years, and a standard deviation of 8.2. We retained 15,612 subjects after QC protocol, British ancestry selection, and additional filtering for high heterogeneity, high missingness, first-degree relatedness and sex mismatch.
II-A. Imaging
For each selected subject, the brain mask of the T1-weighted image is obtained using SPM8 (fil.ion.ucl.ac.uk/spm). Next, individual brain images were segmented into grey matter, white matter and cerebro-spinal fluid (CSF) in BrainVisa. Finally, individual sulci were extracted using Morphologist, the sulcus identification pipeline of BrainVisa. We retained the 96 (out of 126) most sample-wide identified sulci : a sulci was retained if it was missing in less than 1000 individuals (94.6% presence rate, see [11]). For each retained sulcus and for each subject, sulcus width or opening (the average distance between both banks) was estimated as the ratio of CSF volume and surface area of the sulcus [7], [8].
II-B. Genetics
Genotyping data in UKB (UK Biobank Axiom Array) contains 820, 967 SNPs. In such data, for a given SNP, the variant status is obtained without knowing if it lays
on the paternal or maternal chromosome for a heterozygote subject. This raises an issue when one wants to use the chain of consecutive SNPs. In the 2018 release of UK Biobank, the so-called “phased data” are available for the 500,000 subjects. With this preprocessing, the succession of SNPs alleles is inferred in contiguous small regions of maternal or paternal chromosomes. Based on the results of a GWAS [8] where SNP rs864736 is found to be associated with the opening of several sulci, we chose a genomic region of 55.8 kbp on chromosome 1, which contained all the SNPs in linkage desequilibrium with rs864736 (i.e., SNPs which are supposed to be inherited together from the parents). This region consists in 18 SNPs. Using the “phased data” of our 15,612 subjects in this region, we derived all the haplotypes with a length of 3 to 18 SNPs.
II-C. Haplotype multivariate association analysis The interplay between neuroimaging and genetic data is uncovered using Regularized Generalized Canonical Corre-lation Analysis (RGCCA), a general framework for multi-block data analysis [12], [13].
The first block, denoted X1, is related to neuroimaging
and is defined by p1 = 96 sulci measured on n = 15, 612
individuals. The second block X2 is related to genetic
information and is defined by p2= 604 haplotypes measured
on the same set of n individuals. RGCCA aims to find block components yj = Xjwj ; j = 1, 2 (where wj is
a column vector with pjelements) summarizing the relevant
information between and within the blocks. In this context, RGCCA is defined as the following optimization problem :
max w1,w2 cov2(X1w1, X2w2) s.t. w>jSˆjjwj= 1, j = 1, 2. (1) where ˆSjj = τjI + (1−τj) n−1 X >
jXj and τj is a scalar between
0 and 1. ˆSjj can be considered as a shrinkage estimate
of the true variance-covariance matrix Σjj [14]. [15] gives
an analytical formula for the optimal τj that minimizes the
mean square error between Σjj and its estimate ˆSjj.
II-D. Bootstrap procedure and missing data imputation A balanced bootstrap procedure [16] is used to assess the reliability of estimated weights. For that purpose B = 2000 bootstrap samples are considered. Some sulci were not detected in all individuals, therefore a simple regression imputation strategy is used to avoid missing values in each bootstrap sample of sulci opening data. A simple regression model is built to predict each opening value from the covariates Age, Sex, and the 10 first components of UK Biobank-provided MDS. Residuals where reported in a new n × p1 matrix, where subjects with missing sulci (i.e. where
not accounted for in the regression model) are set to 0. This procedure allows both to impute missing values and remove effects of covariates which are confounding factors in our
case. Finally, each residual bootstrap sample is standardized within each block in order to make the variables comparable. To make blocks comparable, each block was divided by the square root of its number of variables [13]. The RGCCA package (freely available at CRAN : cran.r-project.org) was then used to yield the weights vectors wb
1 and w2b for each
bootstrap sample b = 1, . . . , 2000.
II-E. Confidence intervals and variable selection In order to assess the reliability of estimated weights, α-level confidence intervals (Ck,αj , j = 1, 2) were derived for each element w1k (corresp. to the kth sulcus) of w1 and
w2k (corresp. to the kth haplotype) of w2. Non-parametric
(Ck,αj,N P) and parametric (Ck,αj,P) methods were considered to estimate these confidence intervals.
For Ck,αj,N P, the empirical bootstrap distribution of wj,k
was used to estimate the confidence interval. In order to be as restrictive as possible, we chose to only look at Ck,αj,N P min = " min(wj,kb ) b∈J1,BK , max(wbj,k) b∈J1,BK # , which corresponds to a level αmin= 2/B = 10−3.
For Ck,αj,P, similarly to [17], we estimated the mean and variance for each element w1k and w2k across the bootstrap
samples, from which we derived confidence intervals under the assumption that the weights estimation exhibited asymp-totic normality.
Since simultaneous multiple bootstrap confidence intervals estimates were desired with an overall confidence coefficient 1 − α for each block Xj, j = 1, 2, we constructed each
interval with confidence coefficient 1 − (α/pj), j = 1, 2.
The procedure is similar to a Bonferroni correction. For non-parametric estimation, there is no advantage in exploring levels lower than αmin since their confidence intervals
correspond to the full distribution.
Nevertheless, non-parametric estimation still offers prac-tical advantages as being closer to the real distribution, thus, we chose to look at three confidence intervals : Cj,N Pk,α
min,
Ck,5%,BFj,P and Ck,10%,BFj,P . The last two confidence intervals are Bonferroni corrected as mentioned earlier. This correc-tion is likely very conservative w.r.t. the independence of the pj variables since many haplotypes are subsets of others.
For these reasons we chose to explore the two levels of confidence α = 0.05 and α = 0.1.
A weight element wjk is considered as relevant if zero is
excluded from its confidence interval, since the probability of this weight being zero is lower than the level of confidence associated to this interval.
III. RESULTS
Figure 1 represents the weights wj, j = 1, 2 computed
with RGCCA. Only relevant weights according to Ck,αj,N P
min
are shown. The ones associated to a single star were relevant for Cj,Pk,10%,BF, the ones with a double star were significant according to both Ck,10%,BFj,P and Ck,5%,BFj,P .
Fig. 1. (Left) : Weights w1 associated with the selected
vari-ables of the imaging block. Selected features were the bilat-eral Posterior Calloso-Marginal Sulci ; (Top, Right) : Weights w2 associated with the selected variables of the genetic block.
All displayed variables were selected using Ck,αj,N P
min(see text for
de-tail) with (∗∗) : variables selected with parametric confidence level Ck,5%,BFj,P and (∗) : variables selected with parametric confidence level Ck,10%,BFj,P . (Bottom, Right) : SNP composition of selected haplotypes : light grey bars show the extent of the sequence and dots indicate the location of alternative alleles (see text for details).
III-A. Selected variables for imaging block
Figure 1 (top, left) shows a barplot of the weights as-sociated with the 2 selected features of the imaging block. The selected variables correspond to the bilateral Posterior Calloso-Marginal Sulci, of which the opening of the for-mer was reported significantly associated with rs864736. Variables were relevant according to the three confidence intervals considered. There were 2 supplemental imaging features (right Subcallosal and Superior precentral sulci, not shown) relevant according to Ck,10%,BFj,P . However, they were excluded since they were not selected using Ck,αj,N P
min.
III-B. Selected variables for genetic block
Figure 1 (top, right) depicts the weights associated with the 12 selected haplotypes (in decreasing order) according to Cj,N Pk,α
min. Figure 1 (bottom, right) gives the composition of the
haplotypes : selected sequences of variants are represented as a grey box. In each sequence, grey dots indicate the alternate alleles. Haplotypes are named as follows : [index of starting SNP - sequence of variants], e.g. [4 − 000001] refers to
the haplotype that starts on position #4 with 5 reference alleles and a single alternative allele at position #9. Selected haplotypes included various combinations of variants (from 3 to 10), however none of the haplotypes included variants between position 11 to 18. [4-000001] and [3-1000001] are relevant to Cj,Pk,5%,BF. If the confidence level is decreased to 10% using Ck,10%,BFj,P , 3 additional haplotypes appear : [7-0011], [5-000011] and [4-0000000]. Only the last one has a positive weight.
III-C. Interpretation findings
We will interpret the sign of the weights using haplo-type [4-000001] and Left Posterior Calloso-Marginal Sulcus (FCMpost left) as an example. These both variables have negative weights in the model meaning that they are neg-atively correlated to their block component yj, j = 1, 2.
However, over the B = 2000 bootstrap samples, correlation between y1 and y2 was always negative. To summarize,
the presence of haplotype [4-000001] is associated to a lower opening for FCMpost left : haplotypes with a negative weight have a protective effect on the sulcus opening w.r.t aging. Opposite conclusions are drawn for haplotypes with a positive weight in the model. However, interpretation of the values of these weights is not straightforward. To assess the magnitude of the association with the phenotypes we rely on explained variance in the following section.
IV. DISCUSSION
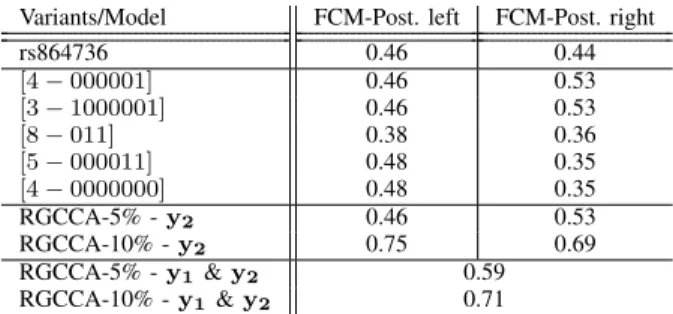
Previous studies by our group identified SNP rs864736 (and marginally rs59084003) as significantly associated with sulci opening and grey matter thickness for left Posterior Calloso-Marginal, Intra-Parietal and Central sulci. RGCCA was run two last times, first with only relevant variables according to Cj,Pk,5%,BF (RGCCA-5%) then with variables based on Ck,10%,BFj,P (RGCCA-10%). For comparison pur-poses, we computed the explained variance using univariate analysis of the most significant variant (rs864736) and the sulci opening most associated with it (FCM posterior left and right). Several haplotypes had better or similar explained variance than rs864736 (see top and middle rows of Table I). Moreover, in RGCCA-10%, variance explained by the ge-netic block component y2= X2w2(where here, X2 is only
composed of selected variables based on Ck,10%,BFj,P ) largely outperformed the single-SNP model. When we evaluated the variance of the imaging block component y1, as explained
by the full genetic block component y2, both RGCCA-5%
and RGCCA-10% outperformed the single-SNP model. Several selected haplotypes are subsets of each other, and differ by one variant. If the SNP they differ from is not frequent, they represent very similar variables. To evaluate the impact of such co-linear variables, haplotype variables were excluded if the percentage of subject that differs for two haplotypes is less than 1%. In this case, only the variable for most frequent haplotype was kept. On this new dataset, we
Variants/Model FCM-Post. left FCM-Post. right rs864736 0.46 0.44 [4 − 000001] 0.46 0.53 [3 − 1000001] 0.46 0.53 [8 − 011] 0.38 0.36 [5 − 000011] 0.48 0.35 [4 − 0000000] 0.48 0.35 RGCCA-5% - y2 0.46 0.53 RGCCA-10% - y2 0.75 0.69 RGCCA-5% - y1& y2 0.59 RGCCA-10% - y1& y2 0.71
Table I. Percentage of Explained Variance for univariate analysis using : (top row) single-SNP ; (five middle rows) selected variables at confidence level Cj,Pk,10%,BF ; (RGCCA-5% and RGCCA-10%) model-derived haplotype combination and (2 bottom rows) variance of the imaging block component y1, explained by the genetic block
component y2
used the same bootstrap procedure to derive a new Cj,Pk,5%,BF. In a similar fashion to RGCCA-5%, we then derived a third model. For this model, 3 variables in the genetic block were selected ([2-01000001], [4-000001] and [8-011]). Variables in the imaging block remained the same and their associated weights were similar to RGCCA-5%. The combination of the 3 genetic variables exhibits similar explanatory power as RGCCA-10%, with an explained variance of 0.64 and 0.7 for left and right Calosso-Marginal sulci, respectively.
Work in progress includes application of sparse versions of RGCCA [18], [19] and comparisons with the presented results.
V. CONCLUSION AND FUTURE WORKS We proposed a multivariate model for haplotype associa-tions with multiple quantitative traits that successfully recov-ered previously known associations, and gained substantial knowledge regarding the genomic region and associated sulci. We present three new findings : 1) only the genomic region located before rs864736 and rs59084003 seems to be implicated in the association ; 2) haplotype combinations are explanatory variables regarding Calloso-Marginal sulcus in both hemispheres ; and 3) an alternate allele at the third position (rs504473) seems to be associated with an antagonistic effect w.r.t rs864736 and rs59084003. Future works will extend this approach to gene clusters, gene pathways and larger intergenic regions to detect regulating patterns that interact with the observed phenotypes.
This method relies on a critical variable selection proce-dure based on the bootstrap folds. This proceproce-dure has shown to be sensitive to strongly co-linear variables, therefore we intend to propose several developments that could enhance this step. First, using a tree-like representation of haplotypes, we could regularize or combine variables, thus allowing us to keep more observations for the model estimation. Second, using block sparsity and regularization, multivariate procedures such as sparse group-lasso could better account for co-linearity of the variables. In the context of imaging genetics, we argue that insights provided by multivariate
approaches are key in uncovering the complex interactions between genes, structure and function.
VI. REFERENCES
[1] Y. Ge et al., “Age-related total gray matter and white matter changes in normal adult brain. part ii: Quantitative magneti-zation transfer ratio histogram analysis,” American Journal of Neuroradiology, vol. 23, no. 8, pp. 1334–1341, 2002. [2] A. M. Fjell et al., “Structural brain changes in aging: Courses,
causes and cognitive consequences,” Reviews in the Neuro-sciences, vol. 21, no. 3, pp. 187–222, 2010.
[3] S. N. Lockhart et al., “Structural imaging measures of brain aging,” Neuropsychology review, vol. 24, no. 3, pp. 271–289, 2014.
[4] P. Kochunov et al., “Age-related morphology trends of cortical sulci,” Human Brain Mapping, vol. 26, pp. 210–220, 2005. [5] X. Shen et al., “Variation in longitudinal trajectories of
cortical sulci in normal elderly,” NeuroImage, vol. 166, pp. 1 – 9, 2018.
[6] D. Riviere et al., “Brainvisa: an extensible software en-vironment for sharing multimodal neuroimaging data and processing tools,” NeuroImage, vol. 47, p. S163, 2009. [7] Y. Le Guen et al., “Genetic influence on the sulcal pits: On
the origin of the first cortical folds,” Cerebral Cortex, vol. 28, no. 6, pp. 1922–1933, 2018.
[8] Y. Le Guen et al., “eQTL of KCNK2 regionally influences the brain sulcal widening: evidence from 15,597 uk biobank participants with neuroimaging data,” Brain Structure and Function, Dec 2018.
[9] C. Fischer et al., “Morphologist 2012: the new morphological pipeline of brainvisa,” in Proc. HBM, 2012.
[10] M. Perrot et al., “Cortical sulci recognition and spatial nor-malization,” Medical Image Analysis, vol. 15, no. 4, pp. 529 – 550, 2011.
[11] L. Borne et al., “A patch-based segmentation approach with high level representation of the data for cortical sulci recog-nition,” in Patch-Based Techniques in Medical Imaging, ser. Lecture Notes in Computer Science, W. Bai et al., Eds., vol. 11075. Springer, Cham, 2018.
[12] A. Tenenhaus et al., “Regularized Generalized Canonical Correlation Analysis,” Psychometrika, vol. 76, pp. 257–284, 2011.
[13] M. Tenenhaus et al., “Regularized generalized canonical correlation analysis: A framework for sequential multiblock component methods,” Psychometrika, vol. in press, 2017. [14] O. Ledoit et al., “A well conditioned estimator for
large-dimensional covariance matrices,” Journal of Multivariate Analysis, vol. 88, pp. 365–411, 2004.
[15] J. Sch¨afer et al., “A shrinkage approach to large-scale co-variance matrix estimation and implications for functional genomics,” Statistical applications in genetics and molecular biology, vol. 4(1):Article32, 2005.
[16] J. R. Gleason, “Algorithms for balanced bootstrap simula-tions,” The American Statistician, vol. 42, no. 4, pp. 263–266, 1988.
[17] A. Tenenhaus et al., “Kernel Generalized Canonical Correla-tion Analysis,” ComputaCorrela-tional Statistics and Data Analysis, vol. 90, no. C, pp. 114–131, Oct. 2015.
[18] A. Tenenhaus et al., “Variable selection for generalized canon-ical correlation analysis.” Biostatistics (Oxford, England), vol. 15, no. 3, pp. 569–83, 2014.
[19] T. L¨ofstedt et al., “A general multiblock method for structured variable selection,” 2016.