HAL Id: hal-01279592
https://hal-centralesupelec.archives-ouvertes.fr/hal-01279592
Submitted on 19 Apr 2017
HAL is a multi-disciplinary open access
archive for the deposit and dissemination of
sci-entific research documents, whether they are
pub-lished or not. The documents may come from
teaching and research institutions in France or
abroad, or from public or private research centers.
L’archive ouverte pluridisciplinaire HAL, est
destinée au dépôt et à la diffusion de documents
scientifiques de niveau recherche, publiés ou non,
émanant des établissements d’enseignement et de
recherche français ou étrangers, des laboratoires
publics ou privés.
Damien Bourcier, Yan Siong Kong, Jean-Pierre Feraud, Denis Ode, Didier
Colson, François Puel
To cite this version:
Damien Bourcier, Yan Siong Kong, Jean-Pierre Feraud, Denis Ode, Didier Colson, et al.. Filtration
Process Optimization: Rheological Behavior of a Filter Cake at Different Moisture Contents. Chemical
Engineering and Technology, Wiley-VCH Verlag, 2016, Mechanical Particle-fluid Separation
Technol-ogy, 39 (3), pp.515-521. �10.1002/ceat.201500426�. �hal-01279592�
To cite this article: D. BOURCIER , Y. S. KONG, J.P. FERAUD D. ODE, D. COLSON, F. PUEL, 2016
Filtration process optimization: rheological behavior of a filter cake at different moisture
contents Chemical Engineering and Technology 39, No. 3, 515–521
http://dx.doi.org/10.1002/ceat.201500426
Filtration process optimization: rheological behavior of a filter
cake at different moisture contents
BOURCIER Damien
(1)*, KONG Yan Siong
(1), FERAUD Jean-Pierre
(1), ODE
Denis
(1), COLSON Didier
(2), PUEL François
(2,3) (1) CEA/DEN/DTEC/SGCS/LGCI, BP 17171, 30207 Bagnols-sur-Cèze, France(2) Université de Lyon F-69622, Lyon, France ; Université Lyon 1; Villeurbanne ; CNRS, UMR5007, Laboratoire
d'Automatique et de Génie des Procédés (LAGEP), CPE-Lyon, 43 bd du 11 Novembre 1918, 69100 Villeurbanne, France
(3) Université Paris Saclay, CentraleSupélec, Laboratoire de Génie des Procédés et Matériaux (LGPM), EA 4038,
Grande Voie des Vignes, 92290 Châtenay-Malabry, France (*) [email protected] , (33) 4 66.79.14.96
Abstract
Transferring a wet cake from a filter to a dryer or furnace could severely lower the productivity of a whole process when the wet cake exhibits high viscosity and a sticky paste behavior. Depending on their moisture content, three distinct regions of rheological behavior were identified. Among them, only the granular solid type had sufficient flowability during the transfer operation. It was possible to discriminate the flow behavior more quantitatively by determining two transition values of moisture content. Rheological measurements were carried out at a constant shear rate representative of that encountered in the mechanical transfer system used at plant scale. The use of a vane geometry for the rheometer was necessary to ensure an accurate repeatability of the viscosity measurements.
1-Introduction
Solid-liquid separation technologies are needed in many industries: bio-technology, chemistry, oil and pharmaceutics for instance. Solid-liquid separation involves the separation of a solid and a liquid phase from a slurry. The filtrate viscosity is generally very low and is easily transported. On the contrary, the transferability of the residual cake from the filter or centrifuge to the dryer may present some difficulties, severely reducing plant productivity.
The cake obtained contains a residual moisture content induced by its porosity. If this moisture content is high, a suspension is obtained which behaves like a liquid, leading to a long drying time. On the other hand, if the moisture content is sufficiently low, a cake with a solid-like behavior is formed, resulting in an easier transfer process. When the moisture content has an intermediate value, however, a sticky paste-like substance is formed, causing problems during the transfer step. Fig. 1 shows the different behaviors of a suspension depending on its moisture content. X1 and X2 are the two moisture content values for which the cake flowability changes
drastically.
Figure 1: Different behaviors of cerium (III) oxalate depending on its humidity: (a) solid-like cake, (b) sticky paste, (c) fluid-like suspension
with rheometer techniques, due to various effects such as wall slip, migration, sedimentation, fracture and evaporation which may compromise the results [1]. Nevertheless, later in this paper we describe which rheometer geometry can give satisfactory quality, enabling the identification of the two transition moisture content values (X1 and X2) presented above.
The first part of this paper outlines the theoretical background of rheology. In the second part, the most commonly-used rheometer geometries are compared. Various tests were carried out to determine the most suitable geometry and experimental procedure in terms of repeatability. Finally, the two transition moisture content values are given to conclude our findings on the model system.
2. Theoretical considerations regarding granular paste viscosity
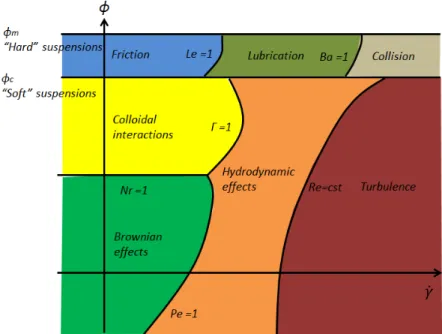
The term ‘granular paste’ or ‘granular suspension’ has been widely used in the literature to describe a highly concentrated mixture of solid particles in a Newtonian fluid [2]. If the particles are large enough, Brownian and colloidal interactions are negligible and the whole system is governed by interactions at particle scale. Three mechanisms can generally be considered: friction, lubricated interaction and collision. A few dimensionless numbers have been proposed in recent decades to determine the governing mechanism within a particular system, including the Leighton number, Le [3] and the Bagnold number, Ba [4]. The Fig. 2 [1] summarizes the different situations depending on the solid fraction and shear rate applied.
Figure 2: Conceptual classification of the rheophysical regimes of a suspension as a function of shear rate and solid fraction on a logarithmic scale. The other characteristics of the suspension are fixed [1].
When the volume fraction ϕ is higher than a critical concentration ϕc dependant of the shape [1],
interactions in the cake could depend on three mechanisms: friction, lubrication and collision. To identify the dominant interactions on our system, the dimensionless number of Leighton is proposed:
𝐿𝐿𝐿𝐿 =𝜂𝜂𝜎𝜎𝑠𝑠𝛾𝛾̇𝑏𝑏
𝑁𝑁𝜀𝜀𝑟𝑟
(1)
Le represents the ratio ofa characteristic time for the particle to enter into direct contact with another particle when moving through the fluid under the action of the external normal stress to the characteristic time of flow [1].
In our system, the interstitial fluid viscosity 𝜂𝜂s was 1 mPa.s, the shear rate 𝛾𝛾̇ 100 s-1, the normal
constraint σN was 20 Pa, the mean distance between the two centers of neighboring particles b was 9µm, and
the roughness εr about 1 µm. After calculation, the Leighton number Le is 0,045. Considering the solid fractions
experimented, the low shear rate and the Le number value, it is likely that frictional interactions were preponderant (see Fig 2.) and the particles were in direct contact with each other. Frictional flow was established.
In the literature [1; 2; 5; 6], these numbers have proven to be useful in providing an insight into the governing mechanism within a system. However, it should be noted that these numbers were formulated by
considering particle dimensions, the average mean distance between the particles and their roughness [2]. Hence, some approximations are necessary when the particles have a complex size distribution and an asymmetric shape, which could possibly lead to a misinterpretation of the result obtained.
There are a few classical formulas for granular paste viscosity estimation. The simplest one states the linear dependence of the relative viscosity on the solid volume fraction of the paste [7]:
𝜂𝜂
𝜂𝜂𝑠𝑠= 1 + 2.5𝜙𝜙
(2)
where η (Pa.s) is the dynamic viscosity of the paste, ηs (Pa.s) is the dynamic viscosity of the Newtonian fluid and
ϕ is the solid volume fraction of the paste. Later, the coefficient 2.5 was named as the intrinsic viscosity of a suspension composed of spherical and hard particles.
In recent decades, many researchers have attempted to evaluate the viscosity of such pastes through various much more complex formulas, such as the formula of Van Der Werff and De Kruif (3) presented below [8] and the formula of Krieger and Dougherty [9]:
𝜂𝜂𝑟𝑟=𝜂𝜂𝜂𝜂
𝑠𝑠= 1 + 2,5 𝜙𝜙 + 6,2 𝜙𝜙
2+ 𝛿𝛿(𝜙𝜙2) (3)
where ηr is the relative viscosity of the suspension and 𝛿𝛿(𝜙𝜙2) an inosotropic term usually neglected. These
formulas were established through various approaches, ranging from models assuming only hydrodynamic interactions (2) to models attempting to include colloidal [10] and Brownian interaction by varying the effective solid volume fraction [11; 12]. However, it is worth mentioning that the existing formulas are far from being capable of predicting and evaluating all the rheological properties of granular paste. All of them were tested to estimate the viscosity of our suspension of known solid volume fraction. The results obtained are shown on Tab. 1 for a solid volume fraction of 0.48.
Table 1. Comparison between the viscosities calculated by Eqs. (2) and (3) and the measured one.
Method Eq. (2) Eq. (3) Measurement at 46.4 s–1
Viscosity [Pa s] 2.2 ·10–3 3.7 ·10–3 1.5
The results obtained, however, differed from the measured results. As the solid volume fraction increased, the difference observed enlarged, showing the inaccuracy of the formulas outside their domain of validity as the particle interactions intensify. The prediction of the viscosity of high concentrated suspension must take into account a lot of parameters and interactions between particles and the fluid.
3. Materials, set-up and methods
3.1 Model substance
Cerium (III) oxalate is a solid currently used in the nuclear industry to model the behavior of reprocessed nuclear fuel. It was purchased from Sigma-Aldrich. It is hydrated, having a chemical formula of C6Ce2O12.xH2O.
The degree of hydration is around 9. This oxalate exhibits a platelets-like shape and the particle size distribution is centered on 38µm and the standard deviation is 28.9µm. The molecular weight of cerium (III) oxalate is 544.29 g/mol on an anhydrous basis and its CAS number is 15750-47-7.
The cake is replaced in the rheometer by a mix between distillated water and dry cerium oxalate. As the cake flows through a worm drive after filtration in our application, the integrity is lost and this is the mix rheology that is important.
3.2 Rheometer set-up
All the viscosity measurements were carried out with an Anton Paar MCR 301 rotational rheometer equipped with the Rheoplus32 software. All suspensions were sheared at the given shear rates and the shear stresses were measured.
A rheometer can run with various geometries. Hence, it is important to select the most suitable geometry for cerium (III) oxalate suspension for the most accurate result interpretation. Three geometries were
tested and will be discussed hereafter regarding their repeatability and reproducibility: the parallel disk, the concentric cylinder and the vane.
The parallel disk geometry used had a diameter of 25 mm. Both surfaces of the disk were covered by a Metalite K225 P80 sandpaper with a double tape to prevent wall slip. The gap between the two disks was 1 mm. All measurements were carried out with a logarithmic increase of the shear rate from 1 s-1 to 200 s-1 for 150 s.
The induced shear stresses were measured.
The two concentric cylinders used had inner and outer diameters of 16 mm and 18 mm respectively. The smallest had a conical bottom shape to limit the edge effect.
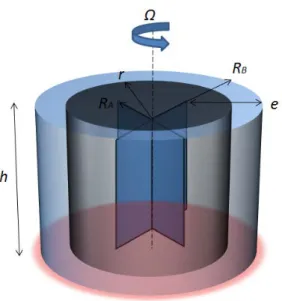
A new geometry called vane has been developed and used by many researchers. The rotation of the thin blades around the axis creates a fictive cylinder (see Fig. 3). This geometry may be considered as equivalent to the classic concentric cylinder geometry. It has become popular in recent decades as a simple and effective means to study the rheological properties of any complex fluid [13]. Da Cruz et al., for instance, have used this geometry to study foams and emulsions [14]. Coussot and al., on the other hand, have used it to measure the viscosity of a bentonite suspension with a solid volume fraction of 0.045 [15]. In this study, the geometry had 4 blades and the blades had a diameter RA of 10 mm whereas the diameter of the outer cylinder RB was 13.5 mm.
All measurements were carried out at 25°C by varying the shear rate from 1 s-1 to 200 s-1 logarithmically during
150 s.
The usual recommendation for a vane-in-cup ratio to neglect wall effect is 3:1 [16]. The vane-in-cup used in the experiments had a ratio of 1.3:1. Referring to the literature, wall effect can occur and lead to a more complex measure. In our case, with the ratio and the material used, wall effects such as slip didn’t appear and the choice to use a lower ratio than recommended was made.
All the measurements on various geometries were repeated three times to assess their repeatability. Before each measurement, the samples were stirred in order to limit sedimentation phenomena (see next section). The associated mean viscosity and the standard deviation were calculated.
3.3. Operating conditions
The preparation procedure for such solid/liquid media influences the rheological properties. When the sample is pre-sheared during a short period before the measurement, the microstructure of the sample is only partially destroyed, resulting in high viscosity during the measurement and poor measurement reproducibility. However the sample exhibits low viscosity if it is pre-sheared during a significantly long period before the measurement, since the microstructure of the sample requires a long time to be restored. Several shearing protocols were tested in order to evaluate the influence of a pre-shear followed by a rest time prior to the rheological measurements.
The operating conditions can be summarized in three steps (i) preparation of the slurry (ii) filling the rheometer and applying the shearing protocol (iii) measurement. The slurry preparation consisted in stirring the suspension of cerium (III) oxalate with a known moisture content in demineralized water in a beaker with a magnetic stirrer for 20 minutes. Three shearing protocols were tested: no pre-shear, application of a pre-shear at 50 s-1 for 100 s, and application of a pre-shear at 50 s-1 for 30 s and the sample then left to rest for 30 s.
Rheological measurements were then made at 25°C in triplicate to evaluate the repeatability of the protocol, varying the shear rate from 1 s-1 to 200 s-1 logarithmically for 150 s.
4. Results and discussion
4.1. Choice of the rheometer geometry
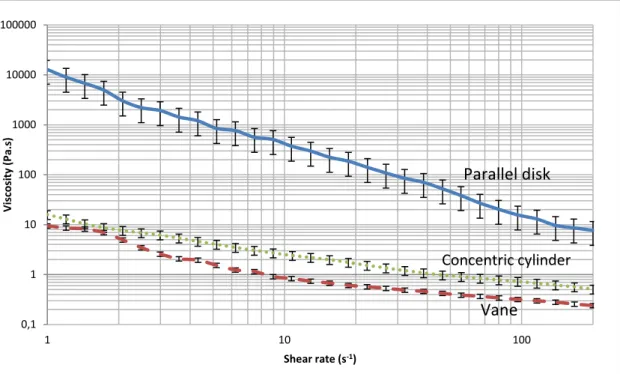
The mean values and the standard deviations of the viscosity measurement performed with the three possible geometries are plotted in Fig. 4 for a cake with 30% wt moisture content. All measurements were made with the pre-sheared protocol with rest time described in section 4.2.
Figure 4: Variation of the viscosity at 30% humidity on parallel disk, concentric cylinder and vane geometries.
The layer of sandpaper used with the parallel disk set-up greatly intensified the frictional interactions between the particles and the sandpaper. However this layer was necessary, given that the wall slip was too significant at 30% moisture content on the parallel disk. Measurement was not possible without it as the suspensions of cerium (III) oxalate began to age and solidify immediately after the sample preparation process, making the disk slide on the hardened solid. In addition, the cake broke easily on the parallel disk geometry, during which the shear rate was not transmitted to the lower layer of the suspension. With the concentric cylinders geometry, the small 1 mm gap between the two cylinders was not completely filled by the paste. This effect was enhanced when the moisture content was below 30% wt. On the contrary, these operating problems were not encountered with the vane geometry, whatever the paste moisture content.
0,1 1 10 100 1000 10000 100000 1 10 100 Vi sc osi ty ( Pa .s) Shear rate (s-1)
Concentric cylinder
Parallel disk
Vane
The quasi linear evolution of the viscosity with the shear rate in a log-log plot shows that the granular paste had a sheer-thinning behavior. The viscosity measurements performed with the parallel disk geometry were significantly higher, by at least one order of magnitude, than those obtained with the two other geometries. On the other hand, the values obtained with the two other geometries were in the same range of magnitude, the concentric cylinder values being about 4 times higher than the vane values.
For the viscosity measurement, a variation coefficient (VC) was defined as the ratio of the standard deviation to the mean value for each shear rate. This VC was calculated for measurements with the three geometries. Whatever the geometry, the variation coefficient was higher at low shear rate. The parallel disk gave the largest variation coefficients, from 53% to 121%. The VC values were from 13% up to 60% with the concentric cylinders, and 0.6% up to 15% with the vane geometry. In the field of granular paste rheology, a VC ranging from 10% to 20% is very common due to various interactions between the particles and to geometry defects. [15]
According to these observations and measurements, accurate reproducibility was obtained when the shear rate applied was above 10 s-1. This was particularly the case for the vane geometry, which appears to be
the best approach for studying granular paste viscosity.
4.2. Determination of the sample preparation protocol
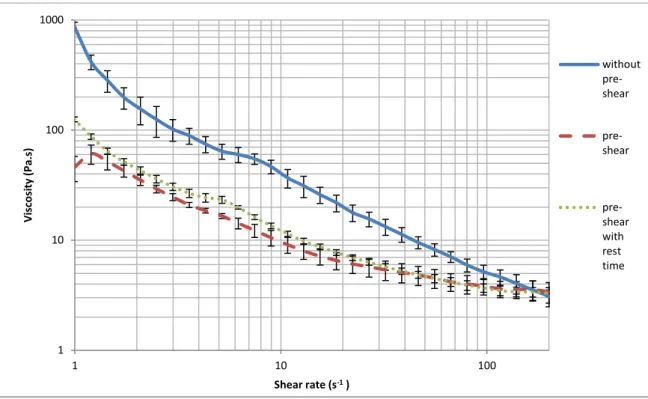
The viscosities measured at 18% moisture content on the vane geometry for three different preparation protocols are shown in Fig. 5. A paste moisture content value of 18% was chosen as it gave the highest viscosity.
Figure 5: Evolution of the viscosity with the shear rate for an 18% wt humidity paste, measured with vane geometry for three different sample preparation protocols.
The viscosity measurements were similar and repeatable when the sample preparation protocols included a pre-shear. The application of a rest time did not have an impact. The pre-shear enabled the particle to point in the rotational direction, resulting in almost identical viscosity. The viscosity measured was higher when the sample was not pre-sheared, especially when the shear rate applied was low. When the shear rate was higher than 140 s-1, identical paste viscosities were obtained for all protocols.
The variation coefficient VC and standard deviation were evaluated for each preparation protocol. At 18% moisture content, the VCs ranged from 9% to 31% without pre-shear, 4% to 26% with pre-shear and 3% to 10% for the pre-shear with rest time protocol, showing that the latter enabled the most repeatable viscosity measurement. It should be pointed out that this is also the most frequently reported by other researchers working with granular pastes [14; 15].
Since the better protocol was determined, a first observation on the slurry can be made. The viscosity profile with the moisture content was similar whatever the shear rate applied. The viscosity decreased with an increase in the shear rate, showing that the cerium (III) oxalate suspension exhibited a shear-thinning behavior.
1 10 100 1000 1 10 100 Vi sc osi ty ( Pa .s) Shear rate (s-1) without pre-shear pre-shear pre-shear with rest time
4.3. Moisture content transition values of a cerium(III) oxalate cake
All the measurements were made with the vane geometry by using the pre-shear with rest time sample preparation protocol. Fig. 1 presents three water-Cerium Oxalate mix at different moisture content from 15 to 70%. Three different behaviors can be highlighted. The driest cake behaved like a granular solid able to flow. A cake sufficiently humid exhibited a sticky paste behavior, unable to flow. The highest moisture content cake was a suspension with liquid-like appearance that flowed easily.
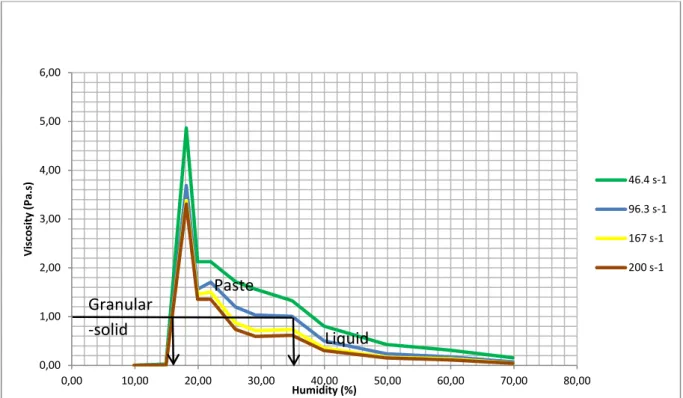
The evolution of the viscosity of cerium (III) oxalate cake according to its moisture content for four different shear rates is given in Fig. 6. The measurements were done on 12 points from 10 to 70% wt moisture content (10%, 15%, 18%, 20%, 22%, 26%, 30%, 35%, 40%, 50%, 60%, 70%). The different parts of the curves can be linked to the observations made in Fig. 1. Indeed, for moisture content lower than X1, the granular solid
behavior implies difficulties to measure viscosity. The curve of the viscosity as a function of moisture content tends to 0 as the moisture content tends to 0, as the viscosity can’t be measured precisely. For a wetter cake, the increase in moisture content resulted in a change in appearance and rheology to become a sticky paste. For moisture content X1, which represents the transition between a solid granular and a sticky paste behavior, the
viscosity was at its maximum. When moisture content grew until X2, the viscosity decreased and reached a
plateau value. For higher moisture content than X2, the cake behaved like a liquid and the more water was added,
the lower the viscosity was. Two transition values can be highlighted: X1, value of the solid granular/sticky paste transition which corresponds to the highest value of the curve representing the viscosity as a function of moisture content, and X2, at the end of the plateau and that represents the transition between a sticky paste and a liquid behavior. In the range of investigated operating conditions, the viscosity profile with the moisture content was similar for the different shear rate applied.
Figure 6: Evolution of the viscosity at four constant shear rates with different paste humidity levels.
In an industrial process, the wet cake is generally transferred from the filter to the dryer typically by a worm drive of 10 up to 20 cm diameter rotating at a speed of approximately 0.5 to 1 rev/s, which is equivalent to a range of shear rate from 50 to 200 s-1 on the vane geometry. The viscosity measured at a shear rate of 96.3
s-1 with the vane geometry was therefore taken to identify the transition moisture content values of the cake,
even if the shear rate seemed to have no influence on the mixture behavior.
Fig. 6 shows that a cerium(III) oxalate cake with approximately 35% wt moisture content reached the end of a the viscosity plateau at a shear rate of 96.3 s-1. Above 35%, the suspension behaved like a liquid with a
low viscosity level. Below 35% wt moisture content, the interactions between the particles became more intense due to a higher solid concentration, steadily increasing the viscosity as the moisture content decreased. A sticky paste started to form. At 18% mean moisture content in particular, the value of X1, cerium (III) oxalate has a dual
behavior: solid and paste (see Fig. 7). In the hydrated area, a paste can be observed, whereas in the non-hydrated area, solid aggregates can be identified. Consequently this method allows, the determination of the transition value X1 with a few percent accuracy. These values are only relevant for the model substance considered.
0,00 1,00 2,00 3,00 4,00 5,00 6,00 0,00 10,00 20,00 30,00 40,00 50,00 60,00 70,00 80,00 Vi sc osi ty ( Pa .s) Humidity (%) 46.4 s-1 96.3 s-1 167 s-1 200 s-1
Liquid
Paste
Granular
-solid
Figure 7: Dual behavior of cerium (III) oxalate at 16% humidity: non-hydrated solid aggregates and hydrated paste
Below 18% moisture content, there was not sufficient water to fully hydrate the cerium (III) oxalate cake, causing a greater proportion of solid aggregates to appear. Atmospheric air was enclosed in the space between the aggregates (see Fig. 8), resulting in a decrease of the viscosity measured. A solid behavior was observed.
Figure 8: Formation of solid aggregates at 15% humidity, showing low viscosity
Observations with the naked eye and the viscosity profile with the moisture content enabled the identification of two moisture content transition values. The cake behavior resembled a fluid-liquid suspension above the limit of 35%wt, and a flowing powder below 18% wt, due to the formation of a great proportion of solid aggregates.
5. Conclusion
Non-hydrated area: Solid aggregatesHydrated area: Paste
In industry, operations dealing with solids quite often limit plant productivity and necessitate a large labor force in order to ensure sufficient reliability. This study provides a new method to predict the transferability of a wet cake from a filter to a dryer or furnace that can be applied to any solid-liquid system. It was demonstrated on a model system that the moisture content of the wet cake obtained at the end of the filtration must be controlled in order to ensure an easier transfer operation. At the same time this minimizes the loss of valuable product throughout the different parts of the transfer system. With a sticky paste, a difficult transfer operation and significant loss with crusting of solids within the transfer mechanical system may occur.
The method is based on the analysis of wet cake rheological behavior. The first recommendation is to use a rheometer equipped with a vane geometry, since the measurements are sufficiently reproducible with the variation coefficient of 15%. A second recommendation is to define a sample preparation procedure prior to rheological measurement. On the model system, a pre-shear period followed by a rest time was selected. The third recommendation is to select a shear rate representative of that induced by the transfer technology used in the plant (often a worm drive). It is then possible to select two moisture content transition values for the wet cake. Below the first transition, a granular solid behavior was observed here due to the formation of a greater proportion of solid aggregates, resulting in low viscosity and good transferability. Between the two transitions, the cake behaved like a moderately hydrated sticky paste. It showed high viscosity levels due to the numerous interactions between the solid particles. A difficult transfer operation and significant loss with crusting of solid within the transfer mechanical system may occur. Beyond the second transition, the wet cake was sufficiently humid to behave like low viscosity slurry, since the particles were not concentrated enough to be in contact with each other and thus remained separate. For the model system investigated in this study, the two threshold values for moisture content were 18% wt and 35% wt relatively. The first value X1 of 18% wt moisture content is the maximum acceptable after the filtration step to insure the transferability in a solid form through the process. If a liquid form is wanted for the transfer, the value X2 of 35% wt moisture content is a minimum to reach.
Further studies should be carried out with other model systems in order to relate particle features (size distribution, morphology, etc.) to the transition values. A better understanding of relationships between particle characteristics and cake behavior may help in preventing transfer difficulties at plant scale.
List of notations
Greek symbols
δ(ϕ2): isotropic term γ̇: Shear rate (s-1) Γ: dimensionless number; Γ=Kηγb² ∅0η: Dynamic viscosity (Pa.s)
ηs: Viscosity of the interstitial fluid (Pa.s)
ηr: Relative viscosity of a suspension
[η]: Intrinsic viscosity ϕ: Solid volume fraction ϕ0: Energy barrier (J)
ϕc: Critical volume fraction
ϕm: Maximum solid volume fraction
Ω: Rotation speed (rps)
Latin symbols
Ba: Bagnold number
b: characteristic mean distance between the two centers of neighboring particles (m) e: Gap (m)
h: Height (m)
K: coefficient which depends on the shape and size of the particle and on its orientation Le: Leighton number
Nr: dimensionless number; Nr=kT∅0
Pe: Peclet number
r: Distance from the axis (m)
RA: Radius of the blades in the vane geometry (m)
RB: Radius of the big cylinder in vane geometry (m)
Re: Reynolds Number T: Temperature (K) X: Moisture content
References
[1]: P. Coussot; C. Ancey, Rheophysical classification of concentrated suspensions and granular pastes, Phys. Rev. E 59, 1999, 4, 4445-4457.
[2]: C. Ancey; P. Coussot; P. Evesque, A theoretical framework for granular suspensions in a steady simple
shear flow, J. Rheol., 1999, 43(6), 1673-1699.
[3]: D. Leighton; A. Acrivos, The shear-induced migration of particles in concentrated suspensions, J. Fluid Mech., 1987, 181, 415-439.
[4]: R. A. Bagnold, 1954 Experiments on a gravity-free dispersion of large solid spheres in a Newtonian fluid under shear. Proc. R. Soc. Lond. A 225, 49–63.
[5]: N. Huang. Rhéologie des pâtes granulaires. Data Analysis, Statistics and Probability.Université Pierre et Marie Curie - Paris VI, 2006. French. <tel-00174291>
[6]:C. Ancey, Role of lubricated contacts in concentrated polydisperse suspensions, J. Rheol., 2001, 45, 1421-1439.
[7]: A. Einstein, Investigation on the Theory of the Brownian Movement, 1956.
[8]: J.C. Van der Werff ; C.G. de Kruif, Hardsphere Colloidal Dispersions : The Scaling of Rheological Properties
with Particle Size, Volume Fraction and Shear Rate, J. Rheol., 1989, 421-454.
[9]: I.M. Krieger; T.J. Dougherty, A mechanism for non-Newtonian flow in suspensions of rigid spheres, T. Soc. Rheol., 1959, 3, 137-152.
[10]: A. Ogawa; H. Yamada; S. Matsuda; K. Okajima; M. Doi, Viscosity equation for concentrated suspensions
of charged colloidal particles, J. Rheol., 1997, 41(3), 769-785.
[11]: C. Tsenoglou, Scaling concepts in suspension rheology, J. Rheol., 1990, 34, 15-24.
[12]: D. Quemada, Rheological modelling of complex fluids. I. The concept of effective volume fraction
revisited, Eur. Phys. J. AP, 1998, 119-127.
[13]: H.A. Barnes; Q.D. Nyugen, Rotating Vane Rheometry-A Review, J. N.-Newt. Fluid Mech., 2001, 1-14. [14]: F. Da Cruz; F. Chevoir; D. Bonn ; P. Coussot, Viscosity bifurcation in granular materials, foams and
emulsions, Phys. Rev. E 66, 2002, 051305, 1-7.
[15] : Chong Hu. Rhéologie des bétons fluides. Mechanics [physics.med-ph]. Ecole Nationale des Ponts et Chaussées, 1995. In French.
[16] : Stickland, A. D., et al. (2015). The effect of premature wall yield on creep testing of strongly flocculated suspensions. Rheologica Acta, 54(5), 337-352.