HAL Id: hal-01672516
https://hal.archives-ouvertes.fr/hal-01672516
Submitted on 3 Jan 2018
HAL is a multi-disciplinary open access
archive for the deposit and dissemination of
sci-entific research documents, whether they are
pub-lished or not. The documents may come from
teaching and research institutions in France or
abroad, or from public or private research centers.
L’archive ouverte pluridisciplinaire HAL, est
destinée au dépôt et à la diffusion de documents
scientifiques de niveau recherche, publiés ou non,
émanant des établissements d’enseignement et de
recherche français ou étrangers, des laboratoires
publics ou privés.
Amara, Pavel Kuzhir
To cite this version:
Hinda Ezzaier, Jéssica Alves Marins, Sébastien Schaub, Abdesslem Ben Haj Amara, Pavel Kuzhir.
CAPTURE OF MAGNETIC NANOPARTICLES ON ORDERED MAGNETIZABLE ARRAYS: A
PARAMETRIC STUDY. Moscow International Symposium on Magnetism (MISM) 2017, Jul 2017,
Moscou, Russia. �hal-01672516�
*
Corresponding author: kuzhir@unice.fr
Capture of magnetic nanoparticles on ordered magnetizable
arrays: A parametric study
Hinda Ezzaier1,2, Jéssica Alves Marins1, Sébastien Schaub3, Ben Haj Amara2, and Pavel Kuzhir1,*
1University of Côte d’Azur, CNRS UMR 7010 IN
NI, Parc Valrose, 06108, Nice, France
2
Laboratory of Physics of Lamellar Materials and Hybrid Nano-Materials, Faculty of Sciences of Bizerte, University of Carthage, 7021 Zarzouna, Tunisia
3University of Côte d’Azur, CNRS, INSERM, iBV, Parc Valrose, 06100 Nice, France
Abstract. This work is devoted to the experimental study of the magnetic separation of medium sized
nanoparticles (40-70 nm) which are separated from the suspending fluid when the suspension flows through a micropillar array magnetized by an external magnetic field. The nanoparticle accumulation around micropillars is visualized and described by the capture efficiency and retention capacity, which are analysed in function of different dimensionless parameters, such as Mason number, dipolar coupling parameter, nanoparticle volume fraction, orientation of the flow with respect to the magnetic field and array’s geometry. The role of these parameters is interpreted in terms of the interplay between hydrodynamic and magnetic interactions, as well as taking into account possible field-induced phase separation. The results could be useful for the development of the microscale magnetic separators for biomedical applications.
1 Introduction
Small scale magnetic separation of magnetic particles has found numerous biomedical applications, such as cell separation [1], protein purification [2], control drug delivery and release [3] and immunoassays [4]. In most of these applications, micron sized beads bearing appropriate chemical groups on their surface are used, while the use of nanoparticles is limited because of strong Brownian motion hindering attractive interactions with magnetized collectors. However, phase separation or aggregation induced by an applied magnetic field have been found to significantly enhance these interactions leading to stronger magnetophoretic mobility of particles [5] and better separation efficiency [6]. The reason is that the magnetic force experienced by micron-sized aggregates is much larger than that of individual nanoparticles. This will likely allow replacement of microbeads by nanoparticles in aforementioned applications for which high specific surface and good colloidal stability are unconditional advantages of nanoparticles with respect to microbeads.
In our previous work, we have demonstrated an efficient capture of magnetic nanoparticles of a mean size about 80 nm on an ordered array of nickel micropillars incorporated into a microfluidic channel [7]. The micropillars were magnetized by an external uniform magnetic field of an intensity 6-10 kA/m. However, the capture efficiency (related to the ratio of the inlet-to-outlet particle concentration) appeared to be a strongly decreasing function of the flow speed and of
the Mason number: 1.78
Ma
that was explained by flow-induced rupture of the particle aggregates.
To optimize the capture efficiency keeping low values of the applied magnetic field, we have to establish and understand the effects of numerous parameters (other than Ma) on the nanoparticle capture, such as dipolar coupling parameter, nanoparticle concentration, magnetic field orientation and geometry of micropillar arrays. This work is dedicated to an extensive parametric study of the magnetic separation process on ordered magnetizable arrays. To this purpose, we visualize the process of accumulation of magnetic nanoparticles around the micropillars when the nanoparticle suspension flows across the micropillar array in the presence of an externally applied magnetic field. Growth of the nanoparticle deposits with time allows analyzing the capture efficiency as function of numerous dimensionless parameters. In the next Section 2, we briefly describe the experimental setup and protocol. The results of the visualization experiments and parametric studies are presented in Section 3. The conclusions and perspectives are outlined in Section 4.
2 Experimental setup
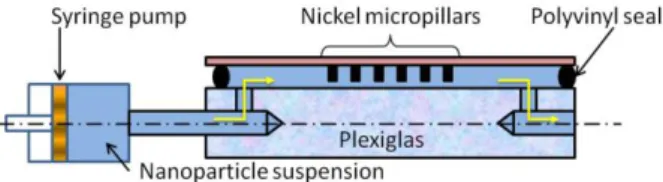
A sketch of the microscale channel equipped with an array of nickel micropillars is presented in Fig.1. Briefly, micropillar arrays were created on a glass substrate by electroplating and soft photolithography, as described in [7]. Square and hexagonal arrays were used with the micropillar expected diameter, expected height and the distance between the pillar axes equal to dm=50 µm,
glass cover to the Plexiglas substrate through an aluminium lid not shown in Fig.1. This design has an advantage of easy disassembling required for frequent cleaning of the cell, as opposed to permanently sealed microfluidic channel used in [7].
Water dispersions of iron oxide nanoparticles (ferrofluids) were synthesized by co-precipitation of iron salts in alkali medium and stabilized by a double layer of oleate ions, as described in detail in [8]. Using this method, instead of isolated nanoparticles (8-12 nm), permanent isotropic nanoclusters composed of numerous nanoparticles were obtained. These nanoclusters possessed an induced magnetic moment and had zero remnant magnetization. Since nanoclusters (40-70 nm) are the smallest structural units involved into magnetic separation process, they will be hereinafter called nanoparticles in order to avoid confusion with field-induced aggregates. The two synthesized ferrofluids, labelled as F1 and F2, contained nanoparticles of a mean diameter of dn=68 nm and 42nm, respectively, as
measured by dynamic light scattering and confirmed by transmission electron microscopy. The primary ferrofluids F1 and F2 were diluted at desired particle concentrations by distilled water.
Fig. 1. Microscale channel with a micropillar array
A dilute suspension of magnetic nanoparticles was pushed through the channel with a desired flow rate Q using a syringe pump Harvard PHD Ultra (United States). The flow velocity u was estimated as u=Q/S, where S is the channel cross-section. The channel was settled on the stage of an inverted microscope Diaphot (Nikon, Japan). Images were collected in transmission light with a four-fold objective and a CMOS camera PL-B742U (PixelLINK, Canada). An external uniform magnetic field was generated with a pair of Helmholtz coils equipped with iron yokes and placed around the microscope. The angle between the external field H0 and
the main flow was changed in the range =0–90° by turning the flow cell on the microscope stage.
The following experimental protocol was adopted. First, the suspension was pushed through the channel at a desired velocity u in the absence of magnetic field for 5 minutes. Then, a magnetic field of a desired intensity H0
was applied. The nickel micropillars got magnetized and started to attract magnetic nanoparticles and separate them from the suspending liquid (water). Snapshots of nanoparticle accumulation around micropillars (such as shown in Fig.2) were taken every minute for 60 minutes from the moment of field application. For quantification
occupied by nanoparticle deposits to the whole area of the micropillar array. The image processing allowed obtaining experimental dependencies of the relative deposit area, s, versus the elapsed time t. In each case, the experimental s(t) curves were satisfactorily fitted to the following semi-empirical filtration law [7]:
0 ( ) m 1 exp m ut s t s s L (1)
where 0 is the nanoparticle volume fraction at the
channel inlet; ≈0.70 is the internal volume fraction of the deposit; L=1.3-1.5 mm – array’s dimension in the direction of flow; =ln(0/out) is the capture efficiency
in the beginning of separation (t=0), this magnitude is related to the inlet (0) and outlet (out) nanoparticle
volume fractions; and sm is the maximum relative deposit
area at long times (t), this magnitude characterizes the maximum amount of nanoparticles that the filter is able to capture and is hereinafter called the retention capacity. Typical s(t) curves have been presented in our previous work [7]. The magnitudes and sm are two
fitting parameters depending on microscopic details of the particle capture. These magnitudes are analyzed in Section 3.2 as a function of different dimensionless parameters governing separation.
3 Results and discussion
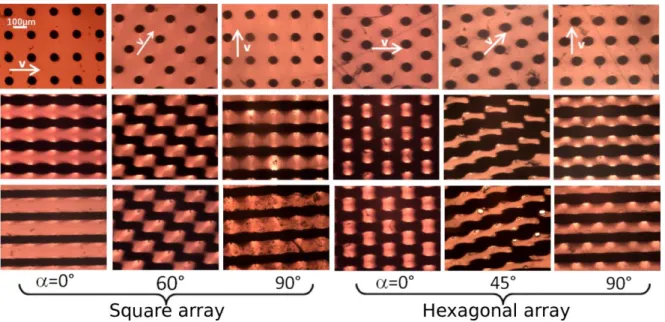
3.1 Visualisation of particle depositsSome snapshots showing nanoparticle deposits around the micropillars are shown in Fig.2. The upper row of the snapshots shows the top view of the micropillar arrays without captured nanoparticles, the middle and the bottom rows show nanoparticle deposits for the sample F1 at the flow speeds u=7.1410-4 m/s and 2.1410-3m/s,
respectively, at an applied magnetic field H0=13.5 kA/m,
inlet particle volume fraction 0=0.3% and elapsed time t=60 min. Different columns correspond to different
angles between the flow (whose direction is indicated by white arrows) and the magnetic field (horizontal for each snapshot). The three left columns show the capture on the square array, while the right three columns – on the hexagonal array.
In most of the snapshots, the nanoparticle deposits exhibit wavy patterns interconnecting the neighbouring micropillars and having a wavelength corresponding to the distance between them. In the beginning of the capture process (not shown in Fig.2), the nanoparticles are condensed in the vicinity of the micropillars and form concentrated elliptic deposits, which grow in the direction of the applied magnetic field until they touch each other. Percolation of primary elliptic deposits should explain wavy shape of the final deposits governed
Fig. 2. Snapshots of nanoparticles deposits around micropillars. The upper row shows naked micropillars without captured particles,
the second and the bottom rows show nanoparticle deposits for the sample F1 at the flow speed u=7.14x10⁻⁴ m/s and 2.14x10⁻³ m/s, respectively and for H0=13.5 kA/m, 0=0.3% and t=60 min. The applied magnetic field is horizontal for each snapshot.
by the stress balance on their surface. The flow intensity and orientation influence the shape of the deposits which evolve to a straight stripe pattern with increasing speed in the case of the square array with =0° [bottom left snapshot in Fig. 2] or to a honeycomb pattern in the case of the hexagonal array at =0° [4th column from the left of Fig.2]. The last pattern with the highest deposit area is possible thanks to a gap of a thickness H–h≈50 µm between the end surface of micropillars and the bottom Plexiglas surface of the channel [Fig.1] allowing the liquid to pass through the channel.
When the flow makes some angle 0°<<90° with respect to the magnetic field H0, the nanoparticle
deposits are no longer aligned with the applied magnetic field but show stair-like patterns making some angle with H0 different from . Again, these patterns appear as
a result of percolation of neighbouring deposits which find the optimal pathways for percolation depending on hydrodynamic drag and magnetic interactions between primary deposits. So, the descending stair-like pattern for the square array at =60° is formed by linking primary deposits in the direction of flow [2nd column
from the left in Fig.2], while ascending pattern for the hexagonal array at =45° is formed by linking the deposits in the direction of the applied field [2nd column from the right in Fig.2]. In the case of the flow perpendicular to the magnetic field (=90°), the patterns are quite similar to those observed for the flow parallel to the field (=0°) except some asymmetry with respect to the horizontal axis (magnetic field direction) [3rd and
the last columns of Fig.2].
Comparing the middle and the bottom rows of Fig.2, it is seen that the size of the deposits decreases with the flow speed because of the larger hydrodynamic stresses acting on the deposit surface and washing away nanoparticles. Comparing the left three columns with the right three right three columns, it is quite obvious that the hexagonal array generally captures more
nanoparticles than the square array. This can be explained by simple geometrical considerations. In fact, at the same distance between micropillars and at the same size of the primary elliptical deposits, the distance between the surfaces of primary deposits is closer for the hexagonal array allowing easier percolation and junction at several points, as in the case of honeycomb structure at =0°. In summary, the array geometry and mutual orientation of the flow and of the magnetic field are crucial parameters defining the structure of the nanoparticle deposits and the retention capacity sm
[Section 2]. The parameters and sm quantifying
magnetic separation will be inspected in details in the next Section 3.2.
3.2 Capture efficiency and retention capacity Experiments show that the micropillars capture a small amount of nanoparticles in the absence of field, while the capture is significant in the presence of moderate magnetic fields 4.8≤H0≤13.5 kA/m. This signifies that
colloidal interactions are negligible as compared to magnetic ones. In this case, the capture of magnetic nanoparticles is mostly governed by hydrodynamic (Fh)
and magnetic (Fm) forces and can be affected by
Brownian motion. Comparison of orders of magnitudes of these forces (or energies U) allows definition of the three following dimensionless parameters: (a) Mason
number 2 2
0 0 0
/ 6 /( )
h m m n n
MaF F ud H d ; (b)
dipolar coupling parameter
2 2 3 0 0 /( ) /(12 ) m B n n B U k T H d k T ; and (c) Péclet number Peudm/Dn30ud dn m/(k TB )6Ma/n,
where 0≈10-3 Pas is the suspending liquid (water)
viscosity; 0=410-7 H/m is the vacuum magnetic
permeability; n≈0.9 is the magnetic contrast factor of
different data better collapse when plotted against Mason number. Thus, in what follows, the magnitudes and sm
will be mostly analysed as function of Mason number. Mason number dependencies of and sm are shown
in Fig. 3 for two different particle diameters dn (samples
F1 with dn=68 nm and F2 with dn=42 nm) and three
different values of the applied magnetic field H0 while
the particle concentration (0=0.3%), flow orientation
(=0°) and arrays’ geometry (square) are kept constant. Variations of dn and H0 result in a variation of the dipolar
coupling parameter in the range 0.13.7. Three experimental versus Ma curves, corresponding to
≥0.5, are gathered along a straight line in log-log scale and fitted by a scaling law Ma-2 (dashed line on Fig.
3a), while the fourth curve with ≈0.1 shows a weaker Mason number dependency. Experiments show that nanoparticle suspensions undergo phase separation with appearance of bulk aggregates at ≥0.5 and 0=0.3%1.
Intense shear flows around the micropillars can disrupt nanoparticles from aggregates such that the aggregate size is expected to be a decreasing function of the flow speed u and of the Mason number. The combination of this effect with increasing convective flux washing away the aggregates from the micropillars could explain a strong decrease of the capture efficiency with Mason number (Ma-2) for ≥0.5. The theoretical model
assuming chain-like clusters instead of observed bulk needle-like aggregates predicts a quite similar behaviour (Ma-1.7) [7]. Furthermore, collapse of the
experimental Mason number dependencies for ≥0.5 signifies that the capture is governed by the interplay between magnetic and hydrodynamic forces, while the Brownian motion of bulk aggregates is expected to be very weak. Nanoparticle suspensions do not exhibit phase separation at =0.1 and 0=0.3%. In this case, the
capture efficiency of individual nanoparticles is only defined by a compromise between convective, magnetophoretic and diffusive fluxes. A simple model neglecting diffusive flux predicts the following Mason number dependency in the limit Ma>>1 [7]:
1 2 16 (1 ) m cL Ma c d (2)
where c is the volume fraction of the micropillars with respect to the total array’s volume; c≈0.09 and 0.10 for the square and hexagonal arrays, respectively. The theoretical dependency [Eq. (2), solid line in Fig. 3a] agrees relatively well with experimental points for ≈0.1
1
Field-induced phase separation is possible at such low values of because both samples F1 and F2 have relatively broad particle size distribution; the largest particles with the size above 100 nm are assumed to form the dense phase (aggregates) while the smallest ones remain in a dilute phase, as suggested in numerous works – see for example [9].
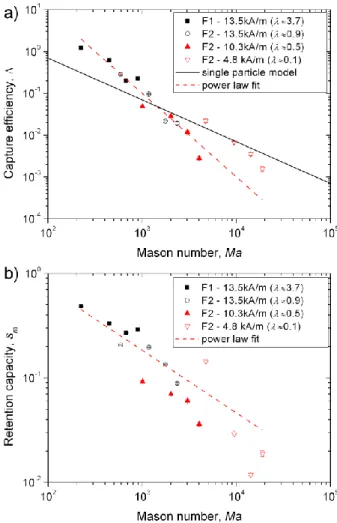
Fig. 3. Mason number dependency of the capture efficiency (a)
and retention capacity (b) at different dipolar coupling parameter and fixed values of 0=0.3%, =0° and for the
square array. Solid line in (a) stands for the prediction of the single particle model [Eq. (2)]. Dashed lines in (a) and (b) correspond to a power-law fit of the experimental data.
The retention capacity fits to an approximate scaling law
smMa-0.6±0.1 but the data are much more dispersed
around the fitting curve [dashed line on Fig. 3b]. The maximum size of deposits is expected to decrease with increasing diffusive nanoparticle flux responsible for nanoparticle “evaporation” from the deposit surface. This could explain generally lower retention capacities for lower dipolar coupling parameters , as observed in Fig. 3b.
The effect of the particle volume fraction 0 is
inspected in Fig.4 where Mason number dependencies of and sm are shown for different values of 0 and for two
samples F1 and F2 at constant magnetic field intensity (H0=13.5 kA/m), the flow orientation (=0°) and the
array’s geometry (square). Experiments show that the suspensions undergo phase separation for all the curves presented in Fig. 4. The Mason number dependencies of the capture efficiency are spread around a master curve
Fig. 4. The same as in Fig.3 but at different particle volume
fractions 0 and for two different samples (F1 and F2) at fixed
values of H0=13.5 kA/m, =0° and for the square array. The
dashed line in (a) corresponds to a fit of all the data by a single curve Ma-2, while two dashed curves in (b) correspond to the fit of the data at 0=0.3% and 0=0.075% by two distinct
curves having the same scaling behaviour smMa-0.6±0.1.
with a scaling law Ma-2 [dashed line in Fig. 4a] inherent for phase separating colloids, while there is no clear effect of the particle volume fraction. This is in agreement with the scenario of destructible aggregates [7] where their size and interaction with micropillars depend entirely on Mason number but not on particle concentration, at least in the beginning of separation when the dilute limit applies in the whole volume of the filter. The Mason number dependencies of the retention capacity follow previously found scaling law
smMa-0.6±0.1 but no longer collapse on a single curve for
different particle concentrations and show an increase of
sm with increasing 0 [Fig. 4b]. This is probably because
the dilute limit approach is no longer valid for the concentrated deposits and their size is expected to grow with the inlet particle concentration because of enhanced magnetic interactions between nanoparticles that result in larger deposit sizes, as has been previously shown for separation on single collectors [8].
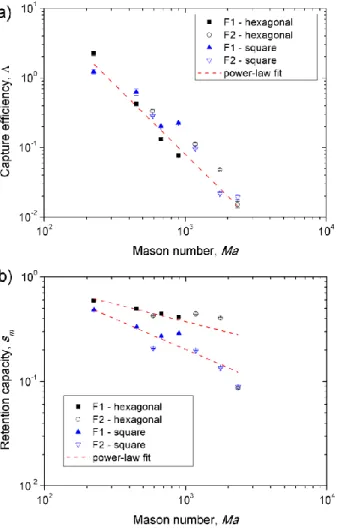
The effect of the array’s geometry is shown in Fig.5 where and sm versus Ma dependencies are plotted for
square and hexagonal arrays and for two different particle sizes (samples F1 and F2) at constant nano-
Fig. 5. The same as in Fig.3 but for different array geometries
(square and hexagonal) and for two different samples (F1 and F2) at fixed values of H0=13.5 kA/m, =0°, and 0=0.3%. The
dashed line in (a) corresponds to a fit of all the data by a single curve Ma-2, while two dashed curves in (b) correspond to the fit of the data for the square and hexagonal arrays by two distinct curves, smMa-0.6±0.1 and smMa-0.34±0.11, respectively.
particle volume fraction (0=0.3%), field intensity
(H0=13.5 kA/m) and the flow orientation (=0°).
Field-induced phase separation is observed for all the experimental data on Fig.5. Again, the data on the capture efficiency collapse on a single master curve Ma-2 [dashed line on Fig. 5a], while the data on the
retention capacity are regrouped along two different curves corresponding to both considered geometries:
smMa-0.60±0.10 for square arrays and smMa-0.34±0.11 for
hexagonal arrays [dashed curves on Fig. 5b]. The array’s geometry does not influence the initial capture efficiency likely because, in the beginning of separation, the nanoparticle trajectories in the vicinity of a given micropillar are expected to be weakly influenced by the geometrical disposition of the neighbouring pillars provided that they occupy only about 10% of the array volume (c≈0.1). On the other hand, the hexagonal array has a larger retention capacity than the square array (in agreement with observations on Fig.2) likely because hexagonal arrays favour more easily percolation of the primary elliptical deposits, as has been supposed in Section 3.1.
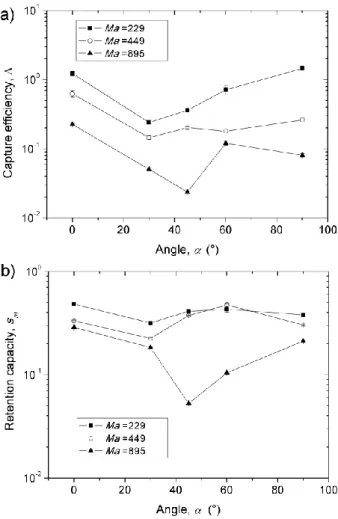
Fig. 6. Dependences of the capture efficiency and retention
capacity on the angle between the flow and the magnetic field for different values of Ma, at fixed values of H0=13.5
kA/m, 0=0.3%, and for the sample F1 and the square array.
The effect of the flow orientation with respect to the applied magnetic field is inspected on Fig. 6 where and sm are plotted as function of the angle for different
values of Mason number. The capture efficiency exhibits a minimum at some intermediate angles [Fig. 6a]. It can be shown that the change of the field orientation significantly changes the local distribution of Mason numbers in the vicinity of micropillars that affects mechanical stability of the nanoparticle aggregates and modifies their size and therefore their capture efficiency. This scenario has to be studied in detail in order to confirm if it can explain a non-monotonic versus function. The effect of the flow orientation on the retention capacity is even less clear because there is a minimum of sm()-function for Ma=895 but there is no
pronounced effect at Ma=229 and 449 [Fig. 6b].
4 Conclusions
We presented a detailed experimental study of the effect of different dimensionless parameters on the magnetic separation of medium-sized nanoparticles (40-70 nm) on ordered arrays of magnetizable micropillars. Visualization of suspension flows across micropillar arrays allowed us to follow formation and growth of nanoparticles deposits and extract two major parameters
being nearly independent of the dipolar coupling parameter (in the range 0.53.7), of the nanoparticle volume fraction (at 0.07500.3%) and on the array’s
geometry (square or hexagonal). The Mason number behaviour changing from Ma-2 to Ma-1 has been explained by transition from destructible nanoparticle aggregates (appearing as a result of field-induced phase separation) at ≥0.5 to isolated nanoparticles at <0.5. A non monotonic dependence on the angle with a minimum of at intermediate angles is less clear and has been tentatively explained by an effect of on mechanical stability of aggregates near the micropillars. The retention capacity has also been found to be a decreasing function of Mason number (typically
smMa-0.6) however it also depends on all other
parameters (increases with and 0 and is larger for the
hexagonal array than for the square array). Tuning the array’s geometry and mutual orientation of the flow and of the magnetic field allows generation of particular patterns of nanoparticle deposits minimally affected by the flow and providing a maximized retention capacity. This could be useful for development of microscale magnetic separators for biomedical applications.
For the deeper understanding of the above reported effects, numerical modelling of the separation process incorporating trajectory analysis and field-induced aggregation has to be conducted in future.
The authors acknowledge C. Claudet and F. Lippi for the channel design and fabrication. This work has been supported by French RENATECH network and its FEMTO-ST technological facility. P.K. acknowledges UCA Jedi through its “action du site” and “AAP Academy 2” projects ImmunoMag and MagFilter; H.E. acknowledges FSB through its PhD collaboration fellowship and J.A.M is grateful to CNPq though its postdoctoral fellowship (No. 203100/2014-0).
References
[1] M. Zborowski and J. J. Chalmers, Magnetic Cell
Separation (Elsevier, Amsterdam, 2008).
[2] C. Okoli, A. Fornara, J. Qin, M. S. Toprak, G. Dalhammar, M. Muhammed, and G. Rajarao, J. Nanosci. Nanotechnol. 11, 1533 (2011).
[3] J. Esterlich, E. Escribano, J. Queralt, and M.-A. Busquets, Int. J. Mol. Sci. 16, 8070 (2015).
[4] M. A. M. Gijs, F. Lacharme, and U. Lehmann, Chem. Rev.
110, 1518 (2010).
[5] G. De Las Cuevas, J. Faraudo, and J. Camacho, J. Phys. Chem. C 112, 945 (2008).
[6] P. Kuzhir, C. Magnet, H. Ezzaier, A. Zubarev, and G. Bossis, J. Magn. Magn. Mater. 431, 84 (2017).
[7] G. Orlandi, P. Kuzhir, Y. Izmaylov, J. Alves Marins, H. Ezzaier, L. Robert, F. Doutre, X. Noblin, C. Lomenech, G. Bossis, A. Meunier, G. Sandoz, and A. Zubarev, Phys. Rev. E
93, 062604 (2016).
[8] C. Magnet, P. Kuzhir, G. Bossis, A. Meunier, L. Suloeva, and A. Zubarev, Phys. Rev. E 86, 011404 (2012).