Genome analysis
genomation: a toolkit to summarize, annotate
and visualize genomic intervals
Altuna Akalin
1,*
,†,‡, Vedran Franke
2,†, Kristian Vlahovicˇek
2,5,
Christopher E. Mason
3,* and Dirk Schu¨beler
1,4,*
1
Friedrich Miescher Institute for Biomedical Research, 4058 Basel, Switzerland,
2Bioinformatics Group,
Department of Molecular Biology, Faculty of Science, University of Zagreb, 10000 Zagreb, Croatia,
3Department of
Physiology and Biophysics and the Institute for Computational Biomedicine, Weill Cornell Medical College, New
York, NY 10021, USA,
4Faculty of Science, University of Basel, 4051 Basel, Switzerland and
5Department of
Informatics, University of Oslo, NO-0316 Oslo, Norway
‡
Present address: Bioinformatics platform, Berlin Institute for Medical Systems Biology (BIMSB), Max Delbru¨ck
Center (MDC), Robert-Ro¨ssle-Straße 10, 13125 Berlin, Germany.
†
The authors wish it to be known that, in their opinion, the first two authors should be regarded as Joint First
Authors.
*To whom correspondence should be addressed. Associate Editor: John Hancock
Received on May 14, 2014; revised on November 14, 2014; accepted on November 17, 2014
Abstract
Summary: Biological insights can be obtained through computational integration of genomics data
sets consisting of diverse types of information. The integration is often hampered by a large variety
of existing file formats, often containing similar information, and the necessity to use complicated
tools to achieve the desired results. We have built an R package, genomation, to expedite the
ex-traction of biological information from high throughput data. The package works with a variety of
genomic interval file types and enables easy summarization and annotation of high throughput
data sets with given genomic annotations.
Availability and implementation: The software is currently distributed under MIT artistic license
and
freely
available
at
http://bioinformatics.mdc-berlin.de/genomation,
and
through
the
Bioconductor framework.
Contact:
[email protected],
[email protected],
[email protected],
or
[email protected]
1 Introduction
Genomic intervals are the basis of genome annotation and are widely used in short-read alignments, where an interval represents the location of an aligned read. In addition, intervals can contain a variety of scores, with different scales, such as conservation, percent methylation and ChIP-seq enrichment. Summarization of these in-formation-rich intervals over different sub-genomic contexts (pro-moters, exons, enhancers, etc.) is the necessary first step in making
inference about the biological importance of the data. Throughout the text we use the phrase ‘genomic annotation’ to refer to the re-gions of the genome associated with a potential function or rere-gions of interest, which do not necessarily have a score (examples: CpG is-lands, genes, enhancers, promoter, exons, etc.). These genomic an-notations provide anchor points, and the general distribution of genomic intervals at and in vicinity to these annotations can assist in biological interpretation of the data.
VCThe Author 2014. Published by Oxford University Press. All rights reserved. For Permissions, please e-mail: [email protected] 1127 Bioinformatics, 31(7), 2015, 1127–1129
doi: 10.1093/bioinformatics/btu775 Advance Access Publication Date: 21 November 2014 Applications Note
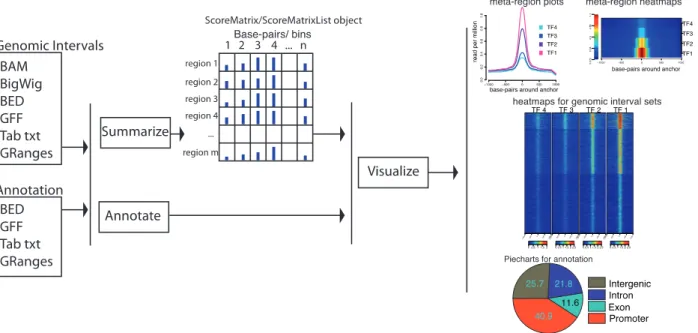
In order to facilitate the extraction of knowledge from genomic intervals, we have developed the R package genomation. This pack-age is a toolkit for annotation and bulk summarization, and visual-ization of genomic intervals over predefined genomic annotations. genomation is designed to work with genomic intervals stored either in (i) arbitrarily formatted text files containing minimal information about the chromosome, start and end, or (ii) in compressed formats such as BAM (Li et al., 2009) and BigWig (Kent et al., 2010). The package provides functions for computing fast summary statistics about the level of association of genomic intervals with the desired annotation and enables simultaneous visualization of multiple high-throughput experiments over regions of interest through parallel heatmaps, meta-region (meta-gene, meta-promoter, etc.) plots, coverage distribution profiles and pie charts for overlap with anno-tation (features summarized inFig. 1). In addition, the data struc-tures used in the package can easily be integrated to other analysis in R/Bioconductor (Gentleman et al., 2004; R Core Team, 2013), which provides a multitude of possibilities for downstream analysis.
2 Software features
2.1 Data import
The readGeneric() function can read any tabular file containing minimal information about chromosome, start and end positions in addition to any meta-data that can be associated with those genomic locations. In addition to that, readBed() and readGFF() can read BED and GFF formatted files. The genomic intervals contained in the flat files will be represented in memory as Granges objects from GenomicRanges package (Lawrence et al., 2013). These func-tions can be used to read both the genomic intervals to be summar-ized, and the genomic annotations.
2.2 Annotation of genomic intervals
Searching for association between different genomic data sets is a standard exploratory method in computational genomics. Typically, we would like to know whether our genomic intervals overlap with previously known annotation and the amount of overlap between
those sets. annotateWithFeature() and annotateWithGene Parts()annotate a genomic interval set of interest with a known annotation set such as ChIP-seq peaks or exon/intron/promoter structure of the genes. These results can be visualized with plotGeneAnnotation()or plotTargetAnnotation().
2.3 Summary and visualization of genomic intervals
over pre-defined regions
One of the fundamental functionalities of genomation is the ability to summarize genomic intervals over predefined regions. These sum-maries represent matrices of scores or coverage values for each pre-defined region. The prepre-defined regions do not have to have the same length. If that is the case, each region will be binned to equal number of bins and a summary statistic (such as mean or median) will be cal-culated for each bin, keeping the result in a rectangular matrix for-mat in a package-specific object forfor-mat. The basic functions for constructing matrices are ScoreMatrix() and ScoreMatrix Bin(). The functions have two main mandatory arguments: first is the list of genomic intervals (with or without a score) in the format of GRanges objects, BAM or BigWig files and the second is the list of pre-defined regions such as GRanges objects. These functions will return a ScoreMatrix object or a ScoreMatrixList object that contains multiple matrices, representing the enrichment of mul-tiple experiments over the same sub-genomic set.
Such matrices can be visualized in multiple ways. A simpler way of visualization is to construct meta-region plots by taking the average values of the columns and plotting those averages as line plots. The se-cond approach is to make heatmaps for each average profile and stack them on top of each other (Stadler et al., 2011). We have implemented these possibilities in genomation as metaPlot() and metaHeat() functions. Lastly, we can visualize whole matrices as heatmaps (see
Fig. 1). We also implemented functions to visualize the score matrices
and score matrix lists as a heatmap or a set of heatmaps (heatMatrix() and multiHeatMatrix()) using low-level graphics functions, entirely re-writing heatmap to be able to visualize high-dimensional data efficiently. These functions can also employ K-means clustering to plot the rows of the matrices ordered by their
Fig. 1. Diagram outlining capabilities of the genomation package, where raw data are summarized, annotated and visualized. The raw data can be in multiple for-mats such as BED, GFF, BAM and BigWig, as wells as GRanges objects
similarity (Hartigan and Wong, 1979). In addition, users can provide their own ordering or clustering for the heatmaps.
3 Conclusion
genomation is a versatile toolkit for interrogating diverse types of genomic intervals with or without scores. It significantly reduces the time needed for data processing and biological inference by provid-ing a multitude of convenience functions for annotation, summar-ization and visualsummar-ization of genomic intervals. Complementing and extending capabilities of similar tools written in other languages
(Ramı´rez et al., 2014;Ye et al., 2011), we believe this R package
will be a welcome addition to a bioinformaticians’ toolbox. In add-ition, the data structures used in the package can easily be integrated to other analysis in R/Bioconductor (Gentleman et al., 2004;R Core
Team, 2013). A comprehensive overview of the capabilities is
included in package vignette available at http://goo.gl/vHTExn.
Funding
The research in the laboratory of D.S. was supported by the Novartis Research Foundation, the European Union [NoE ‘EpiGeneSys’ FP7-HEALTH-2010-257082 and the ‘Blueprint’ consortium FP7-282510], the European Research Council (EpiGePlas) and the Swiss initiative in Systems Biology (RTD Cell Plasticity). EC Seventh Framework Program [Integra-Life
grant 315997 to K.V.], EMBO Young Investigator Program [installation grant 1431/2006 to K.V.] and Croatian MSES [grant 119-0982913-1211 to K.V. and V.F.].
Conflict of interest: none declared.
References
Gentleman,R.C. et al. (2004) Bioconductor: open software devel-opment for computational biology and bioinformatics. Genome Biol., 5, R80.
Hartigan,J.A. and Wong,M.A. (1979) A k-means clustering algorithm. JSTOR Appl. Stat., 28, 100–108.
Kent,W.J. et al. (2010) BigWig and BigBed: enabling browsing of large distrib-uted datasets. Bioinformatics, 26, 2204–2207.
Lawrence,M. et al. (2013) Software for computing and annotating genomic ranges. PLoS Comput. Biol., 9, e1003118.
Li,H. et al. (2009) The sequence alignment/map format and SAMtools. Bioinformatics, 25, 2078–2079.
R Core Team (2013) R: A Language and Environment for Statistical Computing.
Ramı´rez,F. et al. (2014) deepTools: a flexible platform for exploring deep-sequencing data. Nucleic Acids Res., 42, W187–W191.
Stadler,M.B. et al. (2011) DNA-binding factors shape the mouse methylome at distal regulatory regions. Nature, 480, 490–495.
Ye,T. et al. (2011) seqMINER: an integrated ChIP-seq data interpretation platform. Nucleic Acids Res., 39, e35.