Transdermal Reverse Iontophoresis of
Valproate: A Noninvasive Method for
Therapeutic Drug Monitoring
M. Begon˜a Delgado-Charro1,2and Richard H. Guy1
Received May 6, 2003; accepted May 27, 2003
Purpose. The objectives of this work were (a) to explore the potential
of transdermal reverse iontophoresis for therapeutic drug monitoring and (b) to develop an “internal standard” calibration procedure so as to render the technique completely noninvasive.
Methods. A series of in vitro iontophoresis experiments was
per-formed in which the subdermal concentration of sodium valproate was varied from 21M to 1 mM. Glutamic acid was also introduced into the subdermal donor at a fixed concentration to act as an “in-ternal standard” for the calibration method.
Results. Both valproate and glutamate anions were recovered, as
expected, at the anodal receptor chamber. The iontophoretic extrac-tion flux of valproate was linearly correlated with the subdermal concentration. Glutamate flux was constant. It follows that the ratio of extracted fluxes (valproate/glutamate) was directly dependent upon (a) the subdermal valproate concentration and (b) the subder-mal concentration ratio (valproate/glutamate), offering a means, thereby, to a completely noninvasive methodology.
Conclusions. This work demonstrates the potential of reverse
ionto-phoresis for noninvasive therapeutic monitoring. The simultaneous quantification of the analyte of interest and of an “internal standard” renders the withdrawal of a blood sample unnecessary.
KEY WORDS: iontophoresis; reverse iontophoresis; therapeutic
drug monitoring; valproate; transdermal extraction.
INTRODUCTION
In general, pharmacokinetic studies and, in particular, therapeutic drug monitoring (TDM) are primarily based on blood sampling. Less invasive sampling compartments, such as urine and/or saliva, are restricted to selected drugs (1–3) and are not easily accessed in poorly cooperative populations (e.g., neonatal, pediatric, and geriatric patients). The invasive nature of venipuncture, with the associated discomfort and risks of infection, limit the frequency with which TDM and pharmacokinetic studies in “sensitive” subjects are performed (1–4). This constitutes a serious drawback for patients who are insufficiently monitored or for whom inadequate pharma-cokinetic data are available (1,4–6). Thus, the development of noninvasive techniques that provide information about the plasma concentrations and kinetics of both endogenous and drug substances is of clear interest (1,3–5).
The skin offers an extensive and accessible surface, and its potential as a portal for drug sampling has been considered (7,8). This earlier research addressed the passive transdermal efflux of substances into collection patches. Other devices,
so-called “sweat patches” (developed for doping and for con-trol of substances of abuse) operate on a similar principle (9,10) but also enable drug excretion in the sweat to provide an additional mechanism of transport. However, because pas-sive transport across the skin is so slow, these approaches require long accumulation times before the drug can be de-tected in the patch, and they are clearly limited for pharma-cokinetic tracking.
Transdermal iontophoresis refers to the transfer of charged and polar substances through the skin under the in-fluence of an electric field (11). Iontophoresis is a symmetric process that transports ions across the skin in both directions. In the outward direction, endogenous ions move toward the electrode of opposite sign in accord with their concentration and electrical mobility (the electromigration mechanism). Thus, the anode extracts the ubiquitous chloride and any other anion whose physicochemical properties and concen-tration result in a reasonable transport number (11). At the cathode, sodium and other cations are extracted. Uncharged solutes are also transported into the cathodal chamber by convective solvent flow (the electroosmosis mechanism) (12). Concentration-dependent “reverse iontophoretic” extraction was first described in 1989 for glucose, theophylline, and clo-nidine (13), and the potential for noninvasive glucose moni-toring was then quickly demonstrated in vitro (14) and then in
vivo (15,16). The approval of the Glucowatch Biographer®
by the FDA at the beginning of 2001 has validated reverse iontophoresis as a sampling technique. The Glucowatch Bi-ographer® provides frequent, minimally invasive, and auto-matic glucose readings in diabetics every 20 min for 12 h. Nevertheless, the device requires a single-point calibration with a blood sample obtained via a conventional fingerstick. Lately, reverse iontophoresis has been further exploited for the monitoring of phenylalanine (17), theophylline, and caf-feine (18).
The initial goal of this project was to assess the feasibility of “reverse iontophoresis” for therapeutic drug monitoring via the skin. To do so requires identification of analytes of suitable physicochemical, pharmacokinetic, and clinical char-acteristics, and the frequently monitored sodium valproate (19) was selected as an appropriate model. The second ob-jective was to render the existing technique truly noninvasive, such that calibration via a blood sample would no longer be required. For this, a procedure based on the use of an “inter-nal standard” was developed and evaluated.
MATERIALS AND METHODS Materials
Full-thickness skin was carefully excised from pig ear obtained at the local slaughterhouse (Socie´te´ d’Exploitation d’Abbatage, Annecy, France) and stored at −20°C for a maxi-mum of 2 months until use. The number of skin donors per experiment was four to six.
N-2-Hydroxyethylpiperazine-N’-2-ethanesulfonic acid (HEPES), L-glutamic acid, and 2-propylpentanoic acid,
so-dium salt (soso-dium valproate) were obtained from Sigma-Aldrich (Saint Quentin Fallavier, France). Sodium chloride was from Fluka (Buchs, Switzerland). [4,5-3H]valproic acid
(55 Ci/mmole) was purchased from Moravek Biochemicals
1School of Pharmacy, University of Geneva, CH-1211 Geneva, Swit-zerland, and Centre International de Recherche et d’Enseignement, “Pharmapeptides” Archamps, France.
2To whom correspondence should be addressed. (e-mail: Begonia. Delgado@pharm.unige.ch)
1508
(Isotopchim Chimie Fine, Peyruis, France). [14C(U)]L
-Glutamic acid (282 mCi/mmole) was from NEN™ Life Sci-ences Products, Inc. (Paris, France). All other chemicals were analytic grade. Deionized water (resistivityⱖ 18 M⍀ cm) was used to prepare all solutions.
Iontophoresis Experiments Electrode and Subdermal Solutions
Anodal and cathodal solutions consisted of 1 cm3of a 18
mM HEPES pH 7.4 buffer to which 75 and 133 mM NaCl had been respectively added. Two series of subdermal solutions (∼6 cm3) were assayed. In the high-concentration-range
se-ries, sodium valproate was added to a pH 7.4 buffer consisting of 133 mM NaCl and 18 mM HEPES. The valproate concen-trations were 209, 349, 699M and 1.05 mM (30, 50, 100, and 150 mg/cm3 of valproate), which span the usual therapeutic
range of total (bound + free) valproate plasma levels. These donor solutions were “spiked” with the radioactive drug at ∼0.3 Ci/cm3. In the low-concentration-range and internal
standard series, the valproate concentrations were reduced to 10% of the above-cited values. The four levels (20.9 to 104.5 M) tested corresponded, therefore, to the plasma concen-trations of free valproate usually observed in therapeutic practice. A fixed concentration of 60M glutamic acid as an “internal standard” (see below) was also added to all subder-mal drug/buffer solutions. These donor solutions were “spiked” with both [3H]valproate (∼0.4 Ci/cm3) and
[14C]glutamate (∼0.11 Ci/cm3).
Iontophoretic Cells and Power Supply
Experiments were performed in vitro in vertical diffusion cells (Laboratory Glass Apparatus, Berkeley, CA) (20). The area of skin exposed in each electrode chamber was 0.78 cm2.
Ag/AgCl electrodes were prepared in the usual manner (21), and a constant current was passed between the electrodes from a custom-built power supply (Professional Design and Development Services, Berkeley, CA) interfaced to a per-sonal computer running Labview software (National Instru-ments Inc., Austin, TX). High-concentration-range experi-ments lasted 5 h, during which a constant direct current of 0.4 mA was passed. Low-concentration-range experiments com-prised an initial iontophoretic period of 5 h at 0.4 mA fol-lowed by a second period of 19 h at 0.1 mA. Note that these two periods allow delivery of approximately the same total charge (7.2 and 6.8 C, respectively). The entire content of the anodal chamber was removed for assay at 1, 2, 3, 4, 5, and 24 h of current application and replaced by fresh buffer. The cathodal chamber was sampled at 5 and 24 h only.
Analytic Procedures
Samples from the electrode chambers were mixed with 5 cm3 of scintillation cocktail (Ultima Gold XR, Packard
In-strument S.A., Rungis, France), and the extracted amounts of valproate and glutamate were determined by liquid scintilla-tion counting (Beckman LS 6500, Beckman Instruments France, S.A., Gagny, France). The disintegrations per minute were converted to molar flux by an appropriate mathematical transformation. The skin was digested in 5 cm3of Soluene 350
(Ultima Gold XR, Packard Instrument S.A., Rungis, France),
10 cm3 of Hionic Fluor (Ultima Gold XR, Packard
Instru-ment S.A., Rungis, France) was then added to the digested tissue, and the radioactivity present in the skin was quantified. The total radioactivity recovered from the experiment (samples + skin + donor) allowed mass balance to be per-formed.
The “Internal Standard” Hypothesis
In this context, an “internal standard” is defined as an endogenous substance typically found in the body at a con-centration that may be considered constant. Such a steady level should result in an invariant iontophoretic extraction flux. In contrast, the iontophoretic flux (J) of the analyte of interest, in the presence of competitor co-ions, will vary as a function of its concentration in the subdermal fluids (11,22,23).
In the experiments reported here, we have used gluta-mate as an internal standard, having fixed its concentration (Cglu) at a value of 60M. We acknowledge that, in vivo, it is unreasonable to expect the concentration of glutamate to be constant. However, in vitro, this artificial condition can be imposed to test the hypothesis now proposed. The therapeu-tic range of valproate can thus be expressed as a function of the minimum and maximum subdermal ratios of concentra-tions Cmin/Cgluand Cmax/Cglu, and the iontophoretic flux of glutamate should be constant (Jglutamate), whereas valproate
fluxes should vary proportionately to the subdermal concen-tration. In other words, the therapeutic range can now be defined in terms of the iontophoretic flux ratios (Jvalproate-min/
Jglutamate) and (Jvalproate-max/Jglutamate).
The internal standard hypothesis can be formulated as:
JValproate
JGlutamate= K ⭈
关Valproate兴
关Glutamate兴 (1) where K is a constant. Because the internal standard concen-tration is fixed, it follows that
JValproate
JGlutamate= K
Ⲇ⭈ 关Valproate兴 (2)
where K# ⳱ K/[glutamate]. A key objective of this work,
therefore, was to test the validity of Eqs. (1) and (2) in vitro.
Statistics
Valproate fluxes exhibited unequal variance (heterosce-dasticity). The square root transformation, commonly used when the group variances are proportional to the means, was used to transform the fluxes (24). Consequently, the internal standard hypothesis can be reformulated as:
公
JValproate公
JGlutamate = k ⭈冑
关Glutamate兴关Valproate兴 (3) and公
JValproate公
JGlutamate= k Ⲇ⭈ 关Valproate兴 (4)where k and k# are constants. SigmaStat™ for Windows
V.2.03 and Graph Pad Prism V.3.02 were used for analyzing the data. Linear regression procedures were always followed
by the corresponding ANOVAs. All the regressions reported in this work were significant (p < 0.001). Glutamic acid fluxes were compared by ANOVA.
RESULTS AND DISCUSSION Iontophoretic Extraction of Valproate
Valproic acid is a small molecule (MW ⳱ 144), nega-tively charged at physiologic pH (pKa⳱ 4.6). It is transported
primarily by electromigration toward the anode (positive electrode). Figure 1A shows, at different sampling times, the anodal extraction fluxes of valproate for the high range of subdermal concentrations. The fluxes increased with time and had not achieved a steady value at 5 h. The factors that de-termine the attainment of “steady-state” iontophoretic fluxes have not been completely identified, although they have been related, for example, to the depletion of the ion reservoir in the membrane (23).
Importantly, valproate fluxes increased as a function of the subdermal drug concentration, and linear regressions be-tween these parameters (Table I) were significant at all sam-pling periods; however, acceptable correlation coefficients were obtained only after the third hour of iontophoresis. These findings are consistent with previous observations (22,23). When the current is initiated, all ions present in the system compete to transport the charge. The transport num-ber of a specific ion increases with its concentration and its electrical mobility. In our case, most of the charge is proba-bly transported by chloride coming from beneath the skin and by sodium ions “delivered” from the anodal chamber. Valproate competes with chloride and other co-ions to carry the charge, and, under these circumstances, its transport num-ber (i.e., its iontophoretic flux) is directly proportional to its concentration.
The subdermal levels of valproate assayed in the first series of experiments corresponded to typical total valproate plasma concentrations. However, because valproate binds strongly and saturably to albumin in this therapeutic range (19), only the free fraction of the drug is available for distri-bution. Microdialysis (25) has shown a good correlation
be-tween the valproate concentrations present in the subcutane-ous extracellular fluids, the subdural cerebrospinal fluid, and the unbound plasma level. It was also shown that valproate readily distributes to the subcutaneous extracellular fluid and that the ratio of the subcutaneous extracellular concentration to the free plasma level was close to unity.
It may be reasonably expected (26) that only free val-proate will be reverse iontophoretically extracted from the subcutaneous extracellular fluids through the skin. A valpro-ate–tissue protein complex will be too large to be efficiently transported. Thus, iontophoresis should provide a noninva-sive method for monitoring unbound drug concentrations.
Consequently, a second series of experiments was under-taken in which the subdermal concentration of valproate was reduced by an order of magnitude. Two protocols were con-sidered: the first involved a relatively short sampling period at a high current (5 h at 0.4 mA); the second lasted for 19 h but used a lower current (0.1 mA). As mentioned before, these two approaches delivered approximately the same total
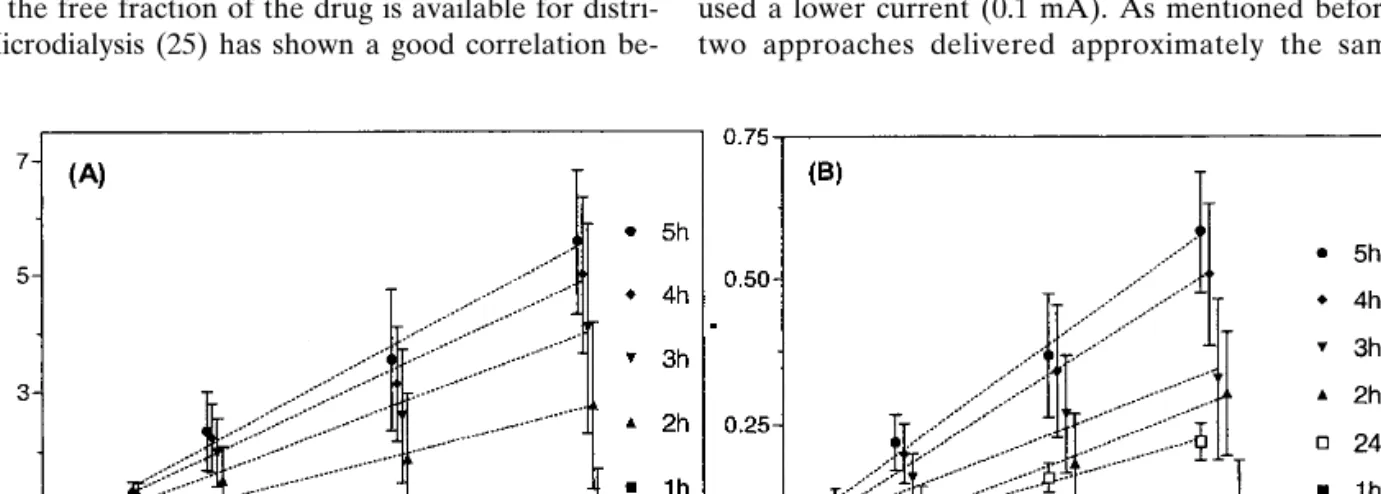
Fig. 1. Reverse iontophoretic extraction fluxes of valproate as a function of time and subdermal concentration (A) in the range 209–1050M,
and (B) in the range 21–104.5M. Each data point represents the mean ± standard deviation (n ⳱ 6). For clarity, the data points on the x-axis have been displaced slightly. Lines of linear regression are drawn through the data. Table I contains the regression statistics based on the square root of the flux values.
Table I. Regressions of the Data Shown in Fig. 1 according to
the Equation (Flux)1/2 ⳱ k* ⭈ (Concentration) + Intercept, where “Flux” Is the Reverse Iontophoretic Extraction Rate of Valproate (pmole⭈ cm−2⭈ h−1and “Concentration” is the Subdermal Level of
the Drug (M). Concentration
range (M) Time (h) k*a Interceptb r
209–1050 1 0.018 11.8 0.52 2 0.027 23.6 0.67 3 0.034 27.5 0.77 4 0.038 29.6 0.87 5 0.043 29.6 0.89 21–104.5 1 0.070 3.0 0.74 2 0.116 5.4 0.86 3 0.135 6.8 0.90 4 0.151 7.6 0.92 5 0.157 8.1 0.93 24 0.100 5.0 0.96
aUnits are (flux)1/2/(concentration).
charge; however, under steady-state conditions, the extrac-tion flux of valproate was expected to be four times higher at 0.4 mA than at 0.1 mA.
Figure 1B shows the valproate extraction fluxes mea-sured, as a function of concentration, at different sampling times. As for the higher-concentration series, the extraction flux is proportional to the subdermal concentration (Table I), and the correlation coefficient is greater than 0.85 from the second hour of sampling. It follows, therefore, that iontopho-resis is also efficient for monitoring valproate in this low con-centration range.
Figure 2 demonstrates that valproate fluxes during the first sampling protocol of 5 h at 0.4 mA were not four-fold higher than those measured during the second phase (19 h at 0.1 mA). For example, the fluxes measured at 3 and at 5 h were only, on average, 1.8 and 2.7 times, respectively, those determined at 24 h. In fact, the iontophoretic extraction fluxes of valproate increased progressively with time toward a steady value, which had not yet been attained at 5 h. How-ever, the decent correlations observed beyond the second hour suggest that valproate monitoring could nevertheless be performed at the shorter sampling times. It should also be noted that the longer time sampling protocol would also re-sult in a satisfactory outcome with respect to reverse ionto-phoretic monitoring.
Finally, a pooled linear regression, including all the data obtained at the high and low concentration ranges, was per-formed. The correlations between the subdermal concentra-tions and the fluxes at different times (1–5 h) were all signifi-cant, with r > 0.86 from the second hour of sampling. This is a remarkable result given the wide range of concentration considered (20M to 1 mM). It also means that reverse ion-tophoresis would continue to sample valproate linearly even if the free concentration suddenly increased as a result of saturation of protein binding.
Although these results show that reverse iontophoresis is able to sample valproate in a concentration-dependent man-ner, an important analytic effort would be necessary in order to quantify the small extracted amounts in any practical de-vice. It should be emphasized, however, that the approach
described has not been optimized, and higher extraction fluxes should be achievable. Furthermore, a reverse ionto-phoresis device for drug monitoring need not sample as fre-quently as that for glucose monitoring; longer sampling times (on the order of hours, for example) and “off-line” analysis and quantification would be acceptable and simpler (and less expensive) to design.
The Internal Standard Calibration
The second objective of this work was to develop a cali-bration procedure that would obviate the need for a blood sample. Why is such a calibration necessary? In a blood sample, the concentration of analyte therein is identical to that in the compartment sampled (i.e., the blood). On the other hand, when an iontophoretic extraction is performed, the concentration of the analyte in the “sample” is diluted with respect to the compartment from which it originated. This has two basic causes, which lie in electromigration and electroosmotic flux.
Electromigration
Iontophoretic fluxes caused by electromigration depend on the transport numbers of the ions that carry the current. The transport number of each ion is determined by its con-centration and mobility (11,23,27). For the analyte of interest, the amount recovered in the collection chamber (Q moles) during a sampling period of duration Tsis given by:
Q= Janalyte⭈ Ts=
tanalyte⭈ I ⭈ Ts
F⭈ zanalyte (5)
where Janalyte is the electromigration flux of the analyte,
tanalyteand zanalyteare the transport number and valence,
re-spectively, of the analyte, F is Faraday’s constant, and I the applied current. The only unknown is the transport number. However, it must be noted that a transport number is not a “dilution factor”; i.e., it is not a simple linear function of the analyte concentration (as would result from the simple dilu-tion of a drop of blood in the receptor soludilu-tion). Rather, the transport number determines the efficiency of extraction for a specific ion and, as a result, the degree with which it will concentrate in the receptor chamber. The transport numbers of the ions present in the system are defined by a complex function of their mobilities and concentrations (23,27). Fur-thermore, the sum of the transport numbers must equal 1, as the total charge passed between the electrodes must equal that transported by the ions through the skin. At present, there is no known algorithm to link a given ion transport number (or flux) to its concentration in the donor solution. To establish that relationship, the “donor” concentration of the ion has to be known. Although this presents no problem in an in vitro experiment like those described in this paper, the only approach in vivo to calibrate the iontophoretic ex-traction efficiency is via a blood sample.
Electroosmotic Flux
The electroosmotic flux across the skin during iontopho-resis is the product of the convective solvent flow and the concentration of the analyte of interest (12,28). Because there is no a priori procedure to estimate solvent flow at any
par-Fig. 2. Reverse iontophoretic extraction fluxes of valproate and
glu-tamate as a function of time relative to their values at 24 h (mean + standard deviation; n ⳱ 6). At steady state, these ratios should achieve, under the experimental protocol used, a value of 4 (see text for details).
ticular skin site, a blood sample is, once again, essential to calibrate the reverse iontophoretic approach.
In this study, a pair of anions was used to address the calibration problem: valproate was the analyte of interest, glutamate (MW⳱ 147; pKa ⳱ 4.25) the internal standard,
which was added to the subdermal buffer at a fixed concen-tration of 60M. The latter was selected purely for analytic convenience; the issue of “practical” internal standards is dis-cussed later. Given the physicochemical characteristics of these two anions, their iontophoretic transport is exclusively electromigrative.
To validate the internal standard calibration procedure requires three conditions to be met: (a) the extraction flux of the internal standard (glutamate) must remain constant as the analyte concentration fluctuates; (b) the extraction flux of the analyte (valproate) must vary with its subdermal concentra-tion; and (c) the ratio of the iontophoretic fluxes (analyte/ internal standard) must be proportional to their subdermal concentration ratio and, given that the internal standard con-centration is constant, to the analyte concon-centration.
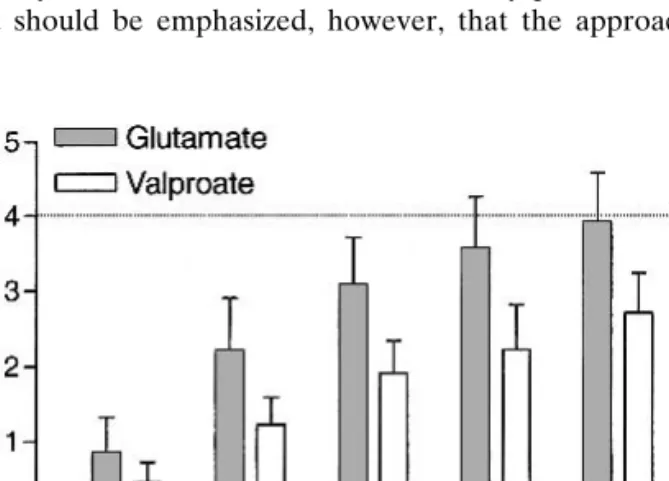
Figure 3 illustrates that the first criterion is satisfied. Glu-tamate extraction is unchanged as the valproate subdermal concentration is increased from 21 to 104.5M. These data further demonstrate that glutamate extraction had attained a steady rate by 5 h. Equally (as shown in Fig. 2), the glutamate flux at this time equals the theoretically predicted value of fourfold greater than that observed after the second, low-current protocol, at 24 h postinitiation of iontophoresis. The exact reason why glutamate reaches a steady extraction rate more quickly than valproate remains unknown but may be related to the greater lipophilicity of the drug relative to the amino acid [the calculated log (octanol-water partition coef-ficients) of the unionized valproic and glutamic acids are 2.9 and –3.8, respectively (http://esc.syrres.com/interkow)].
With respect to the second condition, it has already been shown that valproate extraction is proportional to its subder-mal concentration (Fig. 3). The valproate fluxes at 5 h and the deduced transport number of the analyte increase linearly with concentration. At the same time, glutamate flux and transport number remain constant.
Figure 4 shows that the final condition is supported by the results from the very first hour of sampling; correlation coefficients for the linear dependence of the iontophoretic
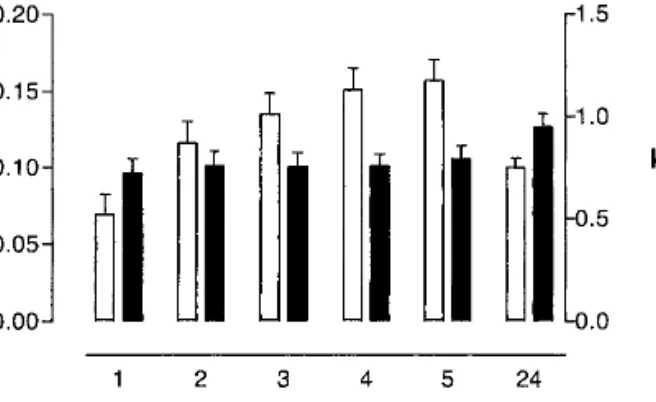
extraction ratio (valproate/glutamate) on the subdermal val-proate concentration are greater than 0.9 for all the time points (Table II). It would appear, therefore, that the internal standard calibration approach may correct for some of the variability associated with the extraction process before “steady state” is achieved. The latter contention is supported by Fig. 5, which plots the derived values of k* (Table I) and
k [defined in Eq.(3)] as a function of time. Although the
values of k*, the proportionality constant between valproate extraction flux and valproate concentration, increase progres-sively with time, k (which relates the ratio of extraction fluxes to the subdermal concentration ratio) is constant from the first hour of sampling.
It is also interesting to note that the value of k at 5 h (∼0.75) at the end of the first sampling protocol increases to ∼0.95 following the 19-h period of the second sampling pro-tocol (Fig. 5). This confirms that the ratio of extraction fluxes directly reflects their relative concentration in the subdermal compartment and that their extraction efficiencies are quite similar (a conclusion consistent with the facts that their sub-dermal levels are of the same order of magnitude and that their transport numbers are alike, as confirmed by calcula-tion—see Fig. 3). The concept of the internal standard hy-pothesis is well demonstrated by the valproate–glutamate couple, therefore. If glutamate was indeed present systemati-cally at a fixed concentration of 60M, one could envisage
Fig. 3. Extraction fluxes after 5 h of iontophoresis of valproate and
glutamate (filled squares and filled triangles, respectively) and their corresponding transport numbers (open squares and open triangles, respectively) as a function of the subdermal valproate concentration (range 21–104.5M). Each data point is the mean ± standard devia-tion (n⳱ 6).
Fig. 4. Ratio of the reverse iontophoretic extraction fluxes of
valpro-ate and glutamvalpro-ate as a function of time and subdermal valprovalpro-ate concentration (range 21–104.5M). Each data point represents the mean ± standard deviation (n⳱ 6). For clarity, the data points on the
x-axis have been displaced slightly. Lines of linear regression are
drawn through the data. Table II contains the regression statistics following a square root transformation of the data.
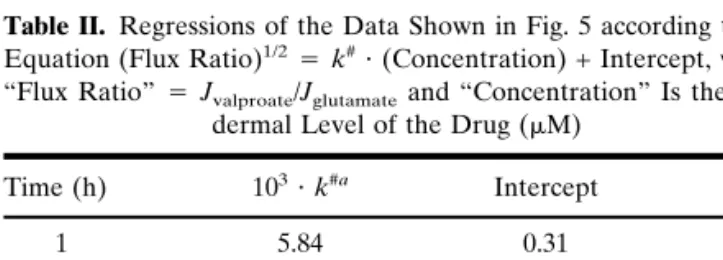
Table II. Regressions of the Data Shown in Fig. 5 according to the
Equation (Flux Ratio)1/2⳱ k#⭈ (Concentration) + Intercept, where “Flux Ratio”⳱ Jvalproate/Jglutamateand “Concentration” Is the
Sub-dermal Level of the Drug (M)
Time (h) 103⭈ k#a Intercept r 1 5.84 0.31 0.89 2 6.12 0.33 0.90 3 6.10 0.34 0.91 4 6.11 0.36 0.93 5 6.45 0.35 0.93 24 7.69 0.44 0.95
the development of a completely noninvasive reverse ionto-phoretic procedure for monitoring valproate in the therapeu-tic concentration range without the need for a blood sample to be withdrawn.
However, this encouraging conclusion also leads to a se-ries of questions requiring further work. First, as glutamate concentrations are not constant under normal conditions, what might be a more appropriate, alternative internal stan-dard for a drug such as valproate? Would an electrolyte ion, such as chloride, be practical given that, in reality, it is likely to be the major charge carrier from beneath the skin toward the anode? The mobility and concentration of Cl−, it must be
remembered, will be much greater than those for a drug like valproate, so might we expect k under such circumstances to approach an ideal value of unity? Second, do the principles established here for a pair of anions hold similarly for cat-ions? What would be the internal standard for a cationic drug; an electroyte like Na+ or K+, perhaps? Again, is the better
choice the major charge carrier (Na+) or one that is
respon-sible for much smaller fraction of the current flow (e.g., K+)?
Third, what about neutral analytes, such as glucose, that are transported by electroosmosis and not electromigration? Is a similarly uncharged internal standard required, or might a cation also be useful (given that convective solvent flow, un-der normal conditions, goes in the anode-to-cathode direc-tion)? Finally, to what extent is k really constant? In a typical population of patients, what range of variability in k would be acceptable, or would one need to pinpoint this parameter for each individual? These and other important questions form the basis of ongoing research.
ACKNOWLEDGMENTS
This research was supported by the the Swiss National Research Foundation (3200-059042.99/1) and the “Pro-gramme Commun en Ge´nie Biome´dical” of the Universities of Geneva and Lausanne, the Cantonal hospitals of Geneva and Vaud, and the Ecole Polytechnique Fe´de´rale de Lau-sanne (EPFL).
REFERENCES
1. R. E. Kauffman and G. L. Kearns. Pharmacokinetics studies in paediatric patients. Clinical end ethical considerations. Clin.
Pharmacokinet. 23:10–29 (1992).
2. R. K. Drobitch and C. K. Svenson. Therapeutic drug monitoring in saliva. An update. Clin. Pharmacokinet. 23:365–379 (1992).
3. B. Bailey, J. Klein, and G. Koren. Noninvasive methods for drug mea-surement in pediatrics. Pediatr. Clin. North Am. 44:15–26 (1997). 4. C. K. Svenson. Ethical considerations in the conduct of clinical
pharmacokinetic studies. Clin. Pharmacokinet. 17:217–222 (1989).
5. J. T. Gilman and P. Gal. Pharmacokinetic and pharmacodynamic data collection in children and neonates. A quiet frontier. Clin.
Pharmacokinet. 23:1–9 (1992).
6. P. D. Walson. Therapeutic drug monitoring in special popula-tions. Clin. Chem. 44:415–419 (1998).
7. M. G. Murphy, C. C. Peck, D. P. Conner, K. Zamani, G. B. Merenstein, and D. Rodden. Transcutaneous theophylline collec-tion in preterm infants. Clin. Pharmacol. Ther. 47:427–434 (1990). 8. C. C. Peck, K. Lee, and C. E. Becker. Continuous transepidermal drug collection: Basis for use in assessing drug intake and phar-macokinetics. J. Pharmacokinet. Biopharm. 9:41–58 (1981). 9. P. Kintz, R. Brenneisn, P. Bundeli, and P. Mangin. Sweat testing
for heroin and metabolites in a heroin maintenance program.
Clin. Chem. 43:736–739 (1997).
10. P. Kintz, A. Tracqui, C. Jamey, and P. Mangin. Detection of codeine and phenobarbital in sweat collected with a sweat patch.
J. Anal. Toxicol. 20:197–201 (1996).
11. M. B. Delgado-Charro and R. H. Guy. Transdermal iontophore-sis for drug delivery and non-invasive monitoring. STP Pharma.
Sci. 11:403–414 (2001).
12. M. J. Pikal. The role of electroosmotic flow in transdermal ion-tophoresis. Adv. Drug Deliver. Rev. 9:201–237 (1992).
13. P. Glikfeld, R. S. Hinz, and R. H. Guy. Noninvasive sampling of biological fluids by iontophoresis. Pharm. Res. 6:988–990 (1989). 14. G. Rao, P. Glikfeld, and R. H. Guy. Reverse iontophoresis: De-velopment of a noninvasive approach for glucose monitoring.
Pharm. Res. 10:1751–1755 (1993).
15. G. Rao, R. H. Guy, P. Glikfeld, W. R. LaCourse, L. Leung, J. Tamada, R. O. Potts, and N. Azimi. Reverse iontophoresis: Non-invasive glucose monitoring in vivo in humans, Pharm. Res. 12: 1869–1873 (1995)
16. J. A. Tamada, S. Garg, L. Jovanovic, K. R. Pitzer, S. Fermi, and R. O. Potts. Noninvasive glucose monitoring. Comprehensive clinical results. JAMA 282:1839–1844 (1999).
17. V. Merino, A. López, D. Hochstrasser, and R. H. Guy. Nonin-vasive sampling of phenylalanine by reverse iontophoresis.
J. Control. Release 61:65–69 (1999).
18. N. Sekkat, A. Naik, Y. N. Kalia, P. Glikfeld, and R. H. Guy. Reverse iontophoretic monitoring in premature neonates: feasi-bility and potential. J. Control. Release 81:83–89 (2002). 19. A. Warner, M. Privitera, and D. Bates. Standards of laboratory
practice: antiepileptic drug monitoring. Clin. Chem. 44:1085–1095 (1998).
20. P. Glikfeld, C. Cullander, R. S. Hinz, and R. H. Guy. A new system for in vitro studies of iontophoresis. Pharm. Res. 5:443– 446 (1988).
21. P. G. Green, R. S. Hinz, C. Cullander, G. Yamane, and R. H. Guy. Iontophoretic delivery of amino acids and amino acid de-rivatives across the skin in vitro. Pharm. Res. 8:1113–1120 (1991). 22. D. Marro, Y. N. Kalia, M. B. Delgado-Charro, and R. H. Guy. Contributions of electromigration and electroosmosis to ionto-phoretic drug delivery. Pharm. Res. 18:1701–1708 (2001). 23. J. B. Phipps and J. R. Gyory. Transdermal ion migration. Adv.
Drug Deliver. Rev. 9:137–176 (1992).
24. J. H. Zar. Biostatistical Analysis. Prentice Hall, Englewood Cliffs, New Jersey, 1984.
25. M. Lindberger, T. Tomson, L. Wallstedt, and L. Ståhle. Distri-bution of valproate to subdural cerebrospinal fluid, subcutaneous extracellular fluid, and plasma in humans: A microdialysis study.
Epilepsia 42:256–261 (2001).
26. N. G. Turner, L. Ferry, M. Price, C. Cullander, and R. H. Guy. Iontophoresis of poly-L-lysines: the role of molecular weight?
Pharm. Res. 14:1322–1331 (1997).
27. G. B. Kasting and J. C. Keister. Application of electrodiffusion theory for a homogeneous membrane to iontophoretic transport through skin. J. Control. Release 8:195–210 (1989).
28. M. J. Pikal and S. Shah. Transport mechanisms in iontophoresis. III. An experimental study of the contributions of electroosmotic flow and permeability change in transport of low and high mo-lecular weight solutes. Pharm. Res. 7:222–231 (1990).
Fig. 5. Values of k* (open bars) as shown in Table I, and k (filled
bars) as defined in Eq. (3), as a function of time of iontophoresis. The mean values are shown together with the 95% confidence interval.