Vitamin A-forti
fied cooking oil reduces vitamin A deficiency in
infants, young children and women: results from a programme
evaluation in Indonesia
Sandjaja
1,2, Idrus Jus’at
2,3, Abas B Jahari
1, Ifrad
2,4, Min Kyaw Htet
5, Robert L Tilden
2,†,
Damayanti Soekarjo
6, Budi Utomo
7, Regina Moench-Pfanner
8, Soekirman
2and
Eline L Korenromp
9,*
1National Institute for Health Research and Development (NIHRD), Ministry of Health, Republic of Indonesia, Jakarta, Indonesia:2Indonesian Nutrition Foundation for Food Fortification (formerly Koalisi Fortifikasi Indonesia), Jakarta, Indonesia:3School of Health Sciences, Esa Unggul University, Jakarta, Indonesia:4GIZ Strategic Alliance for the Fortification of Oil and Other Staple Foods (GIZ-SAFO), Jakarta, Indonesia:5Center of Community Health and Population Studies, The Research Institute, Trisakti University, Jakarta, Indonesia:6Savica Public Health Nutrition & Communication Consultancy, Surabaya, Indonesia:7University of Indonesia School of Public Health, Jakarta, Indonesia:8Global Alliance for Improved Nutrition, Singapore:9Global Alliance for Improved Nutrition, PO Box 55, 1211 Geneva 20, Switzerland Submitted 28 March 2014: Final revision received 5 November 2014: Accepted 3 December 2014: First published online 16 January 2015
Abstract
Objective: To assess oil consumption, vitamin A intake and retinol status before
and a year after the fortification of unbranded palm oil with retinyl palmitate.
Design: Pre–post evaluation between two surveys. Setting: Twenty-four villages in West Java.
Subjects: Poor households were randomly sampled. Serum retinol (adjusted for subclinical infection) was analysed in cross-sectional samples of lactating mothers (baseline n 324/endline n 349), their infants aged 6–11 months (n 318/n 335) and
children aged 12–59 months (n 469/477), and cohorts of children aged 5–9 years
(n 186) and women aged 15–29 years (n 171), alongside food and oil consumption from dietary recall.
Results: Fortified oil improved vitamin A intakes, contributing on average 26 %,
40 %, 38 %, 29 % and 35 % of the daily Recommended Nutrient Intake for children
aged 12–23 months, 24–59 months, 5–9 years, lactating and non-lactating women,
respectively. Serum retinol was 2–19 % higher at endline than baseline (P < 0·001
in infants aged 6–11 months, children aged 5–9 years, lactating and non-lactating
women; non-significant in children aged 12–23 months; P = 0·057 in children aged
24–59 months). Retinol in breast milk averaged 20·5 μg/dl at baseline and 32·5 μg/dl at
endline (P< 0·01). Deficiency prevalence (serum retinol <20 μg/dl) was 6·5–18 %
across groups at baseline, and 0·6–6 % at endline (P ≤ 0·011). In multivariate regressions adjusting for socio-economic differences, vitamin A intake from fortified oil predicted improved retinol status for children aged 6–59 months
(P= 0·003) and 5–9 years (P = 0·03).
Conclusions: Although this evaluation without a comparison group cannot prove causality, retinyl contents in oil, Recommended Nutrient Intake contributions and relationships between vitamin intake and serum retinol provide strong plausibility of oil fortification impacting vitamin A status in Indonesian women and children.
Keywords Vitamin A Food fortification Impact evaluation Children Mothers Vitamin A deficiency is a leading cause of preventable
blindness and a risk factor for severe infection and
asso-ciated illness and death(1). In Indonesia, severe
defi-ciency(2)and its clinical manifestation xerophthalmia have
declined steadily over past decades(3), but mild and
moderate deficiency remain prevalent in pregnant and
lactating women and children of pre-school age. Indonesia’s rice- and vegetable-based diet provides little bioavailable
vitamin A(4,5), and poverty and food insecurity result in
suboptimal diet quality and variety, which correlate with
poor vitamin A status(6–8).
Fortification of vegetable oil with vitamin A is a
cost-effective strategy to improve vitamin A status(9–11), including
in infants whose vitamin A status depends on the nutritional † This author passed away in May 2014.
status of their mothers(1,12) and in vulnerable groups not covered by periodic supplementation. A feasibility study confirmed vitamin A fortification of cooking oil as a feasible
intervention for Indonesia(10). Over 80 % of Indonesians from
all socio-economic groups consume unbranded palm oil daily. Most of the oil comes from a few large producers and reaches households within 3–4 weeks following production,
typically allowing considerable vitamin retention(10,11).
Fortification of palm-based cooking oil at 40 IU/g (i.e. 12·1 mg/kg) could contribute 30 % of the daily Recommended Nutrient Intake (RNI) for vitamin A for children under the
age of 5 years and 30–41 % of the RNI for women(10,13).
With support from the Global Alliance for Improved
Nutrition (GAIN), Indonesia’s Nutrition Foundation for
Food Fortification and the National Institute of Health
Research and Development of Indonesia’s Ministry of
Health piloted fortification of unbranded palm oil with
vitamin A in West Java. Within this pilot, a coverage and impact evaluation measured retention of vitamin A in fortified oil through the distribution chain and the effects on vitamin A intake and retinol status of pre-school and school-age children, women of reproductive age and lactating mothers. We compared serum and breast milk retinol concentrations between two household surveys conducted just before fortification started (June–July 2011) and a year thereafter, in relation to vitamin A intake from oil and other dietary and socio-economic determinants.
Methods
Oil fortification programme
The pilot was implemented with one of the largest
cooking oil refineries, Sinar Alam Permai (PT-SAP) of the
Wilmar Group. PT-SAP produced unbranded palm oil in its factory in South Sumatera, adding retinyl-palmitate
premix (1·7 million IU/g, i.e. 514 000 mg/kg; supplied by
BASF SE and DSM Nutritional Products Europe Ltd) at the time of loading barges for shipment to a West Java
distribution centre. Fortification was at the Indonesian
National Standard (SNI) level of 45 IU retinol/g (i.e. 13·6 mg retinol/kg). The fortified oil was shipped to a West Java distribution centre which supplied district-level dis-tributors, who further distributed the oil to sub-distributors down to small neighbourhood shops/stalls (warung), without programme intervention. Oil was sold either via
bulk containers from which consumers filled their own
bottles, or via individual plastic sachets(10,11,13).
Evaluation design
A pre–post comparison was used to assess utilization, coverage and impact of fortified oil. The market-based distribution did not allow for a control group.
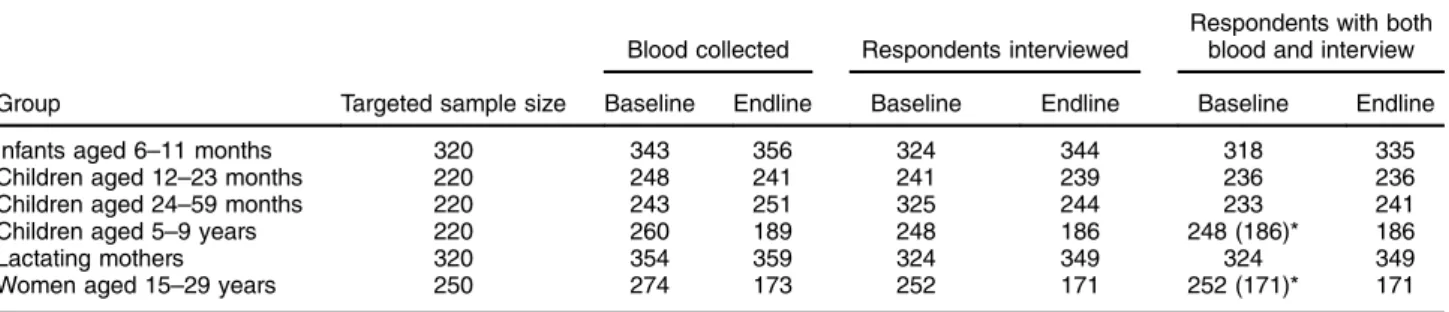
For lactating mothers with infants aged 6–11 months and for children aged 12–59 months, baseline and endline surveys were conducted and analysed as independent cross-sectional samples (Table 1). Children aged 5–9 years and women aged 15–29 years were sampled and analysed as cohorts. From cohort households, oil samples were collected two-weekly during the year between surveys. Village and subject sampling
Districts Tasikmalaya and Ciamis were selected based on a >50 % market share of PT-SAP’s unbranded oil. Four sub-districts per district, two or three peri-urban villages per sub-district and the largest town of each district were selected, for a total of twenty-four villages.
The sampling frame targeted the poor population sus-pected to be at highest risk of low serum retinol by randomly sampling only those households in the twenty-four villages
that possessed a government-issued‘poor family’ card.
Sample sizes provided power to detect a≥10 % increase
in mean retinol concentration in serum or breast milk(11),
with a type I error (α) of 0·05 and a statistical power (β) of
0·80, for children aged 6–59 months, 5–9 years and
women aged 15–29 years. For lactating mothers and their
infants aged 6–11 months (sampled in pairs), samples Table 1 Targeted and realized numbers of respondents in the evaluation of a pilot fortification of unbranded palm oil with vitamin A in West Java, Indonesia
Blood collected Respondents interviewed
Respondents with both blood and interview
Group Targeted sample size Baseline Endline Baseline Endline Baseline Endline
Infants aged 6–11 months 320 343 356 324 344 318 335
Children aged 12–23 months 220 248 241 241 239 236 236
Children aged 24–59 months 220 243 251 325 244 233 241
Children aged 5–9 years 220 260 189 248 186 248 (186)* 186
Lactating mothers 320 354 359 324 349 324 349
Women aged 15–29 years 250 274 173 252 171 252 (171)* 171
Targeted sample sizes based onα = 0·05 (95 % CI), statistical power β = 0·80, expected improvement in serum retinol of 0·10–0·20 µg/dl(11), a design effect of 2(15)and 10 % drop-out(11). Baseline mean serum retinol, as additional last parameter to calculate sample sizes, was estimated at 20 (SD0·2) µg/dl for infants aged 6–11 months(47), 27 (SD0·25) µg/dl for children aged 12–59 months, 30 (SD0·25) µg/dl for children aged 5–9 years(48), 26 (SD0·6) µg/dl for lactating mothers and 29 (SD0·3) µg/dl for non-lactating women aged 15–29 years. Since lactating mothers and infants aged 6–11 months were selected as mother–child pairs, the adjusted sample size for infants was taken to be that for lactating women, which had the larger crude sample size.
were set to detect a serum retinol increase of 20 % in the
mothers(14). Sample calculations assumed a cluster-design
effect of 2(15). To account for drop-outs, samples were
further inflated by 10 %(11).
Eligibility criteria included, for all groups: no counter-indications for blood sampling, such as haemophilia or known severe (chronic or acute) disease; and no severe
anaemia (Hb< 7 g/dl). In addition, women aged 15–29 years
were not currently lactating; lactating and non-lactating women were not pregnant; children aged 6–59 months were
not severely underweight (weight-for-height Z-score<−3·0);
and children aged 12 months–9 years were not severely
overweight (weight-for-height Z-score>3·0).
Ethical authorization
The study was conducted according to guidelines laid down in the Declaration of Helsinki; all procedures involving human subjects were approved by the Ethical Review Committee of the Ministry of Health, National Institute of Health Research and Development. Written informed consent was obtained from all participants, or their parents for children.
Data collection
Enumerators were twenty-four local nutritionists from
District Health Offices working at local puskesmas
(Com-munity Health Centres), with two replacements in each district at endline. At both baseline and endline, a structured questionnaire was used to collect data on socio-economic status, household composition and history of disease. Blood and breast milk samples
Hb was measured on-site using a HemocueTM device
(Hemocue, Ängelholm, Sweden). Venous blood (5 ml) was sampled at health facilities, from the arm of
partici-pants >12 months old. From infants <12 months old,
blood was taken from the heel. If the phlebotomist failed
to obtain the sample onfirst attempt, with permission he/
she tried a second time; when both attempts were unsuccessful, the respondent was excluded. Blood sam-ples were stored in plain glass evacuated tubes covered
with foil until transport to the district health office, for
sample fractioning, the same day.
Serum was separated from the remaining blood by cen-trifugation at room temperature for 8 min at 3000g, divided
into (four or, when possible, five) aliquots of 500 µl each
and stored in Eppendorf tubes at −20°C. Retinol
con-centration was measured in 500µl serum using HPLC
(Immundiagnostik kit, supplied by Prodia Laboratory, Jakarta, Indonesia). The CV was 4·1 %. C-reactive protein
(CRP) andα-glycoprotein (AGP) were measured by an
in-house ELISA at VitMin Lab, Willstaett, Germany(16). Serum
retinol levels were adjusted for subclinical inflammation
(serum CRP >5 mg/l and/or AGP >1 g/l), using standard
correction factors(17–19). Baseline and endline samples were
analysed simultaneously, to reduce risk of biases associated with developments at laboratories.
Lactating mothers were visited by midwives. At both baseline and endline, all milk from one breast that had
not been used for ≥30 min was collected during a
mid-morning feeding with a hand-pump. Of this sample, 25 ml was aliquoted, transported in a bottle covered with
aluminium foil, stored at −18°C and analysed for retinol
using HPLC (AOAC Official Method 2001·13(20,21)) at the
Center for Agro-Industry (BBIA), Bogor, Indonesia. Dietary assessment and vitamin A intake
A single 24 h dietary recall from each respondent, at baseline and at endline, recorded types and quantities of foods (including snacks and street foods) consumed. Data
were analysed in Nutrisoft software(22), using Indonesia’s
food composition table(23)to estimate nutrient intakes. Oil
consumption was estimated from dietary intake using Indonesia’s official conversion table, which assumes a
fixed average amount of cooking oil in each dish(24).
Vitamin A intake from fortified oil was estimated based on individual oil intake (at endline) multiplied by the average vitamin A concentration in household and small-stall oil samples taken during the year. Oil sample mea-surements from cohort households were used to estimate average vitamin A levels in oil consumed. For non-cohort households and cohort households without any sample taken, vitamin levels in oil were interpolated as the aver-age level across household samples from the same villaver-age. Because Nutrisoft does not correct for poor bioavail-ability of (pro-)vitamin A/carotenoid in foods, it likely overestimates vitamin A intake from plant-source foods, which the evaluated population consumed in large amounts. Therefore, our analyses considered vitamin A intake only from animal-source foods and oil-containing foods.
Vitamin A intakes from oil and animal foods were converted into proportional contributions to the daily, age-specific RNI, using internationally accepted reference
RNI values(25).
Household socio-economic variables
Purchasing power was expressed in existing national
household expenditure quintiles from ‘Survei
Sosio-ekonomi Nasional’ (SUSENAS), a national survey
con-ducted in 2010(26). As another socio-economic indicator,
we calculated the proportion of household expenditures on food. Possession of assets (car, motorcycle, refrigerator, computer, hand phone, television, DVD player, radio, etc.) was aggregated in a household asset score, weighting each asset by average price. A housing sanitation score was calculated from sub-scores for cleanliness, windows, ventilation and lighting in living room and bedroom. Finally, a housing condition score aggregated sub-scores
for type of house, roof, ceiling, walls and floors, and
number and separation of bedrooms. Multivariate regres-sions considered these scores in quintiles.
Vitamin A in cooking oil
Oil fortification levels were assessed at the factory,
dis-tributors, food shops/stalls and from household samples, using the rapid device iCheck™ (BioAnalyt GmbH,
Teltow, Germany)(27). For factories, the iCheck-based
vitamin A levels were those reported by the producer from internal quality assurance/quality control.
Over 4800 samples, each comprising 25 ml of unused oil, were collected from small stalls and households, and
kept in plastic bottles, which were completely filled,
covered with aluminium foil and stored in the dark at
district base camps. Random subsets of fifty-four and
seventy-five of these samples, respectively, were analysed
immediately in thefield and used to calculate vitamin A
intake from oil. Samples with vitamin A content below the
iCheck assay’s lower detection limit of 3 mg retinol
equivalents/kg (i.e. 10 IU/g) were included with value of 1 mg/kg (3·3 IU/g) in analyses.
Data cleaning and analysis
Data were double-entered (biomarkers and key respondent identifiers) or single-entered (other questionnaire variables) into a database; internal consistency and validity were checked by an external team from the School of Public Health, University of Indonesia, Depok, with some ques-tionnaires revisited and data re-entered to correct errors.
Analyses were limited to participants with both inter-view and blood data available (Table 1). For cohort members, analyses selected individuals who participated in both baseline and endline. Drop-out from cohorts was considerable (Table 1), mainly due to refusals to blood drawing (at endline), emigration and absence from home during survey days. No records were kept on numbers and reasons for refusal and drop-out.
Cleaned data were analysed using the statistical software package IBM SPSS Statistics version 19·0 for Windows (2011). Student t tests tested differences between baseline and endline, averaged within age groups (paired t test for continuous variables in cohorts; unpaired/ independent-samples t test for binary/proportional vari-ables in cohorts; and unpaired/independent t test for all outcomes in cross-sectional groups).
Retinol concentrations were analysed inμg/dl. Vitamin
A deficiency was defined as serum retinol below 20 μg/dl
(0·7 µmol/l)(28).
Multivariate regression
Determinants of vitamin A status were assessed in multi-variate linear regression. The key outcome measure was the shift in serum (AGP/CRP-adjusted) retinol concentra-tion. Covariates (selected based on perceived relevance and data quality) were taken from the endline survey, except for serum retinol concentration at baseline and household expenditure on food; the latter was calculated as endline-minus-baseline shift to capture changes between surveys in socio-economic conditions.
Regressions were run at the level of village-average outcomes. For cohorts, in addition individual-level regres-sions were performed.
Results
Respondent characteristics at baseline and endline Populations surveyed were comparable between baseline and endline in age and sex distribution; and for children, in breast-feeding and vitamin A supplementation coverage (Table 2). As exceptions, infants aged 6–11 months were
slightly older at endline than at baseline (P= 0·01) and
their proportion ever breast-fed was slightly higher at
endline (P= 0·002).
Socio-economic indicators generally were better at endline than baseline. Nevertheless, at both surveys high proportions of households were in the poorest national
expenditure quintile (37–53 % at baseline; 26–44 % at
endline)(26); that is, within the targeted poor population.
Vitamin A content of cooking oil
Cooking oil leaving the factory had an average
retinyl-palmitate level of 43·6 (SD2·5) IU/g. Corresponding levels
were 28·3 (SD7·7) IU/g at distributors, 25·7 (SD10·5) IU/g
at small stalls and 28·5 (SD 12·0) IU/g in households
(Fig. 1(a)). Among household samples, vitamin A levels varied considerably over the months and between the two districts (Fig. 1(b)).
Consumption of oil and foods containing vitamin A, and their contributions to Recommended Nutrient Intakes
Mean oil consumption at baseline ranged from 2·4 ml/ capita per d for infants aged 6–11 months to 31·5 ml/capita per d for lactating mothers (Table 3). Oil consumption did not change from baseline to endline in any group. Households reported consuming the oil purchased within a median of 3 d (interquartile range 2–7 d).
Contributions to the daily vitamin A RNI from fortified oil were from 26 % in children aged 12–23 months to
35–40 % in older children and non-lactating women
(Table 3). The RNI contribution from oil was only 4 % in breast-feeding infants. For animal foods, mean contribu-tions to the vitamin A RNI were below 50 % in all groups
and only 19 % for lactating women. Consumption of fortified
cooking oil therefore improved vitamin A intakes
con-siderably, except among infants aged 6–11 months (in whom
intake via breast milk was not quantified). Risk of excessive vitamin A intake
Based on reported consumption at endline, no individual in any group consumed enough oil to exceed the guidance
level for long-term intake of 1500μg retinol equivalents/d,
Serum retinol concentrations
Mean (CRP/AGP-adjusted) serum retinol concentrations at baseline ranged from 30·7 μg/dl among children aged 6–11 months and lactating mothers, to 42·7 μg/dl among non-lactating women (Table 4). At endline, mean retinol
was higher among all groups, with P< 0·001 among all
groups except children aged 12–23 months (P = 0·529)
and 24–59 months (P = 0·057). The mean increase ranged
from 0·7 μg/dl (2·2 %) among 12–23-month-olds, to 8·1 μg/dl
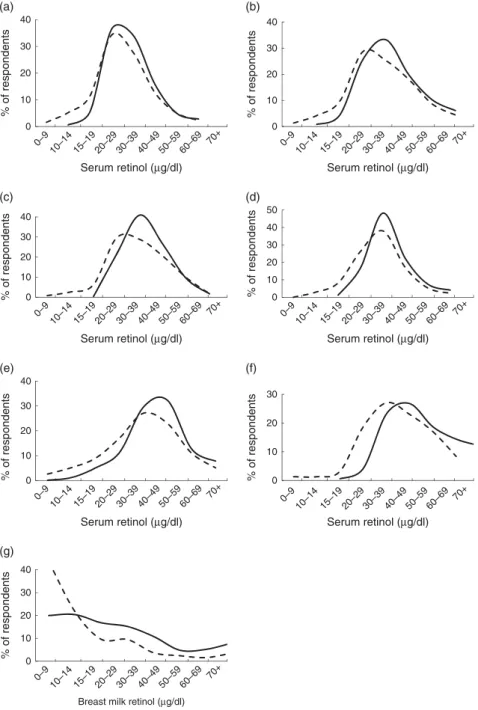
(19·0 %) among non-lactating women. In population fre-quency distributions, these differences were apparent as marked shifts to the right (Fig. 2).
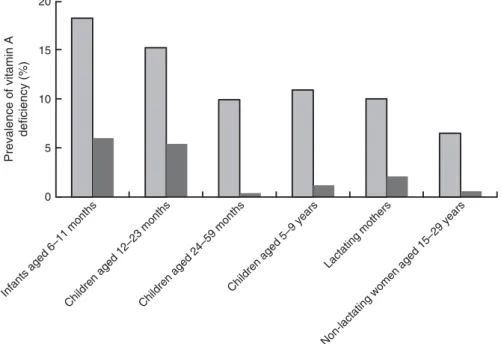
At baseline, vitamin A deficiency was most prevalent among children aged 6–11 months (18·2 %) and children aged 2–9 years (10–11 %; Fig. 3). Twice as many lactating mothers were deficient than non-lactating women (10·0 % v. 5·3 %). Deficiency prevalence was significantly lower at endline for all groups. The largest proportional difference Table 2 Characteristics of respondents at baseline and endline in a pilot fortification of unbranded palm oil with vitamin A in West Java, Indonesia Infants aged 6–11 months Children aged 12–23 months Children aged 24–59 months Children aged
5–9 years* Lactating mothers
Women aged 15–29 years*
Mean SD Mean SD Mean SD Mean SD Mean SD Mean SD
Sex ratio (M/F; %)
Baseline 51·5 44·8 48·9 44·6
Endline 50·6 51·0 50·4 44·6
P value 0·80 0·17 0·75 1·0
Age (months or years)
Baseline 8·1 1·8 17·1 3·8 38·3 10·0 6·9 1·1 28·9 6·7 23·0 6·6 Endline 8·5 1·8 18·1 3·2 36·2 10·0 7·9 1·1 29·1 6·4 24·0 6·6 P value 0·010 0·040 0·044 <0·001 0·63 <0·001 Ever breast-fed (%) Baseline 96·5 96·6 53·1 Endline 99·7 96·6 38·1 P value 0·002 1·0 0·076
Vitamin A supplement received in February preceding survey† (%)
Baseline 26·4 92·4 92·7
Endline 28·7 95·8 95·4
P value 0·52 0·12 0·81
Household capital asset score (possible range: 0–100)‡
Baseline 11·1 10·5 12·0 12·2 11·9 12·2 11·7 12·6 11·1 10·5 12·8 13·3
Endline 13·1 9·2 13·4 12·6 13·7 13·3 11·7 11·0 13·1 9·1 14·8 11·4
P value 0·016 0·21 0·14 0·95 0·009 0·039
Housing condition score (possible range: 7–21)‡
Baseline 18·4 2·8 18·5 2·3 18·5 2·3 18·4 2·4 18·4 2·7 18·4 2·7
Endline 19·2 1·4 19·0 1·6 18·9 1·6 18·9 1·5 19·2 1·4 18·9 1·5
P value <0·001 0·009 0·016 0·006 <0·001 0·005
Household sanitation score (possible range: 8–24)‡
Baseline 20·2 3·6 20·2 3·7 20·3 3·7 18·4 4·0 18·8 4·0 19·3 4·2
Endline 20·5 3·2 20·2 3·6 20·1 3·6 17·8 3·8 18·9 3·7 19·0 3·9
P value 0·29 0·69 0·658 0·072 0·72 0·48
Household expenditure quintile (% in lowest quintile)
Baseline 52·5 49·6 50·2 51·1 52·5 37·4
Endline 38·2 44·1 33·2 43·5 38·7 25·7
P value 0·002 0·23 <0·001 0·12 0·003 0·02
Household expenditure on food (% of total expenditure)
Baseline 71·1 39·5 70·6 18·3 70·3 12·8 70·3 12·2 71·4 39·5 68·5 12·1
Endline 64·8 11·8 67·0 11·8 67·2 12·9 67·9 12·3 64·9 12·0 65·0 12·4
P value 0·004 0·02 0·009 0·026 0·003 0·003
Highest level of education in household: incomplete primary school (%)
Baseline 2·5 2·6 2·5 5·1 2·5 3·0
Endline 1·7 2·1 2·9 5·1 1·7 3·0
Completed primary school (%)
Baseline 43·7 55·7 58·5 53·7 43·7 59·2
Endline 42·4 43·3 49·8 53·7 42·4 59·2
Completed junior high school or more (%)
Baseline 53·8 41·7 39·0 41·2 53·8 37·8
Endline 55·9 54·6 47·3 41·2 55·9 37·8
Unless indicated otherwise, values shown are means and standard deviations.
*For these cohort groups,P value of the difference between baseline and endline was based on paired t tests; for the other cross-sectional groups, P values were based on unpaired/independent-samplest tests.
†In the study area, only children aged 6–59 months received vitamin A supplementation (through routine services independent of the study); there was no vitamin A supplementation for lactating (or other) women.
was among children aged 24–59 months (9·9 % at
base-line, 0·4 % at endline; P < 0·001).
Among children aged 5–9 years, baseline mean (CRP/
AGP-adjusted) serum retinol concentration was not significantly different (P = 0·11) between children retained at endline and included in cohort analyses (Figs 2 and 3) and children lost-to-follow-up. Among women aged 15–29 years, those re-surveyed at endline had 13 % lower initial mean serum retinol than those lost after baseline
(P= 0·026). Analysing these groups as cross-sectional
samples (including participants lost after baseline), mean serum retinol was 5·4 μg/dl (16 %) higher at endline than
at baseline in children aged 5–9 years (P < 0·001) and
6·1 μg/dl (14 %) higher at endline than baseline in women
aged 15–29 years (P = 0·007) – effect sizes similar to the
cohort results.
Breast milk retinol concentrations
Among 233 and 253 breast milk samples collected at baseline
and endline, vitamin A concentrations averaged 20·5 (SD
30·9) μg/dl and 32·5 (SD27·6) μg/dl, respectively (P < 0·01),
with a marked right shift in the overall distribution (Fig. 2). Multivariate regressions
Higher (village-average) vitamin A RNI contribution from cooking oil predicted higher (village-average) improvement in serum retinol concentration from baseline to endline
(Table 5, model 1) in children aged 6–59 months (P = 0·003)
43.6 (SD 2.5) 28.3 (SD 7.7) 25.7 (SD 10.5) 28.5 ( SD 12.0) 0 10 20 30 40 50 Factory (n 20) Distributor (n 28) Small stall (n 54) Household (n 75)
Vitamin A concentration in oil
(IU/g) Distribution level (a) 0 10 20 30 40
Jul-11 Aug-11 Sep-11 Oct-11 Nov-11 Dec-11 Jan-12 Feb-12 Mar-12 Apr-12 May-12
Vitamin A concentration in oil
(IU/g)
50
Month and year of collection and analysis (b)
Fig. 1 Vitamin A content of cooking oil through the oil distribution chain in a pilot fortification of unbranded palm oil with vitamin A in West Java, Indonesia: (a) mean vitamin A content of oil samples, analysed immediately after collection, from one factory, two district-level distributors, twenty-four small stalls and sixty-four households*; (b) mean vitamin A content of samples from households in Ciamis ( ) and Tasikmalaya ( ) by month and year of collection and analysis†. *Numbers in parentheses denote number of oil samples collected and immediately analysed. Samples with vitamin A content below the iCheck assay’s lower detection limit of 3 mg retinol equivalents/kg (i.e. 10 IU/g) were included with value of 1 mg/kg (3·3 IU/g) in data analyses. A retinyl-palmitate level below the detection limit was not found in any of the factory or distributor samples, but it was found in three of the seventy-five household samples and in one of the fifty-four small-stall samples analysed immediately.†Over November 2011 to May 2012, the number of samples analysed per district per month ranged from 5 to 6 in Tasikmalaya and from 5 to 8 in Ciamis (mode 5), for a total ofn 75. Over July–October 2011, a period for which the original data were lost and only aggregate results retained, similar numbers of samples were analysed immediately every month
and 5–9 years (P = 0·03). For children aged 6–59 months, vitamin A supplementation coverage independently predicted
greater serum retinol improvement (P= 0·032). We found no
significant effects of socio-economic covariates in any model. In children aged 5–9 years and women aged 15–29 years, regressions with the same variables but run at individual
(instead of village) level did not obtain good fit; that is,
these models did not identify any significant predictors
of individual-level serum retinol improvements (data not shown).
When adding baseline serum retinol concentration as covariate, that variable was the dominant predictor of retinol status improvements: the lower baseline retinol, the larger the upward shift, and vice versa. This effect was strong and significant in all groups (Table 5, model 2). Adding baseline
serum retinol markedly improved model fit for all groups.
However, in these expanded models the RNI contribution from oil was no longer independently significant.
Discussion
The ability to evaluate the impact of fortification pro-grammes using plausibility methods is constrained by the
nature of these programmes. Although this pre–post eva-luation without a control group could not prove causality, retinyl contents measured in oil, RNI contributions from fortified oil consumption, and dose–response relationships between vitamin A intake and serum retinol improvements across age groups (after adjustment for likely confounders) provide strong plausibility of an impact of oil fortification on vitamin A status in Indonesian women and children.
Vitamin A levels in fortified oil reaching small stalls and
households were on average 35 % below Indonesia’s SNI,
in line with expectations based on studies of retinyl-palmitate stability and programme feasibility that had
informed this standard(10,11,13). Ranges of vitamin A intakes
from oil among study participants support the SNI’s
appropriateness, but intake ranges relative to safety mar-gins will need continued monitoring, including in adult men who were not evaluated here.
Monthly fluctuations in retinyl levels during the pilot
likely reflect occasional dilution of fortified oil with non-fortified oil by distributors. In addition, in Tasikmalaya the flow of fortified oil was intermittent between December 2011 and February 2012, with oil occasionally completely
unfortified following problems with customs clearance
of vitamin premix. This issue should be resolved once Table 3 Oil consumption and mean vitamin A intake as a percentage of the age-adjusted RNI, by age group, in a pilot fortification of unbranded palm oil with vitamin A in West Java, Indonesia
Time point Children aged 6–11 months† Children aged 12–23 months Children aged 24–59 months Children aged 5–9 years Lactating mothers Non-lactating women aged 15–29 years
RNI for vitamin A (mg/d) 400 400 450 600 850 700
Oil consumption* (g/d) Baseline 2·4 13·5 22·3 24·8 31·5 29·1
Endline 1·7 12·5 21·5 27·4 29·8 29·4
Mean contribution to vitamin A Baseline 32 43 42 28 19 27
RNI from animal foods (%) Endline 19 48 42 22 10 14
Mean contribution to vitamin A RNI from oil (%)
Endline 4 26 40 38 29 35
Mean contribution to vitamin A RNI from animal foods + oil (%)
Endline 23 73 82 60 39 49
RNI, Recommended Nutrient Intake (source: reference 25). *Based on a single 24 h full dietary recall for each respondent.
†Animal foods intake does not include intake from breast milk, for which volumes have not been quantified.
Table 4 Mean serum retinol concentrations (µg/dl) among participants at baseline and endline, adjusted for CRP and AGP, in a pilot fortification of unbranded palm oil with vitamin A in West Java, Indonesia
Baseline Endline Difference (endline minus baseline)
Group Mean SD Mean SD Mean 95 % CI % difference Significance
Infants aged 6–11 months 30·7 12·6 34·5 12·2 3·8 1·8, 5·7 12·3 <0·001
Children aged 12–23 months 34·2 14·5 35·0 10·5 0·7 −1·6, 3·1 2·2 0·529
Children aged 24–59 months 36·0 14·1 38·3 11·7 2·3 −0·1, 4·7 6·4 0·057
Children aged 5–9 years 34·3 12·6 39·4 12·4 5·1 2·7, 7·6 14·9 <0·001
Lactating mothers 30·7 12·6 34·7 12·4 4·0 2·1, 6·0 13·1 <0·001
Non-lactating women aged 15–29 years 42·7 19·2 50·9 16·6 8·1 4·5, 11·8 19·1 <0·001 CRP, C-reactive protein; AGP,α-glycoprotein.
Serum retinol levels were adjusted for subclinical inflammation, based on threshold values of serum CRP concentration>5 mg/l and/or AGP concentration >1 g/l, which was found in about 25 % of participants at both baseline and endline. To this end, participants were grouped into four categories: (i) both CRP and AGP normal; (ii) incubation (CRP high and AGP normal); (iii) acute convalescence (both CRP and AGP high); (iv) late convalescence (CRP normal and AGP high). For groups (ii), (iii) and (iv), observed serum retinol concentration was then adjusted using standard correction factors from meta-analyses(17–19).
vitamin A fortification of palm cooking oil becomes mandatory and (from March 2015) enforced. The new law’s additional requirement for all cooking oil to be packaged should further help reduce degradation of reti-nyl palmitate during storage. Another determinant of
vitamin A stability during oil storage− to monitor in
for-tification programmes − is peroxide level(31). Peroxide in
2011 averaged 2·55–2·9 meq/kg across oil producers and distributors in Java and Sumatera, well below Indonesia’s standard of 10 meq/kg but as high as to allow considerable
vitamin degradation(32).
In multivariate regressions, baseline-to-endline shifts in serum retinol were larger in villages with lowest baseline retinol levels. This effect has two explanations. First, there
is ‘regression to the mean’ due to within-person
physio-logical variations as well as measurement error(33).
Sec-ond, fortification impact was likely strongest in those people with poorest baseline serum retinol, as also noted in an effectiveness study of vitamin A-fortified wheat-flour
buns in Philippine children(34).
In this pilot programme, serum retinol improvements were larger than in an earlier effectiveness study in
0 10 20 30 40 50 0 10 20 30 40 0 10 20 30 0 10 20 30 40 % of respondents 0 10 20 30 40 % of respondents % of respondents % of respondents % of respondents 0 10 20 30 40 % of respondents Serum retinol (µg/dl)
Serum retinol (µg/dl) Serum retinol (µg/dl)
Serum retinol (µg/dl) Serum retinol (µg/dl)
Serum retinol (µg/dl) 0 10 20 30 40 % of respondents
Breast milk retinol (µg/dl)
0–9 10–14 15–19 20–29 30–39 40–49 50–59 60–69 70+ 0–9 10–14 15–19 20–29 30–39 40–49 50–59 60–69 70+ 0–9 10–14 15–19 20–29 30–39 40–49 50–59 60–69 70+ 0–9 10–14 15–19 20–29 30–39 40–49 50–59 60–69 70+ 0–9 10–14 15–19 20–29 30–39 40–49 50–59 60–69 70+ 0–9 10–14 15–19 20–29 30–39 40–49 50–59 60–69 70+ 0–9 10–14 15–19 20–29 30–39 40–49 50–59 60–69 70+ (a) (b) (c) (d) (e) (f) (g)
Fig. 2 Serum (CRP/AGP-adjusted) retinol concentration and breast milk retinol concentrations at baseline (– – – –) and endline (——) in a pilot fortification of unbranded palm oil with vitamin A in West Java, Indonesia: (a) infants aged 6–11 months; (b) children aged 12–23 months; (c) children aged 24–59 months; (d) children aged 5–9 years; (e) lactating mothers; (f) non-lactating women aged 15–29 years; and (g) breast milk. CRP, C-reactive protein; AGP, α-glycoprotein
Makassar where, among schoolchildren, fortified oil
increased vitamin A intake from < 50 % to 80–90 % of the
RNI, increased mean serum retinol from 23·3 to 26·6 μg/dl
and reduced deficiency prevalence from 27 % to 18 %(11).
In the Philippines, against a similar background of
twice-yearly vitamin A supplementation, vitamin A-fortified
cooking oil reduced vitamin A deficiency in children aged
1–5 years from ∼ 30 % to below 10 %(35).
Besides fortified oil, improvements in socio-economic sta-tus during the year probably contributed to improving vitamin A status in this evaluation. Wealth improved in both cohorts and cross-sectional groups, probably reflecting a secular trend, rather than sampling bias. Socio-economic, health and nutrition improvements are apparent throughout
Indonesia(26,36–38). Moreover, the evaluation concurred with
special presidential efforts to stimulate economic growth, attract industry and mitigate poverty in the pilot districts, in particular Tasikmalaya, the district with worst health status in West Java. Nevertheless, in multivariate regressions, the effect of oil consumption improving vitamin A status in children persisted after adjustment for socio-economic characteristics.
The large increase in retinol concentration in breast milk, and in the serum of young (lactating and non-lactating) women, supports the interpretation that infants aged 6–11 months benefited through increased maternal vitamin A intake during pregnancy and/or breast-feeding. We found 58 % higher vitamin A levels in breast milk after fortification, from baseline levels similar to those in
Indonesian villages in 1985–86(39) and rural Bangladesh
over 1995–1997(40). Since the evaluation did not measure
milk volumes consumed by infants, we refrained from
quantifying infants’ vitamin A intakes through breast milk.
At an assumed 500 ml/d (as conservative minimum(41)),
breast milk from mothers consuming fortified oil might
contribute well over 100 % of the RNI for infants aged
6–11 months.
Of note, most children aged 6–59 months were covered
with twice-yearly high-dose vitamin A supplementation. In multivariate regressions, vitamin A intake from fortified oil consumption (daily, at low dose) and periodic high-dose supplementation both independently improved serum vitamin A in children aged 6–59 months. Unlike in
the Philippines and India(35,42), in this pilot the effect of
supplementation was apparently not lost within the
February-to-July interval – unless the supplementation
effect found in regressions reflected residual confounding
due to children missing supplementation typically having
the worse nutritional status and morbidity up front(43).
Strengths and limitations
The evaluation was limited in the quality of oil and food consumption data. Dietary recalls used a suboptimal questionnaire administered by enumerators whose train-ing was inadequate to develop the specific skills required for high-quality dietary recall and without aid of pictures of portion sizes. Dietary data were analysed against an out-dated national food composition table and food con-sumption outside homes may not have been fully recorded. In the resulting data, animal-source food intake (as well as overall protein and energy intakes) fell by 15–20 % from baseline to endline in lactating mothers, and
by 30–40 % in infants (data not shown). For lactating
0 5 10 15 Prevalence of vitamin A deficiency (%) 20
Infants aged 6–11 months
Children aged 12–23 monthsChildren aged 24–59 months
Children aged 5–9 years
Lactating mothers
Non-lactating women aged 15–29 years
Fig. 3 Prevalence of vitamin A deficiency at baseline ( ) and endline ( ) of a pilot fortification of unbranded palm oil with vitamin A in West Java, Indonesia. Vitamin A deficiency, defined as serum retinol<20 μg/dl after adjustment for subclinical inflammation based on serum CRP (>5 mg/l) and AGP (>1 g/l), decreased significantly in all groups at endline (P < 0·001 for all except non-lactating women aged 15–29 years, for whom P = 0·011). CRP, C-reactive protein; AGP, α-glycoprotein
mothers, daily energy intake according to dietary recall
was implausibly low at ∼ 5000 and 4600 kJ (∼1300 and
∼1100 kcal) at baseline and endline, suggesting that vita-min A intake from both animal foods and oil may have been underestimated. Conversely, animal food intake by 12–59-month-old children may have been over-reported by mothers, reflecting a social desirability bias.
Compounding these uncertainties is the extrapolation of vitamin A content in oil from a sub-sample of house-holds and small stalls, as village averages, to other households. Potential measurement errors in iCheck measurements may furthermore have diluted associations between vitamin A intake from oil and vitamin A status improvements.
While data limitations did not produce systematic bias in either baseline or endline results or their difference,
they likely caused non-differential misclassification in both
exposure/predictor and outcome measures. Therefore, effects of fortified oil consumption on vitamin A status may in reality have been greater than shown.
Finally, based on sampling design the population eval-uated was poorer than Indonesia nationwide, but similar in terms of oil consumption behaviours, as well as overall diet(10,11,13,26,32). Recently other surveys found either higher vitamin A deficiency prevalence (pre-school
chil-dren on Central Java(44); schoolchildren in Makassar,
2008(11)) or lower prevalence (pre-school children in
Semarang(45); pre-school and schoolchildren nationwide,
2011(2)). Future evaluations following mandatory oil
for-tification should assess if the large vitamin A status
improvements found here can be replicated at national scale.
Conclusion
The current pilot programme evaluation confirms the potential of large-scale oil fortification to ensure consistent vitamin A intakes and improve the vitamin A status of women and children living in poverty. Expected impact notably includes infants aged 6–11 months, who appear to benefit via maternal intake during pregnancy and/or breast-feeding.
Once Indonesia will enforce mandatory fortification of
cooking oil from 2015, over 4 million tonnes of cooking oil
sold domestically should be fortified with vitamin A,
reaching over 200 million Indonesians. As in the pilot, poor people with worst nutritional status will consume and benefit at least as much as richer people who access more alternative vitamin A sources. Moreover, Indonesia is a leading supplier of cooking oil for neighbouring coun-tries with a similarly high vitamin A deficiency burden and
universal consumption of palm oil(46). The programme
thus lays the foundation for other countries to consider mandatory fortification of imported cooking oil, as a cost-effective way to reduce vitamin A deficiency and its associated health burden.
Table 5 Mu ltiv ariate re gression analys is of deter min ants of impro v emen t in serum re tinol conce ntration fro m baselin e to endli ne in a pil ot fo rtification o f u n branded palm oil w ith vitam in A in W est J a v a , Indone sia Model 1 (without serum retinol a t baseline) Model 2 (adjusting for serum retinol at baseline) Children aged 6– 59 months Children aged 5– 9 y ear s Lactating mothers Non-lactating women aged 15 – 29 y ears Children aged 6– 59 months Children aged 5– 9 y ears Lactating mothers Non-lactating w omen aged 15 – 29 year s β P v a lue β P v a lue β P v alue β P v a lue β P v a lue β P v alue β P v a lue β P v a lue Serum retinol, baseline − 0· 74 0· 002* − 0· 64 0· 003* − 0· 83 < 0· 001* − 0· 74 < 0· 001* % c ontribution to RNI from o il, endline 0· 064 0· 003* 0· 52 0· 03* 0· 44 0· 17 0· 10 0· 67 0· 32 0· 06 0· 25 0· 20 0· 18 0· 25 0· 03 0· 86 % c ontribution to RNI from animal foods, endline − 0· 20 0· 10 − 1· 11 0· 001* 0· 01 0· 98 0· 40 0· 11 − 0· 09 0· 57 − 0· 51 0· 08 − 0· 07 0· 63 0· 17 0· 31 % receiv e d vitamin A supplement capsule in F ebruar y 2012 38 ·90 ·032* − 0· 03 0· 90 Household c apital a sset score, endline 1· 40 ·08 0· 18 0· 43 0· 27 0· 82 − 0· 35 0· 26 − 0· 02 0· 92 0· 20 0· 27 0· 09 0· 55 − 0· 31 0· 13 House s anitation score, endline − 2· 50 ·18 0· 23 0· 22 − 0· 31 0· 90 − 0· 20 0· 47 0· 08 0· 66 0· 06 0· 70 0· 02 0· 87 − 0· 01 0· 96 House c ondition score , endline − 6· 80 ·20 − 0· 10 0· 59 − 10 ·40 ·15 0· 16 0· 51 − 0· 16 0· 27 − 0· 05 0· 70 0· 01 0· 96 0· 15 0· 36 Household e xpenditure on food as % o f total e x penditure, c hange endline m inus baseline − 0· 19 0· 63 − 0· 29 0· 10 0· 00 0· 60 − 0· 09 0· 73 − 0· 12 0· 39 − 0· 21 0· 11 − 0· 07 0· 67 0· 01 0· 95 Age , e ndline 0· 10 0· 94 − 0· 06 0· 65 Df 23 23 23 23 23 23 23 23 Adjusted R 2of model (%) 4 4 4 4 – 1 – 46 7 6 7 6 1 5 7 CRP , C -reactiv e p rotein; A GP , α -glycoprotein. β represents the standardized c oefficient fo r the co v a riate. Adjusted R 2indicates the propor tion o f each g roup ’s v ariat ion in retinol improv ements that is e xplained by the model. Serum retinol impro v ements a nalysed o n CRP/A GP-adjusted v alues . *Indicates s tatistically significant (P < 0· 05) predictors, all analysed a t village av erage le v e l a cross twenty-f our villages.
Acknowledgements
Acknowledgements: The authors thank the women and children who participated in the surveys, and the project and government health staff who implemented and facilitated the evaluation. In addition to the institutions listed, partners included the District Health Offices of Tasikmalaya and Ciamis. The authors thank Dr Fabian Rohner and Dr Frank Wieringa who served as external advisors during the design and implementation stage; Mr Ravi Menon, Dr Lynnette Neufeld and Ms Rebecca Spohrer (GAIN) for support with drafting of the paper; and two anonymous peer reviewers for comments to improve
the final paper. Financial support: The baseline survey
was funded by the Indonesian Ministry of Health, National Institute of Health Research and Development; the endline survey, data analysis and reporting were funded by GAIN; the evaluation design, technical assistance and part of the vitamin A analyses of oil were funded by the GIZ Strategic Alliance for the Fortification of Oil and Other Staple Foods (GIZ-SAFO). The funders had no role in the design, ana-lysis or writing of this article. Conflict of interest: None. Authorship: Sandjaja, Soekirman, A.B.J., R.T., B.U. and R.M.-P. designed the evaluation; Sandjaja, I.J., A.B.J. and R.T. implemented data collection; I.J., A.B.J., Ifrad, M.K.H., R.T. and E.L.K. analysed data; E.L.K., M.K.H., D.S., R.T. and R.M.-P. wrote the paper. All authors read and
approved the final manuscript. Ethics of human subject
participation: The study was approved by the Ethical Review Committee of the Ministry of Health, National Institute of Health Research and Development.
References
1. Black RE, Victora CG, Walker SP et al. (2013) Maternal and child undernutrition and overweight in low-income and middle-income countries. Lancet 382, 427–451.
2. Sandjaja S, Budiman B, Harahap H et al. (2013) Food con-sumption and nutritional and biochemical status of 0.5 –12-year-old Indonesian children: the SEANUTS study. Br J Nutr 110, Suppl. 3, S11–S20.
3. Muhilal, Tarwotjo I, Kodyat B et al. (1994) Changing pre-valence of xerophthalmia in Indonesia, 1977–1992. Eur J Clin Nutr 48, 708–714.
4. Murphy SP & Allen LH (2003) Nutritional importance of animal source foods. J Nutr 133, 11 Suppl. 2, 3932S–3935S. 5. de Pee S, West CE, Muhilal et al. (1995) Lack of improve-ment in vitamin A status with increased consumption of dark-green leafy vegetables. Lancet 346, 75–81.
6. Campbell AA, Thorne-Lyman A, Sun K et al. (2009) Indo-nesian women of childbearing age are at greater risk of clinical vitamin A deficiency in families that spend more on rice and less on fruits/vegetables and animal-based foods. Nutr Res 29, 75–81.
7. West KP Jr & Mehra S (2010) Vitamin A intake and status in populations facing economic stress. J Nutr 140, issue 1, 201S–207S.
8. de Pee S, Bloem MW, Satoto et al. (1998) Impact of a social marketing campaign promoting dark-green leafy vegetables and eggs in central Java, Indonesia. Int J Vitam Nutr Res 68, 389–398.
9. World Health Organization & Food and Agricultural Organization of the United Nations (2006) Guidelines on Food Fortification with Micronutrients [LH Allen, B De Benoist, O Dary et al., editors]. Geneva: WHO; available at http:// www.who.int/nutrition/publications/guide_food_fortification_ micronutrients.pdf
10. Martianto D, Komari Soekirman et al. (2005) Possibility of Vitamin A Fortification of Cooking Oil in Indonesia: A Feasibility Study Report. Jakarta: Koalisi Fortifikasi Indo-nesia and Micronutrient Initiative.
11. Martianto D, Riyadi H, Marliyati SR et al. (2009) Establishing Capacity to Fortify Palm Oil, Evaluation of Consumer Acceptance and Effectiveness Trial of Fortified Oil in Makassar City. Final Report. Jakarta: Koalisi Fortifikasi Indonesia, Bakti Husada and Asian Development Bank. 12. Dijkhuizen MA, Wieringa FT, West CE et al. (2001)
Con-current micronutrient deficiencies in lactating mothers and their infants in Indonesia. Am J Clin Nutr 73, 786–791. 13. Martianto D, Sumedi E, Soekatri M et al. (2007) Marketing
and Distribution Survey of Cooking Oil at Makassar City. Jakarta: Koalisi Fortifikasi Indonesia and Ministry of Health Indonesia.
14. de Pee S, Yuniar Y, West CE et al. (1997) Evaluation of biochemical indicators of vitamin A status in breast-feeding and non-breast-feeding Indonesian women. Am J Clin Nutr 66, 160–167.
15. Statistics Indonesia, National Family Planning Coordinating Board, Ministry of Health Indonesia et al. (2008) Indonesia Demographic and Health Survey 2007. Jakarta and Calverton, MD: Statistics Indonesia, National Family Planning Coordinating Board, Ministry of Health Indonesia and Macro International.
16. Erhardt JG, Estes JE, Pfeiffer CM et al. (2004) Combined measurement of ferritin, soluble transferrin receptor, retinol binding protein, and C-reactive protein by an inexpensive, sensitive, and simple sandwich enzyme-linked immuno-sorbent assay technique. J Nutr 134, 3127–3132.
17. Thurnham DI, Mburu AS, Mwaniki DL et al. (2005) Micro-nutrients in childhood and the influence of subclinical inflammation. Proc Nutr Soc 64, 502–509.
18. Thurnham DI, McCabe GP, Northrop-Clewes CA et al. (2003) Effects of subclinical infection on plasma retinol concentrations and assessment of prevalence of vitamin A deficiency: meta-analysis. Lancet 362, 2052–2058. 19. Wieringa FT, Dijkhuizen MA, West CE et al. (2002)
Estimation of the effect of the acute phase response on indicators of micronutrient status in Indonesian infants. J Nutr 132, 3061–3066.
20. AOAC International (2005) AOAC Official Method 2001.13, Vitamin A (retinol) in foods. In AOAC Official Methods of Analysis, pp. 50–53. Gaithersburg, MD: AOAC International. 21. DeVries J & Silvera KR (2002) Determination of vitamins A (retinol) and E (α-tocopherol) in foods by liquid chroma-tography: collaborative study. J AOAC Int 85, 424–434. 22. Pusat Penelitian dan Pengembangan Gizi dan Makanan
(Centre for Research and Development of Food and Nutrition) (2008) Program Nutrisoft konsumsi makanan (Software: Nutrisoft Food Consumption). Bogor: Pusat Penelitian dan Pengembangan Gizi dan Makanan. 23. Krisdinamurtirin Mahmud MK & Tarwotjo I (1974) Daftar
Faktor Konversi Berat Bahan Makanan (List of Food Ingredients Weight Conversion Factors). Bogor: Pusat Penelitian dan Pengembangan Gizi.
24. Badan Penelitian dan Pengembangan Kesehatan (2007) Pedoman Entri Data Konsumsi Makanan Riset Kesehatan Dasar (Guidelines for Manual Entry of Food Consumption Survey Data for Health Research). Mimeograph. Jakarta: Badan Penelitian dan Pengembangan Kesehatan.
25. World Health Organization & Food and Agriculture Orga-nization of the United Nations (2002) Human Vitamin and
Mineral Requirements. Report of a Joint FAO/WHO Expert Consultation, Bangkok, Thailand. Rome: FAO.
26. Indonesia Badan Pusat Statistik Direktorat Diseminasi Sta-tistik (2010) Indonesian National Social Economic Survey 2010 (SUSENAS 2010). Jakarta: Government of Indonesia. 27. Rohner F, Frey SK, Mothes R et al. (2011) Quantification of
vitamin A in palm oil using a fast and simple portable device: method validation and comparison to high-performance liquid chromatography. Int J Vitam Nutr Res 81, 335–342.
28. World Health Organization (2009) Global Prevalence of Vitamin A Deficiency in Populations at Risk 1995–2005; Global Database on Vitamin A Deficiency. Geneva: WHO. 29. Scientific Advisory Committee on Nutrition (2005) Review of Dietary Advice on Vitamin A. London: Food Standards Agency.
30. Kraemer K, Waelti M, de Pee S et al. (2008) Are low toler-able upper intake levels for vitamin A undermining effective food fortification efforts? Nutr Rev 66, 517–525.
31. Laillou A, Hafez SA, Mahmoud AH et al. (2012) Vegetable oil of poor quality is limiting the success of fortification with vitamin A in Egypt. Food Nutr Bull 33, 186–193.
32. Andarwulan N & Martianto D (2012) Assessment of Quality and Identification of Critical Factor for Stability of Unbran-ded Palm Oil in Indonesia. Final Report. Bogor: Southeast Asian Food & Agriculture Science and Technology Center (SEAFAST) at Bogor Agricultural University (IPB), for Indo-nesia Nutrition Foundation for Food Fortification (KFI). 33. Zeba AN, Martin Prevel Y, Some IT et al. (2006) The positive
impact of red palm oil in school meals on vitamin A status: study in Burkina Faso. Nutr J 5, 17.
34. Solon FS, Klemm RD, Sanchez L et al. (2000) Efficacy of a vitamin A-fortified wheat-flour bun on the vitamin A status of Filipino schoolchildren. Am J Clin Nutr 72, 738–744. 35. Mason JB, Ramirez MA, Fernandez CM et al. (2011) Effects
on vitamin A deficiency in children of periodic high-dose supplements and of fortified oil promotion in a deficient area of the Philippines. Int J Vitam Nutr Res 81, 295–305. 36. Departemen Kesehatan (Ministry of Health Indonesia) &
Badan Litbang Kesehatan (National Institute of Health Research and Development) (2008) Laporan hasil Riset Kesehatan Dasar (RISKESDAS) 2007 (Basic Health Survey 2007, Results Report). Jakarta: Departemen Kesehatan/ Badan Litbang Kesehatan.
37. Departemen Kesehatan (Ministry of Health Indonesia) & Badan Litbang Kesehatan (National Institute of Health Research and Development) (2010) Laporan hasil Riset
Kesehatan Dasar (RISKESDAS) 2010 (Basic Health Survey, Results Report 2010). Jakarta: Departemen Kesehatan/ Badan Litbang Kesehatan.
38. World Food Programme Indonesia (2010) Nutrition Map-ping and Gap Analysis. Jakarta: World Food Programme Indonesia.
39. Muhilal, Murdiana A, Azis I et al. (1988) Vitamin A-fortified monosodium glutamate and vitamin A status: a controlled field trial. Am J Clin Nutr 48, 1265–1270.
40. Alam DS, van Raaij JM, Hautvast JG et al. (2010) Effect of dietary fat supplementation during late pregnancy andfirst six months of lactation on maternal and infant vitamin A status in rural Bangladesh. J Health Popul Nutr 28, 333–342. 41. Kumwenda C, Dewey KG, Hemsworth J et al. (2014) Lipid-based nutrient supplements do not decrease breast milk intake of Malawian infants. Am J Clin Nutr 99, 617–623. 42. Gorstein J, Bhaskaram P, Khanum S et al. (2003) Safety and
impact of vitamin A supplementation delivered with oral polio vaccine as part of the immunization campaign in Orissa, India. Food Nutr Bull 24, 319–331.
43. Berger SG, de Pee S, Bloem MW et al. (2007) Malnutrition and morbidity are higher in children who are missed by periodic vitamin A capsule distribution for child survival in rural Indonesia. J Nutr 137, 1328–1333.
44. Pangaribuan R, Erhardt JG, Scherbaum V et al. (2003) Vitamin A capsule distribution to control vitamin A de fi-ciency in Indonesia: effect of supplementation in pre-school children and compliance with the programme. Public Health Nutr 6, 209–216.
45. Kartasurya MI, Ahmed F, Subagio HW et al. (2012) Zinc combined with vitamin A reduces upper respiratory tract infection morbidity in a randomised trial in preschool chil-dren in Indonesia. Br J Nutr 108, 2251–2260.
46. Laillou A, Panagides D, Garrett GS et al. (2013) Vitamin-A-fortified vegetable oil exported from Malaysia and Indonesia can significantly contribute to vitamin A consumption worldwide. Food Nutr Bull 34, 2 Suppl., S72–S80. 47. Dijkhuizen MA, Wieringa FT, West CE et al. (2004) Zinc plus
β-carotene supplementation of pregnant women is superior to β-carotene supplementation alone in improving vitamin A status in both mothers and infants. Am J Clin Nutr 80, 1299–1307.
48. Nga TT, Winichagoon P, Dijkhuizen MA et al. (2009) Multi-micronutrient-fortified biscuits decreased prevalence of anemia and improved micronutrient status and effectiveness of deworming in rural Vietnamese school children. J Nutr 139, 1013–1021.