Role of in
fluenza A virus NP acetylation on viral
growth and replication
Sebastian Giese
1,2
, Kevin Ciminski
1,2
, Hardin Bolte
1,2,3,4
, Étori Aguiar Moreira
1,2,3,4,11
, Seema Lakdawala
5
,
Zehan Hu
6,7
, Quinnlan David
1,2
, Larissa Kolesnikova
8
, Veronika Götz
1,2
, Yongxu Zhao
9
, Jörn Dengjel
6,7
,
Y. Eugene Chin
9
, Ke Xu
10
& Martin Schwemmle
1,2
Lysine acetylation is a post-translational modification known to regulate protein functions.
Here we identify several acetylation sites of the influenza A virus nucleoprotein (NP),
including the lysine residues K77, K113 and K229. Viral growth of mutant virus encoding
K229R, mimicking a non-acetylated NP lysine residue, is severely impaired compared to
wildtype or the mutant viruses encoding K77R or K113R. This attenuation is not the result of
decreased polymerase activity, altered protein expression or disordered vRNP co-segregation
but rather caused by impaired particle release. Interestingly, release de
ficiency is
also observed mimicking constant acetylation at this site (K229Q), whereas virus encoding
NP-K113Q could not be generated. However, mimicking NP hyper-acetylation at K77 and
K229 severely diminishes viral polymerase activity, while mimicking NP hypo-acetylation at
these sites has no effect on viral replication. These results suggest that NP acetylation at K77,
K113 and K229 impacts multiple steps in viral replication of in
fluenza A viruses.
DOI: 10.1038/s41467-017-01112-3
OPEN
1Institute of Virology, Medical Center University of Freiburg, 79104 Freiburg, Germany.2Faculty of Medicine, University of Freiburg, 79104 Freiburg,
Germany.3Spemann Graduate School of Biology and Medicine, University of Freiburg, 79104 Freiburg, Germany.4Faculty of Biology, University of Freiburg, 79104 Freiburg, Germany.5Department of Microbiology and Molecular Genetics, University of Pittsburgh School of Medicine, Pittsburgh, PA 15217, USA.
6Department of Dermatology, Medical Center, University of Freiburg, Freiburg 79110, Germany.7Department of Biology, University of Fribourg, Fribourg
79110, Switzerland.8Institute of Virology, Philipps-Universität Marburg, 35043 Marburg, Germany.9Institute of Health Sciences, Shanghai Institutes for Biological Sciences, Chinese Academy of Sciences, Shanghai 200031, China.10Key Laboratory of Molecular Virology & Immunology, Institut Pasteur of
Shanghai, Shanghai Institutes for Biological Sciences, Chinese Academy of Sciences, Shanghai 200031, China.11Present address: Friedrich Miescher Institute for Biomedical Research, Maulbeerstrasse 66, 4058 Basel, Switzerland. Correspondence and requests for materials should be addressed to
Y.E.C. (email:yechin@sibs.ac.cn) or to K.X. (email:kxu@sibs.ac.cn) or to M.S. (email:martin.schwemmle@uniklinik-freiburg.de)
123456789
T
he influenza A virus (IAV) genome is composed of eight
RNA genome segments (vRNAs) of negative polarity
1.
Each vRNA segment is encapsidated by multiple copies of
NP and terminally bound by the viral polymerase subunits
PB2, PB1 and PA forming the viral ribonucleoprotein (vRNP)
complex
1. The RNA genome of IAV comprises about 13,600
nucleotides encoding for up to 17 viral proteins
2. Many of these
proteins are multifunctional, playing diverse roles at different
stages of the virus infection cycle
3–6. These include NP, which is
not only essential for viral RNA replication and transcription
5,
but also a prerequisite for nuclear transport of vRNPs and
packaging of viral genomes into budding viral particles
6–9. To
fulfill these functions in a temporal and spatial manner, NP
interacts with a broad spectrum of viral and cellular
factors
1, 10, 11. Furthermore, there is an increasing body of
evidence that NP exploits the host’s co- and post-translational
modification machinery to regulate its functionality. Recently, it
was shown that phosphorylation of NP prevents premature NP
oligomerization, thereby allowing its uptake at the elongating
chain of newly synthesized genomic RNA
12, 13. SUMOylation
of NP was further shown to be required for the intracellular
trafficking of NP
14. Finally, ubiquitination of NP is believed to
regulate viral replication by either increasing (ubiquitination) or
decreasing (de-ubiquitination) its binding activity to nascent
complementary RNA (cRNA)
15.
Intriguingly, the architecture of a vRNP complex is similar to
that of a nucleosome
16,17. Both encapsidated vRNA and cellular
DNA are organized into an antiparallel double helix containing a
major and minor groove
17, 18. The positively charged cellular
histone molecules are known to bind DNA via the negatively
charged phosphate backbone
19. Similarly, various basic residues
in NP convey the interaction with the vRNA phosphate
backbone
20, 21. Epigenetic regulation of histone molecules and
thus of the chromatin structure occurs in eukaryotic cells through
reversible and coordinated post-translational modifications of
histone tails
19,22. Commonly, these histone modifications include
phosphorylation of serine, threonine and tyrosine residues or
acetylation of lysine residues
23, 24. Currently, no acetylation
modifications have been identified for IAV NP. Aside from
the recently described phosphorylation sites there are up to 19,
partially conserved and surface-exposed lysine (K) residues
within the amino acid sequence of NP that might serve as
potential targets for acetylation. In general, acetylation is carried
out by lysine acetyltransferases (KATs) and reversed by lysine
deacetylases (KDACs) to control various cellular and viral protein
functions
25,26. Hence, we speculated that NP, akin to histones,
may be selectively modified by cellular KATs and KDACs to
regulate the various functions of NP and vRNPs during the IAV
replication cycle.
In this study, we provide evidence that NP is acetylated at
specific lysine residues. Mutational analysis of these acetylation
sites by mimicking acetylated or non-acetylated lysines suggests
that a spatiotemporal balance of the acetylation pattern is
required for efficient viral replication.
Results
The nucleoprotein harbors several acetylated lysine residues.
IAV NP contains up to 19 lysine (K) residues with varying
degrees of conservation (Supplementary Fig.
1
a). To identify
putative acetylation sites, we performed mass spectrometry
analysis on purified HA-tagged NP protein of A/WSN/1933
(H1N1), transiently expressed in HEK293T cells (Supplementary
Fig.
1
b). To achieve efficient NP acetylation, the acetyltransferase
CREB-binding protein (CBP) was additionally co-expressed
(Supplementary Fig.
1
b). Eight different acetylated K residues
were identified, including five highly conserved residues at
positions 7, 87, 90, 229 and 273 (Fig.
1
a and Supplementary
Fig.
2
a, b). To identify acetylated lysine residues on NP within
vRNP complexes, we infected human A549 cells with
recombi-nant WSN encoding Strep-tagged PB2 at a multiplicity of
infec-tion (MOI) of 20 for 20 h and subsequently purified vRNPs
(Supplementary Fig.
1
c) as described previously
27. Four
acetyla-tion sites (K77, K113, K184 and K229) were confirmed
by mass spectrometry analysis as present within the purified
vRNP complexes (Fig.
1
a and Supplementary Fig.
2
c). Likewise,
acetylated K77, K113, K184 and K229 were also detected in the
vRNPs of A/SC35M/1980 (H7N7) in at least four independent
vRNP preparations (Fig.
1
a and Supplementary Fig.
2
c). Since it
was shown previously that ubiquitination of K184 regulates
polymerase activity
15we did not include this amino acid residue
in our mutational study. Therefore, to investigate solely NP
acetylation upon infection, we chose to further characterize K77,
K113 and K229.
Mimicking non-acetylated lysine residues at K229. To elucidate
the influence of NP acetylation on viral polymerase activity,
we generated NP mutant proteins of SC35M and WSN with
individual K to arginine (R) mutations (NP-K77R, NP-K113R,
NP-K229R) with the exception of WSN NP-K113R. This strategy
is commonly used to mimic non-acetylated lysine, since an
arginine
substitution
prevents
acetylation
but
preserves
charge
28–30. All NP mutant proteins were expressed at
compar-able levels (Supplementary Fig.
3
a) and supported polymerase
activity as assessed by polymerase reconstitution assay in
HEK293T cells (Fig.
1
b). With the exception of the WSN NP
mutant NP-K229R all other K to R mutant proteins resulted in
similar or even enhanced polymerase activities compared to
wildtype (wt) WSN or SC35M NP, respectively. As expected, we
could generate recombinant SC35M mutant viruses encoding
NP-K77R, NP-K113R or NP-K229R (Fig.
1
b), further designated
rK77R, rK113 and rK229R, respectively. However, even though
both WSN NP non-acetylation mutants K77R and
NP-K229R supported polymerase activity, we already failed to
gen-erate recombinant WSN viruses expressing NP-K229R (Fig.
1
b).
To study the effects at all three NP acetylation sites in the context
of viral infections, we narrowed our focus to SC35M mutant
viruses for further analysis.
In
order
to
characterize
the
growth
properties
of
NP acetylation-deficient SC35M viruses, A549, MDCK II and
Vero cells were infected with rK77R, rK113R or rK229R at
an MOI of 0.001. Both rK77R (Fig.
1
c) and rK113R
(Supple-mentary Fig.
4
), irrespective of the cell line, displayed no growth
deficiency compared to wt SC35M, whereas rK229R was
significantly attenuated (Fig.
1
c). Since mimicking
non-acetylation at K229 did not inhibit viral polymerase activity
(Fig.
1
b), we speculated that NP acetylation at this particular
lysine residue might either regulate NP trafficking similar to NP
SUMOylation at amino acids K4 and K7
14, or directly control
nuclear export of newly synthesized vRNP complexes. However,
we did not observe differences in NP re-localization from the
nucleus to the cytoplasm in MDCK II cells infected with rK229R
(Fig.
2
a) at an MOI of 5 at 4, 6 and 8 h post infection (h.p.i.).
A comparable time-dependent re-localization of NP was also
observed in A549 cells infected with mutant and wt viruses
(Supplementary Fig.
5
). Consistently, cellular fractionation to
determine NP levels in the nuclear and cytoplasmic fraction,
followed by quantitative RT–PCR of three different vRNA
segments (PB2, HA and NP) revealed only subtle differences
between wt and NP acetylation-deficient mutant rK229R
(Fig.
2
b).
Next, we examined whether NP acetylation at K229 might be
required to regulate vRNP co-segregation
31,32during cytoplasmic
trafficking en route to the apical plasma membrane (APM). For
this purpose we performed three-color
fluorescence in situ
hybridization (FISH)
32, simultaneously visualizing the
aforemen-tioned PB2, HA and NP vRNAs in MDCK II cells infected at an
MOI of 5 for 6 h. To exclude nuclear vRNAs, we performed DAPI
staining, while simultaneous NP protein staining was used to
define the cellular plasma membrane. We confirmed robust
spectral separation of our three FISH probes, similar to a previous
report
32, using single color controls (Supplementary Fig.
6
).
Entire cell volumes were imaged using
fine z-stacks to analyze the
three-dimensional cellular distribution of vRNPs. We observed
that the composition of vRNA containing cytoplasmic foci was
similar between wt and rK229R-infected cells (Fig.
2
c). Consistent
with a previous report
32, most foci were positive for one vRNA
(wt SC35M: 59.3% and rK229R: 55.9%), whereas foci comprising
two (wt SC35M: 23.4% and, rK229R: 20.4%), or all three vRNAs
(wt SC35M: 17.4% and rK229R: 23.8%) were found less
frequently (Fig.
2
c). Single positive foci usually contained HA
(wt SC35M: 55.7% and rK229R: 48.3%) or NP (wt SC35M: 30.6%
and rK229R: 36.1%) vRNA, while PB2 vRNA containing foci
were rarer (wt SC35M: 13.5% and rK229R: 15.5%; Fig.
2
d). Foci
which were found positive for two vRNAs were used to analyze
the impact of NP acetylation on vRNA co-segregation (Fig.
2
e).
As depicted, mean values are similar for co-segregation of PB2
and NP vRNA (wt SC35M 34.1%; rK229R 32.4%), HA and PB2
vRNA (wt SC35M 17.4%; rK229R 15.4%) or NP and HA vRNA
(wt SC35M 48.6%; rK229R 51.9%). Overall, these results suggest
that NP acetylation at lysine residue K229 is not required to
regulate viral replication, the nuclear export of newly synthesized
vRNPs or co-segregation of exported vRNPs in the cytoplasm.
The NP mutation K229R impairs viral particle release.
Considering that the NP acetylation-deficient mutant rK229R was
severely attenuated in various cell types (Fig.
1
c), but revealed no
altered protein localization or disordered vRNP co-segregation
upon infection (Fig.
2
), we hypothesized that NP acetylation at
K229 might be required for particle release. To show this, we
infected MDCK II cells at an MOI of 10 with the mutant and
wt viruses and determined infectious viral particle release at
early time points post infection. Mutant rK77R was included as
positive control. Under these single cycle growth conditions
release of infectious virus was severely reduced in cells infected
with rK229R compared to wt or rK77R (Fig.
3
a). A comparable
block in particle release was also observed after reconstitution
of SC35M virus-like particles (VLPs) in HEK293T cells in the
presence of the NP acetylation mutant. VLPs were generated
containing seven distinct SC35M genome segments (segment 1
and 3–8) together with a vRNA-like eGFP reporter segment
flanked by the 3′ and 5′ non-coding and terminal coding regions
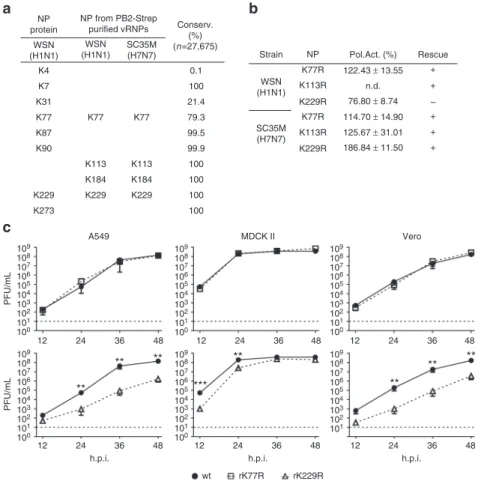
NP protein WSN (H1N1) WSN (H1N1) K4 K7 K31 K77 K77R NP Pol.Act. (%) Rescue + + + + + – 122.43 ± 13.55 76.80 ± 8.74 114.70 ± 14.90 125.67 ± 31.01 186.84 ± 11.50 n.d. K77R K113R K113R K229R K229R K77 K77 0.1 100 100 100 100 100 21.4 79.3 99.5 99.9 K87 K90 K229 K273 K113 K184 K184 K229 A549 MDCK II Vero 109 108 107 106 105 104 103 102 101 100 12 24 36 48 109 108 107 106 105 104 103 102 101 100 12 24 36 48 109 108 107 106 105 104 103 102 101 100 12 24 36 48 109 108 107 106 105 104 103 102 101 12 24 36 48 109 108 107 106 105 104 103 102 101 100 12 24 36 48 PFU/mL 109 108 107 106 105 104 103 102 101 100 12 24 36 h.p.i. h.p.i. wt rK77R rK229R h.p.i. 48 PFU/mL K229 K113 WSN (H1N1) SC35M (H7N7) SC35M (H7N7) NP from PB2-Strep purified vRNPs Conserv. (%) (n=27,675) Strain
a
b
c
** ** ** ** ** ** ** ***Fig. 1 Identification of acetylated NP lysine residues and their role in polymerase activity after substitution with arginine. a NP acetylation sites detected by mass spectrometry using transiently expressed NP in HEK293T cells or purified vRNPs from infected A549 cells. Degree of lysine conservation is indicated. b Polymerase reconstitution assay in HEK293T cells in the presence of the indicated NP mutants. Polymerase activity is shown as mean and s.d. of at least three independent experiments (n.d., not determined). Plus indicates successful rescue of recombinant viruses encoding acetylation-deficient NP. c MDCK II, A549 and Vero cells were infected with the indicated viruses at an MOI of 0.001 and viral growth was monitored 12, 24, 36 and 48 h.p.i. by plaque assay. Dashed lines represent the detection limit. **p < 0.01; ***p < 0.001. Error bars indicate the mean and s.e.m. of at least three independent experiments. Student’s t-test was used for two-group comparisons
of the PB1 segment (Supplementary Fig.
3
d). As expected from
the pronounced activity observed in the polymerase
reconstitu-tion assay (Fig.
1
b) we detected robust eGFP expression in
HEK293T cells for wt SC35M NP, NP-K77R and NP-K229R
(Fig.
3
b, upper panel). Infection of MDCK II cells with VLPs
reconstituted with wt SC35M NP or NP-K77R and subsequent
superinfection with wt SC35M resulted in numerous
eGFP-expressing cells, indicating successful incorporation of the
reporter segment (Fig.
3
b, lower panel). However, reconstitution
with NP-K229R resulted in fewer VLPs (Supplementary Fig.
3
e)
and GFP-positive cells (Fig.
3
b, lower panel).
To further investigate whether NP acetylation-deficient mutant
rK229R would display aberrant particle morphology, we infected
MDCK II cells at an MOI of 10 and analyzed released virions by
electron microscopy (EM). However, we did not observe grossly
altered shape of viral particles between wt SC35M and
mutant-infected cells (Fig.
3
c). As shown recently
9, NP amino acid
substitutions can cause a genome packaging defect and the release
of viral particles which cannot initiate a full replication cycle
(semi-infectious particles). To rule out the possibility of a
packaging defect, we determined the relative ratio of all eight
viral genome segments using quantitative RT–PCR of an equal
number of wt SC35M and rK229R infectious viral particles. As
depicted, only subtle changes in particle genome content were
detected between wt SC35M and the mutant virus rK229R
(Fig.
3
d). Taken together, these results indicate that the NP
mutant protein NP-K229R causes a block in the efficient release
of infectious virions.
Mimicking acetylation at either K113 or K229. Next, we
gen-erated
NP
variants
mimicking
constant
acetylation
by
substituting the respective lysine residue with neutrally charged
glutamine (Q), a known acetylation-mimic
28, 29. As shown
in Fig.
4
a, both SC35M-NP-K77Q and SC35M-NP-K113Q
sup-ported polymerase activity to comparable levels as wt NP,
whereas the polymerase activity in the presence of
SC35M-NP-K229Q was reduced to 59%, despite comparable protein
expres-sion (Supplementary Fig.
3
b). Intriguingly, though we observed
wt-like activity of NP-K113Q in the polymerase reconstitution
assay, we could not generate SC35M virus encoding this mutant
protein (Fig.
4
a). However, we were able to rescue both NP-K77Q
(rK77Q) and NP-K229Q (rK229Q) in the context of SC35M.
Compared to wt SC35M and rK77Q, viral growth of rK229Q was
significantly impaired in MDCK II cells infected at an MOI of
0.001 at 12 and 24 h.p.i. (Fig.
4
b) and severe attenuation of
rK229Q was also observed in A549 and Vero cells
(Supplemen-tary Fig.
7
a). MDCK II cells (Fig.
4
c) or A549 cells
(Supple-mentary Fig.
7
b) infected with rK229Q revealed wt-like
subcellular re-localization of NP. Consistently, fractionation of
MDCK II cells infected with either wt SC35M or rK229Q at an
MOI of 5 revealed comparable NP protein and vRNA levels (PB2,
HA and NP) in the nuclear and cytoplasmic fraction (Fig.
4
d) at
6 h.p.i. By restricting viral replication to a single round of
infec-tion, less infectious viral particles were detected for rK229Q
compared to rK77Q and wt infected cells (Fig.
4
e), suggesting that
the NP mutation K229Q might also diminish release of viral
particles as the NP mutation K229R (Fig.
3
). As expected,
reconstitution of VLPs comprising NP-K229Q in the presence of
eight genome segments was reduced compared to wt SC35M NP
(Fig.
4
f and Supplementary Fig.
3
e). Consistent with the failure to
rescue infectious virus (Fig.
4
a), we could not reconstitute VLPs
in the presence of NP-K113Q (Fig.
4
f), however, succeeded as
4 h.p.i. wt rK229R NP DAPI NP Nucleus Cytoplasm Mock wt rK229R Mock wt rK229R kDa
55 55 35 Tubulin H3 wt 4 3 100 80 60 40 20 0
1 vRNA 2 vRNAs 3 vRNAs PB2 HA PB2+NP HA+PB2 NP+HA wt rK229R NP Total Foci (%) 100 80 60 40 20 0
Single pos. Foci (%)
100 80 60 40 20 0
Double pos. Foci (%)
Rel. vRNA levels
2 1 0 4 3 2 1 0 PB2 HA NP PB2 HA NP * rK229R 6 h.p.i. 8 h.p.i.
a
b
c
d
e
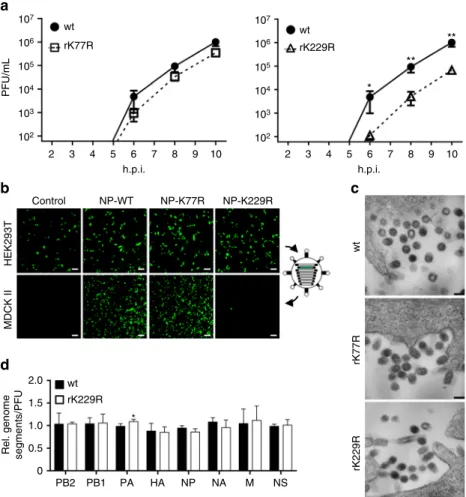
Fig. 2 Growth deficiency of NP mutant virus rK229R. a Subcellular localization of NP in MDCK II cells infected with the indicated viruses at an MOI of 5 after 4, 6 and 8 h.p.i. Scale bar= 4 µm. b Cytoplasmic and nuclear accumulation of viral protein and RNA. MDCK II cells were infected at an MOI of 5 and 6 h.p.i., nuclear and cytoplasmic fractions were obtained. Upper panels show protein levels determined by Western blot analysis.β-Tubulin and histone H3 were used as markers for specific fractionation. Lower panels: relative vRNA transcript levels (PB2, HA, NP) in the nuclear and cytoplasmic fractions determined by quantitative RT–PCR. *p < 0.05. Error bars indicate the mean and s.d. of at least three independent experiments. Student’s t-test was used for two-group comparisons.c–e Fluorescence in situ hybridization to examine co-segregation of vRNAs in wt SC35M and rK229R-infected cells. MDCK II cells were infected at an MOI of 5 for 6 h and vRNAs were subsequently stained with segment-specific and fluorescently labeled probes. c Total cytoplasmic foci, positive for either one (HA, NP or PB2), two (HA and NP; HA and PB2; NP and PB2) or three vRNAs (HA, NP and PB2).d Composition of cytoplasmic foci positive for only one vRNA.e Cytoplasmic foci, positive for two co-segregating vRNAs. Each dot represents the total cytoplasm of a single cell. Depicted are 12–14 infected cells per virus from >4 independent infections. A two-tailed Mann–Whitney test was used for two-group comparisons
expected with NP-K113R (Supplementary Fig.
7
c). As shown for
the NP acetylation-deficient mutant rK229R, morphology of
released viral particles (Fig.
4
g) and their genome content
(Fig.
4
h) was not affected by K229Q substitution.
In summary, based on our mimics acetylation or no acetylation
at either K113 or K229 resulted in different outcomes. Mimicking
either acetylation or no acetylation at K229 impaired particle
release. In contrast, mimicking acetylation at K113 completely
abrogated viral growth at a stage beyond viral replication, whereas
mimicking non-acetylated K113 had no detectable effect on both
polymerase activity and viral growth.
NP hyper-acetylation at K77 and K229 disturbs vRNP
forma-tion. Considering, that various NP lysine residues might
be concurrently acetylated, we generated SC35M NP mutant
proteins harboring either two K to R or K to Q substitutions at
position 77 and 229 and tested these mutants upon polymerase
reconstitution in HEK293T cells. We excluded K113 from this
analysis, since the NP mutation K113Q abrogates viral growth,
impeding potential further analysis in the context of infectious
virus. Polymerase reconstitution with the NP mutant NP-K77R,
K229R mimicking constant non-acetylation resulted in 107%
polymerase activity, compared to wt SC35M NP (Fig.
5
a). In
contrast, mimicking constant acetylation (NP-K77Q,K229Q)
severely diminished polymerase activity to below 5% (Fig.
5
a),
despite comparable NP expression levels to wt SC35M NP
(Supplementary Fig.
3
c). However, similar nuclear accumulation
of wt SC35M NP, NP-K77R,K229R and NP-K77Q,K229Q was
observed after transient expression of these proteins in
HEK293T cells (Fig.
5
b). Consistent with the aforementioned
activity in the polymerase reconstitution assay (Fig.
5
a),
immu-noprecipitation of wt SC35M NP or K77R,K229R using
NP-specific antibodies resulted in the co-immunoprecipitation of
PB2, whereas only residual PB2 levels were observed after
immunoprecipitation of NP-K77Q,K229Q (Fig.
5
c). Interestingly,
in a parallel polymerase reconstitution experiment in which the
viral minigenome was excluded (no functional vRNP formation)
lower levels of PB2 were co-immunoprecipitated with wt SC35M
NP, NP-K77R,K229R and NP-K77Q,K229Q (Fig.
5
d, upper
panel). However, enhanced exposure time revealed that overall
comparable PB2 levels were co-immunoprecipitated (Fig.
5
d,
107 wt rK77R wt rK229R 106 105 104 103 102 107 106 105 104 103 102 2 3 4 5 6 7 8 9 10 h.p.i. Control HEK293T MDCK II 2.0 1.5 1.0 0.5 PB2 PB1 PA HA NP NA M NS 0 wt rK229R *
Rel. genome segments/PFU
NP-WT NP-K77R NP-K229R 2 3 4 5 6 7 8 9 10 h.p.i. wt rK77R rK229R PFU/mL
a
b
c
d
* ** **Fig. 3 Mimicking non-acetylated K229 of SC35M NP negatively affects particle release but not genome packaging. a To determine viral particle release under single cycle growth conditions, infection of MDCK II cells (MOI 10) was synchronized on ice and viral titers were subsequently determined via plaque assay at the indicated time points. Error bars indicate the mean and standard error of the mean (s.e.m) of at least four independent experiments. Student’s t-test was used for two-group comparisons. *p < 0.05; **p < 0.01. b To investigate genome incorporation mediated by wt or mutant SC35M NP proteins, VLPs were generated in HEK293T cells in the presence of a GFP-encoding reporter minigenomeflanked by PB1 packaging sequences together with the remaining 7 genome segments. Cell supernatant containing released VLPs was used to infect MDCK II cells, which were subsequently superinfected with wt SC35M. Scale bar= 100 µm. c To analyze viral particle morphology, MDCK II cells were infected (MOI 10), fixed 10 h.p.i. and subjected to electron microscopy. Representative pictures of individual particles are shown. Scale bar= 100 nm. d Packaging of genome segments incorporated into viral particles released from MDCK II cells infected with the indicated viruses. Equal amounts of infectious viral particles determined by PFU were analyzed by quantitative RT–PCR. Levels of viral genome transcripts of wt SC35M were set to 1. Error bars indicate the mean and s.d. of at least three independent experiments. *p < 0.05. Student’s t-test was used for two-group comparisons
Strain NP Pol.Act. (%) Rescue 107 wt rK77Q wt rK229Q 106 105 PFU/mL PFU/mL PFU/mL 104 103 102 2 3 4 5 6 7 8 9 ** ** * 10 107 106 105 104 103 102 107 108 109 106 105 104 103 102 101 100 12 24 36 48 wt wt 4 h.p.i. 6 h.p.i. 8 h.p.i. NP DAPI Nucleus Mock NP Tubulin H3 wt rK229Q 4 3
Rel. vRNA levels
2 1 PB2 HA NP PB2 HA * * NP 2.5 wt rK229Q
Rel. genome segments/PFU
2.0 1.5 1.0 0.5 PB2 PB1 PA HA NP NA M NS 0 0 4 3 2 1 0 wt rK229Q Mock wt rK229Q kDa wt rK229Q 55 55 35 Cytoplasm ** *** MDCK II rK77Q rK229Q rK229Q 2 Control HEK293T MDCK II NP-WT NP-K113Q NP-K229Q 3 4 5 6 h.p.i. 7 8 9 10 109.84 ± 11.90 113.65 ± 19.09 59.10 ± 7.10 + + – SC35M (H7N7) K77Q K113Q K229Q
a
b
c
d
e
f
g
h
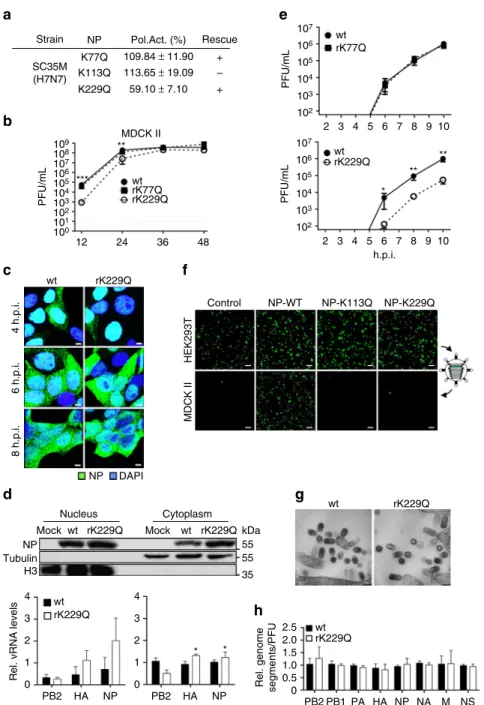
Fig. 4 Impact on viral replication and growth mimicking constant NP acetylation. a Polymerase reconstitution assay in HEK293T cells in the presence of the indicated NP mutants. Polymerase activity is shown as mean and s.d. of at least three independent experiments. Plus indicates successful rescue of recombinant viruses.b MDCK II cells were infected at an MOI of 0.001 and viral growth was monitored at the indicated time points by plaque assay. Dashed lines represent the detection limit. **p < 0.01; ***p < 0.001. Error bars indicate the mean and s.e.m. of at least three independent experiments. c Subcellular localization of NP in MDCK II cells infected with the indicated viruses at an MOI of 5 after 4, 6 and 8 h.p.i. Scale bars= 4 µm. d NP protein (upper panels) and vRNA transcript (PB2, HA, NP) levels (lower panels) were determined in nuclear and cytoplasmic fractions 6 h.p.i. of MDCK II cells infected at an MOI of 5 by Western blot analysis and quantitative RT–PCR, respectively. β-Tubulin and histone H3 were used as marker for specific fractionation. Error bars indicate the mean and s.d. of at least three independent experiments. *p < 0.05. e Infection of MDCK II cells (MOI 10) was synchronized on ice and viral titers were subsequently determined via plaque assay. Error bars indicate the mean and standard error of the mean (s.e.m) of at least four independent experiments. Student’s t-test was used for two-group comparisons. *p < 0.05; **p < 0.01. f VLPs were generated in
HEK293T cells in the presence of a GFP-encoding reporter segment with the remaining seven genome segments. VLPs released into the cell supernatant were used to infect MDCK II cells, which were subsequently superinfected with SC35M. Scale bar= 100 µm. g MDCK II cells were infected (MOI 10), fixed 10 h.p.i. and subjected to electron microscopy. Representative pictures are shown. Scale bar= 100 nm. h Relative amount of genome segments incorporated into viral particles. Equal amounts of infectious viral particles determined by PFU were analyzed by quantitative RT–PCR. Level of wt SC35M genome transcripts were set to 1. Error bars indicate the mean and s.d. of at least three independent experiments. Student’s t-test was used for two-group comparisons
second upper panel). Hence, decreased polymerase activity in
presence of NP-K77Q,K229Q is not due to impaired PB2 binding
but a step in the viral replication. Considering that K77 and K229
are localized in the proximity of the NP RNA binding groove
20,21we speculated that acetylation might alter its ability to
encapsi-date genomic RNA intermediates such as cRNA. To show this, we
infected HEK293T cells with SC35M wt virus at an MOI of 5 for
6 h in the presence of cycloheximide to prevent mRNA
transla-tion, only allowing primary transcription of mRNA and cRNA
from the incoming vRNA. Since cRNA is rapidly degraded,
visualization of this primary transcript requires its stabilization by
overexpression of the polymerase subunits and NP prior infection
K229 Strain WT NP DAPI Pol. + NP mRNA cRNA vRNA 1 2 3 4 5 6 7 5sRNA SC35M (H7N7) NP K77R K77Q K229Q K77Q kDa 100 100 55 55 40 K229Q K77Q K229Q K229R K77R WT WT WT -CHX Mock WT +CHX – SC35M NP PB2 IP:NP Cell lysate NP PB2 NP Actin – K229R K77Q K229Q K77R K229R WT K77Q kDa 100 100* 100 55 55 40 K229Q K77R WT WT SC35M NP PB2 PB2 IP:NP Cell lysate NP PB2 NP Actin Rec. Virus NP K77R K77Q K229Q MDCK II wt rK77R,K229R rK77Q,K229Q * PFU/mL 109 108 107 106 105 104 103 102 101 100 12 24 36 48 h.p.i. K229R Stock Titer rK77R,K229R N76R77Y78 G228R229F230 N76Q77Y78 G228Q229F230 N76 R77Y78 G228R229F230 N76Q77Y78 G228 F230 rK77Q,K229Q rK77R,K229R rK77Q,K229Q 7.2*107 2.6*104* SC35M (H7N7) – K229R K77R K229R 107.24 ± 33.41 4.09 ± 2.53 Pol. Act. (%)
a
b
c
d
e
f
g
h
i
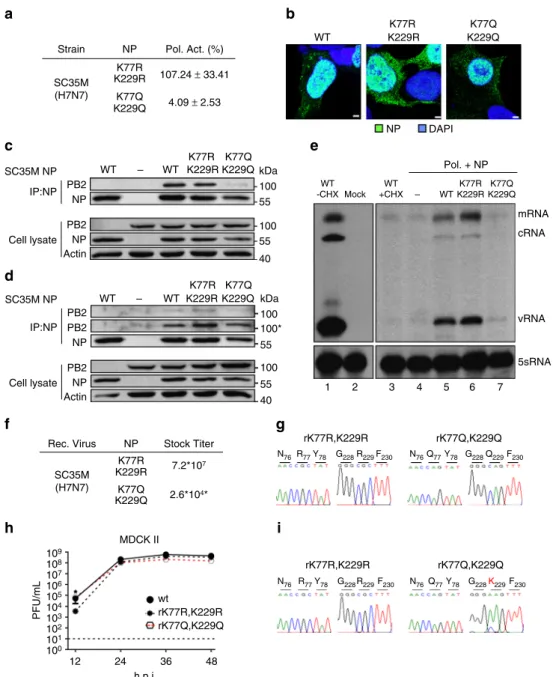
Fig. 5 Mimicking concurrent acetylation at K77 and K229 of SC35M NP is not tolerated by the virus. a Polymerase reconstitution assay in HEK293T cells in the presence of the indicated NP mutants. Polymerase activity is shown as mean and s.d. of at least three independent experiments.b Nuclear localization of the respective NP mutants after transient expression in HEK293T cells. Scale bar= 2 µm. c, d Binding of PB2 to SC35M NP mutants in presence c or absenced of vRNA. After reconstitution of the polymerase complex in HEK293T cells for 24 h, cells were lysed and NP was immunoprecipitated (IP) using an NP-specific monoclonal antibody. Protein levels after IP and in the cell extract were determined by Western blot. Actin serves as loading control. (Asterisks) panel with increased exposure to visualize residual PB2 binding.e Following transfection of HEK293T cells with control plasmid (empty vector) the polymerase complex and NP (either wt or indicated mutants), cells were infected at an MOI of 5 in presence of cycloheximide (CXH). 6 h.p.i. RNA was isolated and viral PB2 transcripts were determined by primer extension analysis. Cellular 5sRNA serves as loading control. Right upper panel represents an enhanced exposure to visualize the viral transcript levels in the presence of CXH.f Stock titers of SC35M virus mutants observed after rescue and one round of plaque purification. Viral titers (PFU/mL) were determined by plaque assay at 48 h.p.i. (Asterisks) Titers for rK77Q,K229Q were determined at 72 h.p.i.g To confirm the respective mutations in both stock viruses, viral RNA was isolated and reverse transcribed using segment-specific primers. h MDCK II cells were infected with the indicated viruses at an MOI of 0.001 and viral growth was monitored 12, 24, 36 and 48 h.p.i. by plaque assay. Dashed lines represent the detection limit. *p < 0.05. Error bars indicate the mean and s.e.m. of at least three independent experiments. Student’s t-test was used for two-group comparisons.i To determine the NP sequences, viral RNA was isolated from viral particles 48 h.p.i. and reverse transcribed using segment-specific primers
and cycloheximide treatment
3,5. As shown in Fig.
5
e,
cyclohex-imide treatment resulted in detectable but low levels of incoming
vRNA and the accumulation of primary mRNA transcripts
(Fig.
5
e, lane 3), whereas in the absence of cycloheximide all viral
RNA species, including cRNA, were detected (Fig.
5
e, lane 1). As
described previously
3,5, prior overexpression of the polymerase
complex and NP wt resulted in traceable levels of cRNA and
consequentially enhanced v- and mRNA levels (Fig.
5
e, lane 5).
Enhanced levels of viral transcripts were also obtained with
NP-K77R,K229R (Fig.
5
e, lane 6). In contrast, in the presence of
NP-K77Q,K229Q fewer cRNA and vRNA levels were observed
(Fig.
5
e, lane 7). Together these results suggest that NP-K77Q,
K229Q fails to efficiently stabilize cRNA, thereby abrogating the
viral replication process.
Next we tried to rescue SC35M mutant viruses encoding either
NP-K77R,K229R (rK77R,K229R) or NP-K77Q,K229Q (rK77Q,
K229Q). Astonishingly, both mutant viruses could be generated
by reverse genetics, although rK77Q,K229Q revealed a virus stock
titer that was 2770 fold lower than r77R,K229R (Fig.
5
f). Sanger
sequencing of both stock viruses confirmed that the respective
mutations were indeed present within NP (Fig.
5
g). To
characterize viral growth, we infected MDCK II cells at an MOI
of 0.001, determining viral titers at 12, 24, 36 and 48 h.p.i. In line
with the results obtained for mutant virus rK229R, the double
mutant rK77R,K229R showed impaired viral growth in MDCK II
cells at early time points of infection (Fig.
5
h). Strikingly, no
attenuation was observed with rK77Q,K229Q (Fig.
5
h).
Sequen-cing of both mutants at 48 h.p.i. revealed that the two arginine
substitutions of rK77R,K229R were maintained, whereas in cells
infected with rK77Q,K229Q, an escape mutation emerged,
restoring a wt-like lysine residue at position 229 (Fig.
5
i).
Taken together, in contrast to mimicking NP hypo-acetylation,
mimicking constant acetylation at amino acid residues 77 and 229
of NP resulted in impaired viral replication possibly due to a
failure to efficiently stabilize replication intermediates such as
cRNA.
Discussion
In virus-infected cells several lysine residues of NP, including
K77, K113 and K229 were identified to be acetylated. Using a
mutational approach in which we mimicked non-acetylated lysine
residues by substitution with arginine (R), the mutation K229R in
NP of SC35M was found to impair viral growth in multiple cell
lines, whereas the replacement of the lysine residues at positions
77 and 113 with arginine had no detectable effect. In comparison
to wt SC35M, the mutant virus encoding NP-K229R showed
similar viral polymerase activity, time-dependent accumulation of
vRNPs in the cytoplasm and co-segregation of distinct
cyto-plasmic vRNPs. However, single cycle growth kinetics suggested
that release of infectious viral particles was severely diminished,
although this deficiency did not induce erroneous particle
gen-ome content. Mimicking a single constitutively acetylated lysine
residue by substituting K229 with glutamine (K229Q) revealed a
comparable defect in particle release, whereas the NP mutation
K77Q displayed no effect. Intriguingly, the NP mutation K113Q
did not allow the generation of viable virus, despite unimpaired
polymerase activity. Furthermore, mimicking constitutive
acet-ylation of both NP lysine residues K77 and K229 severely
diminished viral replication by the inability to initiate
amplifi-cation of vRNA copies, whereas mimicking non-acetylated lysines
at these positions had no effect on viral polymerase activity.
Mutational approaches that aim to mimic acetylated and
non-acetylated lysine residues by arginine or glutamine substitutions
have been successfully used in numerous studies to gain insight
into the functional role of protein acetylation
28–30, 33. This
approach is based on the assumption that the major purpose of
acetylation is to neutralize the positive charge of lysine moieties.
As a consequence, a conversion to glutamine should induce a
different phenotype than an arginine substitution. However, since
the SC35M viruses encoding either K to R (rK229R) or K to Q
(rK229Q) mutations displayed similar phenotypes, it cannot be
ruled out that the observed impaired particle release is
indepen-dent of acetylation and rather caused by structural alterations due
to mutation of K229. Such a phenomenon has been previously
suggested for acetylatable lysine residues
34, 35. Alternatively,
transient acetylation spanning the vRNP could be required
for efficient particle release since each vRNP is composed of
around 35–95 nucleoproteins, of which only a fraction are
pre-sumably acetylated at position K229. Thus, shifting to either
acetylation (Q substitution) or non-acetylation (R substitution)
might cause significant changes in the overall charge of the
vRNPs and thereby compromise important functions in the
budding process of viral particles. At which step viral particle
release is blocked in cells infected with the mutant viruses
mimicking acetylated or non-acetylated lysine residues at position
229 remains to be shown. As described by others, mutations at
WSN NP residues 214, 217 and 253 are capable of changing
virion morphology from spherical to
filamentous particles, due to
altered NP-M1 binding
36. However, particles released from cells
infected with the acetylation mutants show comparable virion
morphology as wt virus particles, suggesting that impaired
NP-M1 binding may not be the cause for the particle release deficit.
Competition between acetylation and ubiquitination at lysine
residues is known to occur
33, complicating mutational
approa-ches. Indeed, recent studies by Lin et al.
37revealed that 10 out of
19 lysine residues are ubiquitinated after transient overexpression
of WSN NP, including K77, K113 and K229. However, although
it remains a possibility, NP has not yet been shown to be
ubi-quitinated at these sites in infected cells. Still, it cannot be
for-mally excluded that a fraction of K77, K113 and K229 is present
with other post-translational modifications than acetylation.
Nevertheless, mutations of K77 to either R or Q or K113 to R had
no apparent effect on viral replication, implying that
ubiquiti-nation at these particular sites can most likely be neglected.
Provided that SC35M K229 is indeed ubiquitinated in
virus-infected cells, loss of ubiquitination at this site due to mutations
may contribute to the observed defect in viral growth and particle
release.
In contrast to the effect observed upon the amino acid
sub-stitutions at K229, mutation of K113 in NP to arginine resulted in
a dramatically different phenotype as that of glutamine. Despite
the mutation K113R having no detectable effect on polymerase
activity or viral growth, rescue of NP-K113Q virus was not
possible. This strongly suggests that acetylation of K113 does in
fact affect a later stage in the viral life cycle past viral replication.
Notably, a reciprocal interplay between lysine acetyltransferases
(KATs) and lysine deacetylases (KDACs) is required to regulate
lysine acetylation of histones
38. Identifying which of the 17 KATs
or 18 KDACs
25coordinate acetylation/deacetylation at the
aforementioned lysine residues is necessary to further elucidate
the regulatory mechanisms of NP acetylation. However, this
could prove to be a comprehensive task due to the functional
redundancies amongst KATs or KDACs and their vast substrate
diversity.
Contrary to the single amino acid mutational approach,
mimicking acetylation and non-acetylation at both NP lysine
residues K77 and K229 revealed strongly opposing effects on viral
replication. Whereas the NP mutations K77Q and K229Q
severely diminished viral replication, K77R and K229R had no
effect in this regard, suggesting that simultaneous acetylation at
these sites specifically interferes with a certain step in the viral life
cycle. The block in viral growth mediated by NP-K77Q,K229Q
appears to be at the stage of viral replication. As shown by the
cRNA stabilization assay, only reduced levels of cRNA are
observed in cells infected with SC35M (in the presence of
cycloheximide) and prior expression of the polymerase complex
and NP-K77Q,K229Q. This indicates that NP-K77Q,K229Q at
least fails to properly encapsidate cRNA transcripts whereas PB2
binding seems not to be affected. Since both K77 and K229 are
found within close proximity of the known vRNA-binding
groove
20, 21, we speculate that mimicking hyper-acetylation at
K77 and K229 might adversely affect its overall binding capacity
to the negatively charged cRNA phosphate backbone, thereby
preventing proper encapsidation. However, it should be noted
that the mass spectrometry data doesn’t allow to conclude that
both lysine residues are simultaneously acetylated on the same
NP molecule in infected cells. Thus, biological importance of
contemporaneous acetylation at K77 and K229 remains to be
shown.
In summary, using a mutational approach we provide evidence
that acetylation of highly conserved lysine residues might regulate
specific functions of NP in the viral life cycle of influenza A
viruses, including viral replication.
Methods
Cell lines. Vero (ATCC; #CCL-81), A549 (ATTC; # CCL-185), MDCK II (Merck; #00062107) and HEK293T cells (ATTC; CRL-3216) were cultured in Dulbecco’s modified Eagle’s medium (DMEM, Gibco, Thermo Scientific) containing 10% fetal calf serum (FCS), 100 U Penicillin and 100 mg Streptomycin per ml at 37 °C and 5% CO2.
Plasmids. The pHW2000-based rescue system to generate recombinant WSN and SC35M viruses and pCAGGs plasmids encoding A/WSN/33 and A/SC35M/1980 proteins have been previously described3,9,14,39. Plasmids encoding NP with mutations (K to R or K to Q) at amino acid position K77, K113 and K229 were generated using site-specific mutagenesis primers. The pHW400_PB1_eGFP reporter minigenome has been generated as previously described9. The GFP
protein coding sequence wasflanked by assembly PCR with the 5′ (nt 1–90) and 3′ (nt 2259–2341) termini of PB1 and cloned into the pHW400 vector allowing polI-driven expression of the reporter minigenome. The pHW400 was generated by removing the polII promoter and terminator from the pHW2000 rescue vector as described9. The human C-terminal HA-tagged CBP (CBP-HA) gene
(NM_004380.2) was cloned into pcDNA3.0 (ThermoFischer).
Virus strains and infections. Recombinant viruses WSN-PB2-Strep, WSN, SC35M and SC35M-PB2-Strep were generated as previously described27. All
recombinant viruses were plaque purified and viral titers were determined by plaque assay on MDCK II cells. NP mutations at the respective positions were confirmed by sequencing. If not indicated otherwise, cells were washed with PBS (0.2% BSA) and infection was performed in infection media (DMEM containing 0.2% BSA, 100 U Penicillin and 100 mg Streptomycin per ml). For single cycle infections, cells were incubated with viruses in infection media on ice. After 45 min, cells were incubated for 7 min at 37 °C, washed with PBS, incubated in PBS (pH= 2) for 30 s, washed with infection media and further incubated at 37 °C in infection media for the indicated time points.
Subcellular fractionation. MDCK II cells were washed in PBS and infected with the respective virus (MOI 5) at room temperature in infection media. After 1 h, inoculum was removed and cells were washed 3 times with PBS (0.2% BSA) and further incubated in infection media at 37 °C and 5% CO2for 6 h. Afterwards, cells were washed and pelleted (600 g, 5 min, 4 °C) in ice-cold PBS. Nuclear and cytoplasmic fractionation was performed with the Nuclear/Cytosol Fractionation Kit (BioVision) according to manufacturer’s protocol. Samples were either subjected to Western blot analysis or total RNA extraction using Direct-zol RNA MiniPrep Kit (Zymo Research).
Western Blot analysis. Proteins from cell lysates were separated by sodium dodecyl sulfate polyacrylamide gel electrophoresis (SDS–PAGE) and subjected to Western blot analysis. NP, actin, tubulin or histone H3 levels were determined using specific antibodies against NP (Gene Tex, GTX125989, 1:1000), actin (Sigma-Adlrich, A3853; 1 : 1000), tubulin (Sigma-Aldrich, T4062; 1 : 1000) and histone H3 (Abcam, AB1791; 1 : 1000), respectively. Monoclonal PB2 (1 : 200) antibody was kindly provided by Dr. Georg Kochs. NP acetylation was determined using a pan-specific lysine acetyl antibody (Immunechem, ICP0380; 1 : 1000). Anti-HA
antibody (Sigma-Aldrich, H6908; 1 : 2000) was used to detect HA-tagged proteins. Primary antibodies were detected using Peroxidase-conjugated secondary anti-bodies (Jackson ImmunoResearch, 1 : 5000). Uncropped scans of the Western blots can be found in Supplementary Fig.8.
Immunofluorescence. MDCK II, A549 or HEK293T cells seeded onto glass plates were either infected with the respective virus (MOI 5) at room temperature for 1 h or transfected (each 250 ng). Viral supernatant was removed and cells were washed three times in PBS (0.2% BSA) and further incubated in infection media at 37 °C and 5% CO2. At the indicated time points, cells werefixed using 4% paraformaldehyde (PFA) in PBS for 15 min, washed three times with PBS and permeabilized with 0.5% Triton X-100 in PBS for 5 min. Viral proteins were stained with antibodies against NP (ATCC: H16-L10-4R5) at a dilution of 1:1500, for 1 h at room temperature. Upon washing, cells were stained using a corre-sponding secondary anti-mouse IgG coupled to AlexaFluor 488 (Jackson Immu-noResearch, 1:500) for 1 h. Finally, cells were washed and nuclei were stained for 5 min using 4′,6-diamidino-2-phenylindole (DAPI) at a dilution of 1 : 10,000 in PBS. Glass slides were mounted and examined on a LEICA TCS SP8 gated STED Super Resolution microscope. Entire cell volumes were captured by acquisition of fine z-stacks, 0.24 µm step size for each cell on a 63x objective (NA = 1.4). Images were analyzed utilizing Huygens Essential (Scientific Volume Imaging) and Imaris 7.7.2 (Bitplane A.G.) software.
Fluorescence in situ hybridization. Fluorescence in situ hybridization was essentially carried out as previously described32. Briefly, MDCK II cells were
seeded onto glass plates and subsequently infected at an MOI of 5 for 1 h at room temperature, washed three times and further cultivated for 6 h (37 °C, 5% CO2). Cells werefixed using 4% PFA and permeabilized overnight (70% EtOH). Segment-specific SC35M DNA probes (Supplementary Table1) targeting HA (CAL Fluor Red 590), PB2 (Quasar 670) and NP (Quasar 570) vRNAs were purchased from BioSearch Technologies. To ensure specificity, each oligo was compared to the entire SC35M genome (plus and minus strands). Any oligos with 10 base pair similarity to a region other than the desired vRNA segment were excluded. NP protein was visualized using a specific NP antibody (ATCC, H16-L10-4R5; dilu-tion 1 : 1500) and a secondary antibody coupled to AlexaFluor 488 (Jackson ImmunoResearch, 1 : 500). Spectral separation was achieved using a LEICA TCS SP8 gated STED Super Resolution microscope. A sequential scanning program was established based on the manufacturer’s excitation and emission spectra for each fluorophore. The following parameters were used: HyD1 (Quasar 670), range 675–737 nm, excitation wavelength 647 nm (WLL, power 3%), PMT1 (DAPI), range 415–470 nm, excitation wavelength 405 nm (UV laser, power 5%), PMT3 (CAL Fluor Red 590), range 595–650 nm, excitation wavelength 582 nm (WLL, power 10%), HyD2 (Quasar 570), range 550–570 nm, excitation wavelength 545 nm (WLL, power 15%) and PMT1 (488), range 500–539 nm, excitation wavelength 488 nm (WLL, power 5%). Spectral separation was confirmed in each experiment with single color controls (infected cells stained with only a single vRNA FISH probe set or NP antibody). Entire cell volumes were captured by acquisition offine z-stacks, 0.13 µm step size for each cell on a 63x objective (NA= 1.4) with a zoom of 4. The resultant images had a pixel size of 50 × 50 × 170 nm, which is close to nyquest sampling. The three-dimensional confocal stacks of FISH were background subtracted and deconvolved using Huygens Professional (version 16.05; Scientific Volume Imaging B.V.). Deconvo-lution was done automatically at 40 iterations per deconvoDeconvo-lution to a signal to noise ratio of 20. The resulting images were analyzed with Imaris software (version 8.3.0; Bitplane A.G.). Imaris was used to generate spots for all three FISH probes using the program’s ‘Spots’ feature, and threshold was defined based on 2× the s.d. of the channel mean intensity. To quantify the spots, wefirst defined the cellular and nuclear spaces for a cell of interest. We used the DAPI channel to define the cell nuclear voxel space with a smoothing of 0.09, and NP protein signal to define the cellular membrane. We then utilized the spots colocalization feature in Imaris MATLAB extensions to identify colocalized spots i.e. spots within 300 nm of each other. The frequency data generated by Imaris was graphed and compared using Prism software (version 6.0, GraphPad).
Mass spectrometry. NP acetylation sites were detected upon transient expression of NP in HEK293T cells or vRNPs isolated from infected A549 cells.
HEK293T cells were transfected with expression plasmids encoding WSN NP-HA (2µg) and CBP (4 µg). 24 h post transfection, cells were washed and lysed using RIPA buffer (pH= 7.5, 50 mM Tris Base, 150 mM NaCl, 1% NP-40, 1 mM EDTA, 0.25% Sodium-deoxycholate and 0.1% SDS) including 1% Protease Inhibitor Cocktail (Roche). Following sonication and centrifugation, HA-specific NP pull-down using anti-HA agarose (Sigma), was performed overnight at 4 °C. Finally, samples were washed 4 times (RIPA) and subjected to SDS–PAGE. Corresponding gel slices of acetylated NP were excised and digested with trypsin for 20 h. The digested peptides were analyzed by mass spectrometry (LCQ Deca XP Plus, Thermo Finnigan). Data analysis was carried out using Mascot2.2 software (Matrix Science, London, UK; version 2.2). A549 cells were infected with either SC35M or WSN encoding Strep-tagged PB2 at an MOI of 20 and incubated for 20 h at 37 °C and 5% CO2. Cells were subsequently washed, using ice-cold PBS and pelleted by
centrifugation (1500 r.p.m., 4 °C, 5 min). Lysis was done on ice for 20 min (50 mM TRIS, pH 7.5, 150 mM NaCl, 2 mM MgCl2, 2 mM CaCl2, 0.7% NP-40, 1 mM DTT, 1% Protease Inhibitor Mix G (Serva) and 50 U per ml DNase I (Thermo Fisher Scientific). Following centrifugation (13,200 r.p.m., 4 °C, 15 min) supernatant was transferred onto Streptavidin Beads (Pierce). Co-immunoprecipitation was per-formed overnight at 4 °C and precipitates were washed three times in 50 mM TRIS, pH 7.5 containing 150 mM NaCl, 2 mM MgCl2, 2 mM CaCl2, 0.7% NP-40, 1 mM DTT, 1% Protease Inhibitor Mix G and resuspended in SDS–PAGE sample buffer. Samples were heated in SDS–PAGE loading buffer, reduced with 1 mM DTT for 5 min at 95 °C and alkylated using 5.5 mM iodoacetamide for 30 min at room temperature. Protein mixtures were separated on 4–12% gradient gels. The band corresponding to NP was cut, the proteins were in‐gel digested with either trypsin or elastase and the resulting peptide mixtures were processed on STAGE tips and analyzed by LC-MS/MS40. Mass spectrometric (MS) measurements were
performed on an LTQ Orbitrap XL mass spectrometer coupled to an Agilent 1200 nanoflow–HPLC. HPLC–column tips (fused silica) with 75 µm inner diameter were self-packed with Reprosil–Pur 120 ODS–3 to a length of 20 cm. Samples were applied directly onto the column without a pre–column. A gradient of A (0.5% acetic acid in water) and B (0.5% acetic acid in 80% acetonitrile in water) with increasing organic proportion was used for peptide separation (loading of sample with 2% B; separation ramp: from 10–30% B within 80 min). The flow rate was 250 nL per min and for sample application 500 nL per min. The mass spectrometer was operated in the data-dependent mode and switched auto-matically between MS (max. of 1 × 10⁶ions) and MS/MS. Each MS scan was followed by a maximum offive MS/MS scans in the linear ion trap using normalized collision energy of 35% and a target value of 5000. Parent ions with a charge state from z= 1 and unassigned charge states were excluded for fragmentation. The mass range for MS was m/z= 370–2000. The resolution was set to 60,000. MS parameters were as follows: spray voltage 2.3 kV; no sheath and auxiliary gasflow; ion-transfer tube temperature 125 °C.
The MS raw datafiles were uploaded into the MaxQuant software version 1.4.1.2 for peak detection, generation of peak lists of mass error corrected peptides, and for database searches41. Full-length UniProt human or dog databases
additionally containing all influenza proteins and common contaminants such as keratins and enzymes used for in–gel digestion were used as reference. Carbamidomethylcysteine was set asfixed modification and protein
amino–terminal acetylation, oxidation of methionine and lysine acetylation were set as variable modifications. Three missed cleavages were allowed, enzyme specificity was trypsin/P, and the MS/MS tolerance was set to 0.5 Da. The average mass precision of identified peptides was in general less than 1 ppm after recalibration. Peptide lists were further used by MaxQuant to identify and relatively quantify proteins using the following parameters: peptide and protein false discovery rates, based on a forward-reverse database, were set to 0.01, minimum peptide length was set to 6, minimum number of peptides for identification and quantitation of proteins was set to one which must be unique, minimum ratio count was set to two, and identified proteins were requantified. The ‘match-between-run’ option (2 min) was used.
Polymerase reconstitution assay. Polymerase reconstitution was performed as previously described42. Briefly, pCAGGs plasmids encoding PB2, PB1, PA (each 45 ng) and NP (150 ng) were co-transfected with thefirefly luciferase-encoding viral minigenome construct pPolI-FFLuc-RT (25 ng) and a plasmid (pRL-SV40, 20 ng) coding for Renilla luciferase in HEK293T cells. 20 h post transfection, cells were lysed andfirefly and Renilla luciferase activities were measured using the Dual-Luciferase® Reporter assay system (Promega). For co-immunoprecipitation, pCAGGs plasmids encoding PB2, PB1, PA (each 600 ng) and NP (1500 ng) were co-transfected with thefirefly luciferase-encoding viral minigenome construct pPolI-FFLuc-RT (200 ng) in HEK293T cells. 24 h post transfection, cells were washed, using ice-cold PBS and pelleted by centrifugation (1500 r.p.m., 4 °C, 5 min). Lysis was done on ice for 20 min (50 mM TRIS, pH 7.5, 150 mM NaCl, 2 mM MgCl2, 2 mM CaCl2, 0.7% NP-40, 1 mM DTT, 1% Protease Inhibitor Mix G (Serva) and 50 U per ml DNase I (Thermo Fisher Scientific)). Following centrifugation (13.200 r.p.m., 4 °C, 15 min) supernatant was transferred onto 1µl NP-specific antibodies (ATCC: H16-L10-4R5) and binding was performed overnight at 4 °C. Protein A Sepharose (GE Healthcare) was subsequently used to immunoprecipitate NP (1 h, 4 °C). Afterwards, samples were washed 3 times in 50 mM TRIS, pH 7.5 containing 150 mM NaCl, 2 mM MgCl2, 2 mM CaCl2, 0.7% NP-40, 1 mM DTT, 1% Protease Inhibitor Mix G and resuspended in SDS–PAGE sample buffer.
Primer extension analysis. To determine viral transcript levels HEK293T cells were transfected with pCAGGs plasmids encoding PB2, PB1, PA (each 250 ng) and NP (1000 ng). 20 h post transfection, media was exchanged and cells were further incubated with infection media containing cycloheximide (100µg per mL) for 1 h at 37 °C and 5% CO2.Infection was subsequently carried out at an MOI of 5 for 6 h in infection media (cycloheximide: 100µg per mL). Afterwards, cells were collected in Trizol and RNA was purified according to the manufacturer’s protocol (Zymo Research). Primer extension analysis was performed using specific primers for the PB2 segment (mRNA, cRNA and vRNA) and cellular ribosomal RNA (5sRNA) as previously described9. Uncropped scans can be found in Supplementary Fig.8.
Transmission electron microscopy. Transmission electron studies were essen-tially carried out as described before43. MDCK II cells were cultivated at 37 °C and 5% CO2. To synchronize infection, cells were infected on ice at an MOI of 10 for 1 h. Subsequent temperature shift to 37 °C (10 min) ensured virus internalization and remaining viral particles were removed by three times washing with PBS. Afterwards, cells were cultured in infection media at 37 °C and 5% CO2. At 10 h post infection, cells werefixed (0.1 M PHEM, 4% PFA, 0.1% Glutaraldehyde) for 1 h at room temperature. Fixative solution was removed via centrifugation and replaced by 500µl PHEM (0.1 M) containing 4% PFA. Cells were post-fixed with 1 % osmium tetroxide, dehydrated and embedded in epoxy resins. Ultrathin sec-tions were analyzed using a JEM1400 transmission electron microscope (TEM). Virus-like particle assay. Virus-like particles harboring eight segment were generated by transfecting HEK293T cells with pHW2000 plasmids encoding SC35M HA, NA, PA, PB2, M and NS together with the respective pHW2000_NP, pHW400_PB1_eGFP and expression plasmid pCAGGs SC35M PB1 (each 500 ng). As negative control, M1 protein was omitted. Supernatant was collected 48 h post transfection and transferred onto MDCK II cells together with SC35M (MOI 5). GFP expression was measured 12–16 h post transfection on HEK293T cells and infection of MDCK II cells using an Axio Observer.Z1 (Zeiss) microscope. Quantitative RT–PCR analysis of incorporated vRNAs. MDCK II cells were infected at an MOI of 0.001 and supernatant was collected between 16–24 h post infection. Viral particles were pelleted by ultracentrifugation (40% sucrose, 90,000 g for 1.5 h at 4 °C) and resuspended in PBS. Total RNA was extracted from the viral preparations containing the same amount of infectious particles (PFU). Using segment-specific primers (Supplementary Table2), the relative number of vRNA using SYBR green real time PCR was quantified as previously described9. Relative
virion vRNA levels were determined as described9and compared between mutant and wt virus. Results are presented from at least three independent virus stocks. Genome levels obtained with nuclear or cytoplasmic fractions were normalized to GAPDH RNA levels detected using forward primer GF (5′-GGAGCGA-GATCCCTCCAAAAT-3′) and reverse primer GR (5′-GGCTGTTGTCA-TACTTCTCATGG-3′).
Statistics. If not indicated otherwise, Student’s t-test was used for two-group comparisons. The *p-value< 0.05, **p-value < 0.01, and ***p-value < 0.001 were considered significant. Unless otherwise noted, error bars indicate the mean and s.d. of at least three independent experiments.
Data availability. The authors declare that all data supporting thefindings of this study are available within the article and its Supplementary Informationfiles, or are available from the authors upon request.
Received: 3 March 2017 Accepted: 17 August 2017
References
1. Eisfeld, A. J., Neumann, G. & Kawaoka, Y. At the centre: influenza a virus ribonucleoproteins. Nat. Rev. Microbiol. 13, 28–41 (2015).
2. Dubois, J., Terrier, O. & Rosa-Calatrava, M. Influenza viruses and mRNA splicing: doing more with less. MBio 5, e00070–00014 (2014).
3. Mänz, B., Brunotte, L., Reuther, P. & Schwemmle, M. Adaptive mutations in NEP compensate for defective H5N1 RNA replication in cultured human cells. Nat. Commun. 3, 802 (2012).
4. Rossman, J. S., Jing, X., Leser, G. P. & Lamb, R. A. Influenza virus M2 protein mediates ESCRT-independent membrane scission. Cell 142, 902–913 (2010). 5. Vreede, F. T., Ng, A. K., Shaw, P. C. & Fodor, E. Stabilization of influenza virus
replication intermediates is dependent on the RNA-binding but not the homo-oligomerization activity of the viral nucleoprotein. J. Virol. 85, 12073–12078 (2011).
6. Akarsu, H. et al. Crystal structure of the M1 protein-binding domain of the influenza A virus nuclear export protein (NEP/NS2). EMBO J. 22, 4646–4655 (2003).
7. O’Neill, R. E., Talon, J. & Palese, P. The influenza virus NEP (NS2 protein) mediates the nuclear export of viral ribonucleoproteins. EMBO J. 17, 288–296 (1998).
8. Martin, K. & Helenius, A. Nuclear transport of influenza virus
ribonucleoproteins: the viral matrix protein (M1) promotes export and inhibits import. Cell 67, 117–130 (1991).
9. Moreira, É. A. et al. A conserved influenza a virus nucleoprotein code controls specific viral genome packaging. Nat. Commun. 7, 12861 (2016).
10. Wang, L. et al. Comparative influenza protein interactomes identify the role of plakophilin 2 in virus restriction. Nat. Commun. 8, 13876 (2017).
11. Watanabe, T. et al. Influenza virus-host interactome screen as a platform for antiviral drug development. Cell Host Microbe 16, 795–805 (2014). 12. Mondal, A., Potts, G. K., Dawson, A. R., Coon, J. J. & Mehle, A.
Phosphorylation at the homotypic interface regulates nucleoprotein oligomerization and assembly of the influenza virus replication machinery. PLoS Pathog. 11, e1004826 (2015).
13. Turrell, L., Hutchinson, E. C., Vreede, F. T. & Fodor, E. Regulation of influenza a virus nucleoprotein oligomerization by phosphorylation. J. Virol. 89, 1452–1455 (2015).
14. Han, Q. et al. Sumoylation of influenza a virus nucleoprotein is essential for intracellular trafficking and virus growth. J. Virol. 88, 9379–9390 (2014). 15. Liao, T. L., Wu, C. Y., Su, W. C., Jeng, K. S. & Lai, M. M. Ubiquitination and
deubiquitination of NP protein regulates influenza A virus RNA replication. EMBO J. 29, 3879–3890 (2010).
16. Coloma, R. et al. The structure of a biologically active influenza virus ribonucleoprotein complex. PLoS Pathog. 5, e1000491 (2009).
17. Arranz, R. et al. The structure of native influenza virion ribonucleoproteins. Science 338, 1634–1637 (2012).
18. Luger, K., Mader, A. W., Richmond, R. K., Sargent, D. F. & Richmond, T. J. Crystal structure of the nucleosome core particle at 2.8 A resolution. Nature 389, 251–260 (1997).
19. Kornberg, R. D. & Lorch, Y. Twenty-five years of the nucleosome, fundamental particle of the eukaryote chromosome. Cell 98, 285–294 (1999).
20. Ye, Q., Krug, R. M. & Tao, Y. J. The mechanism by which influenza a virus nucleoprotein forms oligomers and binds RNA. Nature 444, 1078–1082 (2006).
21. Liu, C.-L. et al. Using mutagenesis to explore conserved residues in the RNA-binding groove of influenza A virus nucleoprotein for antiviral drug development. Sci. Rep. 6, 21662 (2016).
22. Lee, B. M. & Mahadevan, L. C. Stability of histone modifications across mammalian genomes: implications for‘epigenetic’ marking. J. Cell Biochem. 108, 22–34 (2009).
23. Nowak, S. J. & Corces, V. G. Phosphorylation of histone H3: a balancing act between chromosome condensation and transcriptional activation. Trends Genet. 20, 214–220 (2004).
24. Bjorklund, S., Almouzni, G., Davidson, I., Nightingale, K. P. & Weiss, K. Global transcription regulators of eukaryotes. Cell 96, 759–767 (1999).
25. Drazic, A., Myklebust, L. M., Ree, R. & Arnesen, T. The world of protein acetylation. Biochim. Biophys. Acta 1864, 1372–1401 (2016).
26. Marazzi, I. et al. Suppression of the antiviral response by an influenza histone mimic. Nature. 483, 428–433 (2012).
27. Chase, G. P. et al. Influenza virus ribonucleoprotein complexes gain preferential access to cellular export machinery through chromatin targeting. PLoS Pathog. 7, e1002187 (2011).
28. Choudhary, C. et al. Lysine acetylation targets protein complexes and co-regulates major cellular functions. Science 325, 834–840 (2009). 29. Matsuzaki, H. et al. Acetylation of Foxo1 alters its DNA-binding ability and
sensitivity to phosphorylation. Proc. Natl Acad. Sci. USA 102, 11278–11283 (2005).
30. Ma, L. et al. Acetylation modulates prolactin receptor dimerization. Proc. Natl Acad. Sci. USA 107, 19314–19319 (2010).
31. Chou, Y. Y. et al. Colocalization of different influenza viral RNA segments in the cytoplasm before viral budding as shown by single-molecule sensitivity FISH analysis. PLoS Pathog. 9, e1003358 (2013).
32. Lakdawala, S. S. et al. Influenza a virus assembly intermediates fuse in the cytoplasm. PLoS Pathog. 10, e1003971 (2014).
33. Li, M., Luo, J., Brooks, C. L. & Gu, W. Acetylation of p53 inhibits its ubiquitination by Mdm2. J. Biol. Chem. 277, 50607–50611 (2002).
34. Zhang, W., Bone, J. R., Edmondson, D. G., Turner, B. M. & Roth, S. Y. Essential and redundant functions of histone acetylation revealed by mutation of target lysines and loss of the Gcn5p acetyltransferase. EMBO J. 17, 3155–3167 (1998). 35. Mann, R. K. & Grunstein, M. Histone H3 N-terminal mutations allow
hyperactivation of the yeast GAL1 gene in vivo. EMBO J. 11, 3297–3306 (1992). 36. Bialas, K. M., Bussey, K. A., Stone, R. L. & Takimoto, T. Specific nucleoprotein
residues affect influenza virus morphology. J. Virol. 88, 2227–2234 (2014). 37. Lin, Y. C., Jeng, K. S. & Lai, M. M. C. CNOT4-mediated ubiquitination of influenza a virus nucleoprotein promotes viral RNA replication. MBio 8, e00597-17 (2017).
38. Johnsson, A. et al. HAT-HDAC interplay modulates global histone H3K14 acetylation in gene-coding regions during stress. EMBO Rep. 10, 1009–1014 (2009). 39. Manz, B. et al. Pandemic influenza A viruses escape from restriction by human
MxA through adaptive mutations in the nucleoprotein. PLoS Pathog. 9, e1003279 (2013).
40. Sprenger, A. et al. Consistency of the proteome in primary human keratinocytes with respect to gender, age, and skin localization. Mol. Cell. Proteomics 12, 2509–2521 (2013).
41. Cox, J. & Mann, M. MaxQuant enables high peptide identification rates, individualized p.p.b.-range mass accuracies and proteome-wide protein quantification. Nat. Biotechnol. 26, 1367–1372 (2008).
42. Reuther, P. et al. Adaptive mutations in the nuclear export protein of human-derived H5N1 strains facilitate a polymerase activity-enhancing conformation. J. Virol. 88, 263–271 (2014).
43. Moreira, E. A. et al. Synthetically derived bat influenza A-like viruses reveal a cell type- but not species-specific tropism. Proc. Natl Acad. Sci. USA 113, 12797–12802 (2016).
Acknowledgements
We are grateful to Peter Reuther for helpful comments and discussion. We thank the staff of the Life Imaging Center (LIC) in the Center for Biological Systems Analysis (ZBSA) of the Albert-Ludwigs-University Freiburg for help with their confocal microscopy resources, and the excellent support in image recording and analysis. This study was supported by grants from the National Natural Science Foundation of China (31570171), “Rising Star Talent Program” from the Science and Technology Commission of Shanghai Municipality (15QA1404000) and the Youth Innovation Promotion Association CAS to K.X., the National Key Basic Research Program of China (2013CB910900) to Y.E.C., Deutsche Forschungsgemeinschaft to M.S. (SCH632/15–1), the Excellence Initiative of the German Research Foundation (GSC-4, Spemann Graduate School) to H.B. and the“Stipendienprogramm mit Shanghai und Jiangsu” from the Ministerium für Wissenschaft, Forschung und Kunst Baden-Württemberg to S.G. The funders had no role in study design, data collection and interpretation, or the decision to submit the work for publication.
Author contributions
M.S., S.G. and K.X. conceived the study, M.S., K.X., Y.E.C., S.G., K.C., H.B., E.A.M., S.L., J.D. and L.K. designed experiments, S.G., K.C., H.B., E.A.M., S.L., Q. D., L.K., V.G., Y.Z., Z.H. and K.X., performed the experiments, M.S., S.G., K.C., S.L., K.X., J.D., L.K. and Y.E.C. evaluated the data. M.S., S.G. and K.C. wrote the manuscript.
Additional information
Supplementary Informationaccompanies this paper at doi:10.1038/s41467-017-01112-3. Competing interests:The authors declare no competingfinancial interests.
Reprints and permissioninformation is available online athttp://npg.nature.com/ reprintsandpermissions/
Publisher's note:Springer Nature remains neutral with regard to jurisdictional claims in published maps and institutional affiliations.
Open Access This article is licensed under a Creative Commons Attribution 4.0 International License, which permits use, sharing, adaptation, distribution and reproduction in any medium or format, as long as you give appropriate credit to the original author(s) and the source, provide a link to the Creative Commons license, and indicate if changes were made. The images or other third party material in this article are included in the article’s Creative Commons license, unless indicated otherwise in a credit line to the material. If material is not included in the article’s Creative Commons license and your intended use is not permitted by statutory regulation or exceeds the permitted use, you will need to obtain permission directly from the copyright holder. To view a copy of this license, visithttp://creativecommons.org/ licenses/by/4.0/.