HAL Id: hal-01257801
https://hal.sorbonne-universite.fr/hal-01257801
Submitted on 18 Jan 2016
HAL is a multi-disciplinary open access
archive for the deposit and dissemination of
sci-entific research documents, whether they are
pub-lished or not. The documents may come from
teaching and research institutions in France or
abroad, or from public or private research centers.
L’archive ouverte pluridisciplinaire HAL, est
destinée au dépôt et à la diffusion de documents
scientifiques de niveau recherche, publiés ou non,
émanant des établissements d’enseignement et de
recherche français ou étrangers, des laboratoires
publics ou privés.
Distributed under a Creative Commons Attribution| 4.0 International License
Homozygous RP1L1 Mutation
Sachiko Kikuchi, Shuhei Kameya, Kiyoko Gocho, Said El Shamieh, Keiichiro
Akeo, Yuko Sugawara, Kunihiko Yamaki, Christina Zeitz, Isabelle Audo,
Hiroshi Takahashi
To cite this version:
Sachiko Kikuchi, Shuhei Kameya, Kiyoko Gocho, Said El Shamieh, Keiichiro Akeo, et al.. Research
Article Cone Dystrophy in Patient with Homozygous RP1L1 Mutation. BioMed Research
Interna-tional , Hindawi Publishing Corporation, 2015, pp.545243. �10.1155/2015/545243�. �hal-01257801�
Research Article
Cone Dystrophy in Patient with Homozygous
RP1L1 Mutation
Sachiko Kikuchi,
1Shuhei Kameya,
1Kiyoko Gocho,
1Said El Shamieh,
2,3,4Keiichiro Akeo,
1Yuko Sugawara,
5Kunihiko Yamaki,
1Christina Zeitz,
2,3,4Isabelle Audo,
2,3,4,6and Hiroshi Takahashi
71Department of Ophthalmology, Nippon Medical School, Chiba Hokuso Hospital, Inzai, Chiba 270-1694, Japan
2INSERM, U968, 75012 Paris, France
3Sorbonne Universit´es, UPMC Universit´e Paris 06, UMR S 968, Institut de la Vision, 75012 Paris, France
4CNRS, UMR 7210, 75012 Paris, France
5Honjo Daiichi Hospital, Yurihonjo, Akita 015-0834, Japan
6Centre Hospitalier National d’Ophtalmologie des Quinze-Vingts, DHU ViewMaintain, INSERM-DHOS CIC 1423, 75012 Paris, France
7Department of Ophthalmology, Nippon Medical School, Bunkyo-ku, Tokyo 113-8602, Japan
Correspondence should be addressed to Shuhei Kameya; shuheik@nms.ac.jp Received 29 September 2014; Revised 6 December 2014; Accepted 9 December 2014 Academic Editor: Atsushi Mizota
Copyright © 2015 Sachiko Kikuchi et al. This is an open access article distributed under the Creative Commons Attribution License, which permits unrestricted use, distribution, and reproduction in any medium, provided the original work is properly cited. The purpose of this study was to determine whether an autosomal recessive cone dystrophy was caused by a homozygous
RP1L1 mutation. A family including one subject affected with cone dystrophy and four unaffected members without evidence of
consanguinity underwent detailed ophthalmic evaluations. The ellipsoid and interdigitation zones on the spectral-domain optical coherence tomography images were disorganized in the proband. The proband had a reduced amplitude of cone and flicker full-field electroretinograms (ERGs). Focal macular ERGs and multifocal ERGs were severely reduced in the proband. A homozygous
RP1L1 mutation (c.3628T>C, p.S1210P) was identified in the proband. Family members who were heterozygous for the p.S1210P
mutation had normal visual acuity and normal results of clinical evaluations. To investigate other putative pathogenic variant(s), a next-generation sequencing (NGS) approach was applied to the proband. NGS identified missense changes in the heterozygous state of the PCDH15, RPGRIP1, and GPR98 genes. None of these variants cosegregated with the phenotype and were predicted to be benign reinforcing the putative pathogenicity of the RP1L1 homozygous mutation. The AO images showed a severe reduction of the cone density in the proband. Our findings indicate that a homozygous p.S1210P exchange in the RP1L1 gene can cause cone dystrophy.
1. Introduction
Mutations in the retinitis pigmentosa 1-like 1 (RP1L1) gene cause autosomal dominant occult macular dystrophy (OMD;
OMIM 613587) [1–6]. The RP1L1 gene was originally
iden-tified through sequence analyses of human and mouse
genomes [7,8]. The human RP1L1 gene has 4 exons that span
50 kb on chromosome 8p. The length of the mRNA of RP1L1 is over 7 kb, but its exact length varies among individuals because of several different length polymorphisms. RP1L1 encodes a protein with a maximal length of 2,480 amino acids and a predicted molecular weight of 252 kDa. The expression of RP1L1 protein is limited to the retina, and it appears to
be specific to photoreceptors [7]. RP1L1 was found to be
conserved in distant vertebrates [8]. Knockout mice that lack
the RP1L1 protein have reduced electroretinograms (ERGs)
and progressive photoreceptor degeneration [9]. Studies of
Rp1l1−/− mice showed that the RP1L1 protein is located in
the axoneme of the outer segments and connecting cilia of
the photoreceptors [9].
Occult macular dystrophy (OMD; OMIM 613587) is an inherited macular dystrophy characterized by a progressive decrease in the visual acuity with an essentially normal
fundus and normal fluorescein angiograms [10,11]. The
full-field electroretinograms (ERGs) are normal; however, the focal macular ERGs and multifocal ERGs (mfERGs) recorded
from the macular area are reduced [10–12]. Spectral-domain optical coherence tomography (SD-OCT) showed various degrees of disruption of the ellipsoids and interdigitation
zones in OMD patients [13,14]. The cone and rod sensitivity
profiles of OMD patients indicate depressed cone sensitivity in the macula, although many patients have normal rod
sensitivity in the macula [15]. In many OMD patients, the
waveform of the focal macular ERGs has a depolarizing
pattern [2,15]. The good preservation of rod function in the
macula has been suggested to be related to this ERG finding
[2,15].
The adaptive optics (AO) fundus camera can obtain
images with a transverse resolution of<2 𝜇m, which makes it
possible to resolve individual cone photoreceptors and other
structures in living human eyes [16–18]. This technique has
been used to analyze the cone photoreceptor mosaic in eyes
with inherited retinal degenerations [17,19–21]. An increase
in the cone spacing, that is, a reduction of cone density, in retinas with cone-rod dystrophy can be detected by AO
imaging [17,19, 20]. A dark area in the AO fundus images
was reported to be caused by disruptions of the interdigitation
zone in the SD-OCT images [22,23].
The purpose of this study was to determine whether auto-somal recessive cone dystrophy was caused by homozygous
RP1L1 mutations. To accomplish this, we performed detailed
molecular genetic analysis including next-generation sequen-cing (NGS) on a patient with cone dystrophy and applied the NGS results to her family members. In addition, we performed high-resolution imaging of the retinal morphol-ogy with an adaptive optics (AO) fundus camera.
2. Patients and Methods
The protocol conformed to the tenets of the Declaration of Helsinki, and it was approved by the Institutional Review Board of the Nippon Medical School. A written informed consent was obtained from all patients after an explanation of the nature and possible consequences of the study.
2.1. Clinical Studies. The ophthalmological examinations
included measurements of the best-corrected visual acu-ity (BCVA), refraction, slit-lamp biomicroscopy, ophthal-moscopy, fundus photography, perimetry, SD-OCT, fluores-cein angiography (FA), full-field ERGs, focal macular ERGs, and mfERGs. The visual fields were determined by the Goldman perimetry or the Humphrey Visual Field Analyzer (Model 745i; Carl Zeiss Meditec, Inc, Dublin, California). The Swedish interactive threshold algorithm standard strategy was used with program 30-2 of the Humphrey Visual Field Analyzer. The OCT images were acquired with a Cirrus HD-OCT (Carl Zeiss Meditec).
2.2. Electroretinograms. Full-field scotopic and photopic
ERGs were recorded using the extended testing protocol incorporating the International Society for Clinical Electro-physiology of Vision standards (LE2000, Tomey, Nagoya,
Japan) [24]. Focal macular ERGs were recorded with a
com-mercial Focal Macular ERG system (ER80; Kowa Company,
Tokyo, Japan, and PuREC; Mayo Company, Nagoya, Japan) using a bipolar contact lens electrode (MY type Electrode; Mayo Company, Nagoya, Japan). The stimulus and back-ground lights were integrated into an infrared fundus camera
[25, 26]. The size of the stimulus spot was 15∘ in diameter
and was placed on the macula by observing the infrared image of the retina on a monitor. The white stimulus and background illuminations were generated by light-emitting diodes that had maximal spectral emissions at 440 to 460 nm and 550 to 580 nm, respectively. The luminance of the stimuli
was 115.7 cd/m2 and the background was 8.0 cd/m2. The
duration of the stimuli was 100 milliseconds. The responses were amplified and filtered by digital band pass filters from 5 to 200 Hz. Three hundred responses were summed with a stimulus frequency of 5 Hz.
The mfERGs were recorded using a commercial mfERG system (VERIS Science; Electro-Diagnostic Imaging, Inc.
Redwood City, CA, USA) [27, 28]. The mean luminance
of stimulus was 103 cd/m2 and the contrast was 95%. The
overall stimulus area subtended approximately 40 degrees diameter of visual angle, and the frame rate was 75 Hz. The pseudorandom stimulus presentation, the m-sequence, was
214 − 1, and each run was divided into eight equal segments
with a total recording time of about 4 min.
2.3. Mutation Analyses and Computational Assessments of Missense Mutations. Blood samples were collected from the
proband (II-2) and her family members (II-1, III-2, IV-1, and
IV-2; Figure 1), and genomic DNA was isolated from the
peripheral white blood cells using a blood DNA isolation kit (NucleoSpin Blood XL; Macherey Nagel, Germany). The DNA was used as the template to amplify the RP1L1 gene. The coding regions and flanking introns of the RP1L1 gene were amplified by polymerase chain reaction (PCR) using
pub-lished primers [2] synthesized by Greiner Bio-One (Tokyo,
JAPAN). The PCR products were purified (ExoSAP-IT; USB Corp., USA) and were used as the template for sequencing. Both strands were sequenced on an automated sequencer (Bio Matrix Research; Chiba, JAPAN). The identified muta-tions were assayed in 460 control chromosomes from 230 healthy Japanese individuals by direct sequencing. The effect of a missense mutation of an encoded protein was predicted by PolyPhen-2, SIFT, PMut, and Align GVGD online tools
[29–33].
2.4. Molecular Genetic Analysis Using Next-Generation Sequencing (NGS). Targeted NGS analysis was performed
according to methods described earlier [34] and subsequently
revised and improved. Briefly, a custom-made SureSelect oligonucleotide probe library was designed to assess the exons of 123 genes implicated in different retinal disorders
according to Agilent’s recommendations (Table 1).
2.5. High-Resolution Imaging Analyses. High-resolution
fun-dus images were obtained with an infrared AO retinal camera
with a transverse resolution of 2.4𝜇m (rtx1, Imagine Eyes,
Orsay, France) [35]. This system has been used to image
70 RP1L1 PCDH15 RPGRIP1 GPR98 S1210P/S1210P RP1L1 PCDH15 RPGRIP1 GPR98 NE V1212I/+ RP1L1 PCDH15 RPGRIP1 GPR98 44 13 15 Unaffected Affected (II) (III) (IV) 1 2 1 2 1 2 S1210P/+ S1210P/+ P923L/+ P923L/+ S1210P/+ P923L/+ L2422F/+ P923L/+ V1212I/+ L2422F/+ P923L/+ V1212I/+ +/+ +/+ +/+ +/+ +/+ +/+
Figure 1: Pedigree of a family with cone dystrophy. Affected patient is shown with a solid symbol and unaffected with open symbols. Numbers in the symbols are ages of the family member when they were clinically examined. Sequencing results of the variants of RP1L1, PCDH15,
RPGRIP1, and GPR98 are shown below the symbols. Squares, male; circles, female; slashed symbols, deceased; +, wild type; NE, not examined.
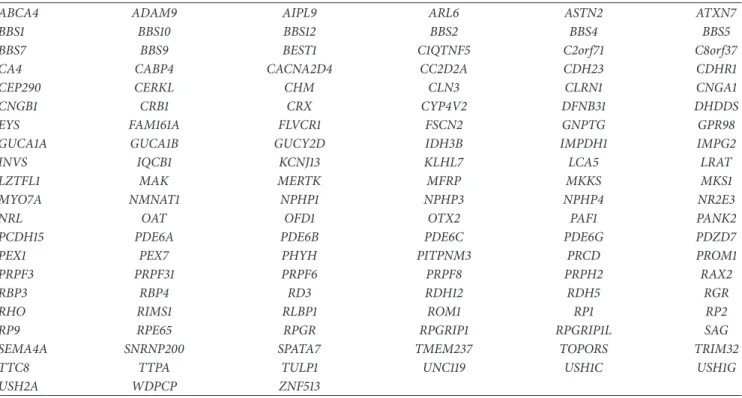
Table 1: Target genes for NGS analysis.
ABCA4 ADAM9 AIPL9 ARL6 ASTN2 ATXN7
BBS1 BBS10 BBS12 BBS2 BBS4 BBS5
BBS7 BBS9 BEST1 C1QTNF5 C2orf71 C8orf37
CA4 CABP4 CACNA2D4 CC2D2A CDH23 CDHR1
CEP290 CERKL CHM CLN3 CLRN1 CNGA1
CNGB1 CRB1 CRX CYP4V2 DFNB31 DHDDS
EYS FAM161A FLVCR1 FSCN2 GNPTG GPR98
GUCA1A GUCA1B GUCY2D IDH3B IMPDH1 IMPG2
INVS IQCB1 KCNJ13 KLHL7 LCA5 LRAT
LZTFL1 MAK MERTK MFRP MKKS MKS1
MYO7A NMNAT1 NPHP1 NPHP3 NPHP4 NR2E3
NRL OAT OFD1 OTX2 PAF1 PANK2
PCDH15 PDE6A PDE6B PDE6C PDE6G PDZD7
PEX1 PEX7 PHYH PITPNM3 PRCD PROM1
PRPF3 PRPF31 PRPF6 PRPF8 PRPH2 RAX2
RBP3 RBP4 RD3 RDH12 RDH5 RGR
RHO RIMS1 RLBP1 ROM1 RP1 RP2
RP9 RPE65 RPGR RPGRIP1 RPGRIP1L SAG
SEMA4A SNRNP200 SPATA7 TMEM237 TOPORS TRIM32
TTC8 TTPA TULP1 UNC119 USH1C USH1G
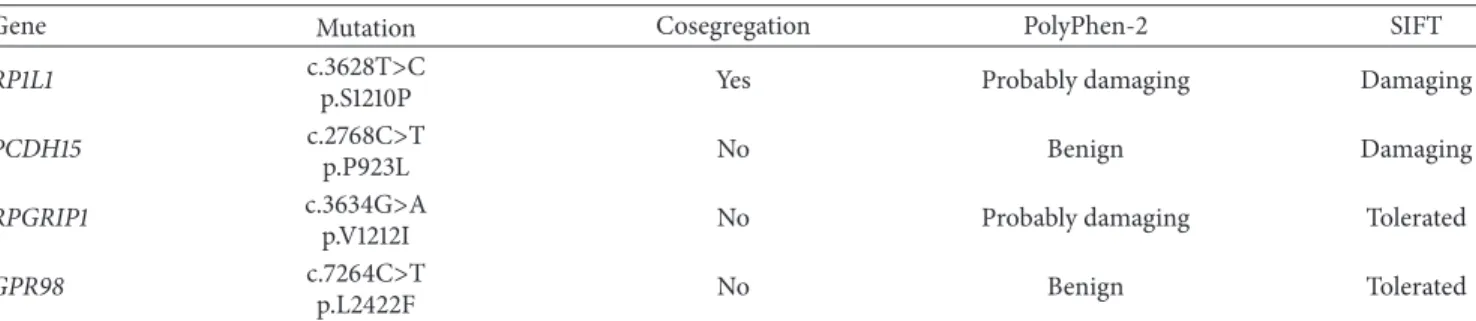
Table 2: Summary of RP1L1 mutation, NGS results, cosegregation, and computational prediction results.
Gene Mutation Cosegregation PolyPhen-2 SIFT
RP1L1 c.3628T>C
p.S1210P Yes Probably damaging Damaging
PCDH15 c.2768C>T
p.P923L No Benign Damaging
RPGRIP1 c.3634G>A
p.V1212I No Probably damaging Tolerated
GPR98 c.7264C>T
p.L2422F No Benign Tolerated
structures [18, 36, 40]. Successive AO images are taken at
adjacent retinal locations with an angular spacing of 2 degrees in the horizontal and vertical directions. This procedure allows an overlap of horizontal and vertical images of at least 2 degrees. We had acquired AO images of the photoreceptor mosaic at the depth of maximum cone image intensity. We had acquired AO images around 6 degrees to both nasal and temporal sides horizontally from the fovea. The resulting images were stitched together by superimposing retinal vessel landmarks with an image editing software (GIMP, The GIMP Development Team; Image J, National Institute of Health, Bethesda, MD). The size of each pixel was
typically 0.8𝜇m when calculated at the retinal plane, and the
values were adjusted for variations in the axial length of the
eye [41]. To evaluate the cone patterns of normal controls
and Case III-2, we used the automated cone labeling analysis software (AOdetect; Imagine Eyes). AOdetect was developed by Imagine Eyes. The positions of the photoreceptors are computed by automatically detecting the central coordinates of small circular spots where the brightness is higher than the surrounding background level. First, the averaged image, without contrast adjustment, was filtered so that the local maxima of the image were detected. The spatial distribution of these points was analyzed using Voronoi diagrams where the detected points served as generators. After automated cone labeling, the estimated cone labeling was manually verified by three investigators to minimize any potential cone under- or oversampling made by the automated software. As has been reported for similar systems, we could clearly
distinguish individual cones at >500 𝜇m from the fovea.
Therefore, we obtained an estimate of cone density in a 100×
100𝜇m area at 600 𝜇m from the foveal center. We examined
the cone density in 26 normal control eyes. There were 19 men and 7 women whose age ranged from 23 to 67 years (mean, 42 ± 12.7 years) in this control group. We calculated the 95%
confidence intervals, 95% prediction intervals, and R2value
of regression line of the cone density of normal controls. We have evaluated the statistical analysis at one eccentricity from the fovea.
The automated cone labeling did not estimate each cone precisely in the images taken from the region with severe photoreceptor degeneration. To estimate the cone density of
Case II-2 in a 100× 100 𝜇m area at 600 𝜇m from the foveal
center, we manually selected circular spots more than 4𝜇m
in the images where the brightness was obviously higher than the surrounding background level. The density of the cones
was manually measured by three investigators to minimize any potential cone under- or oversampling.
3. Results
3.1. Case Report. A 64-year-old woman (II-2) reported a
gradual decrease of vision, and our examination showed that her decimal BCVA was 0.4 in the right eye and 0.3 in the left eye without obvious cataracts and fundus abnormalities. Family history revealed no other members with any eye
disease including her parents who were deceased (Figure 1).
She was referred for brain MRI to rule out cortical or optic nerve abnormalities because she had no obvious ocular abnormalities despite her decreased BCVA. The MRI findings were normal.
Six years later, she was referred to our hospital to undergo cataract surgery. Her BCVAs were 0.3 in the right eye and 0.2 in the left eye. Slit-lamp examinations showed that both lenses had mild cortical opacities. Fundus examinations were
nor-mal (Figures2(a)and2(b)). A month later, cataract surgery
was performed on both eyes without complications, but the visual acuity of both eyes did not improve. The findings of
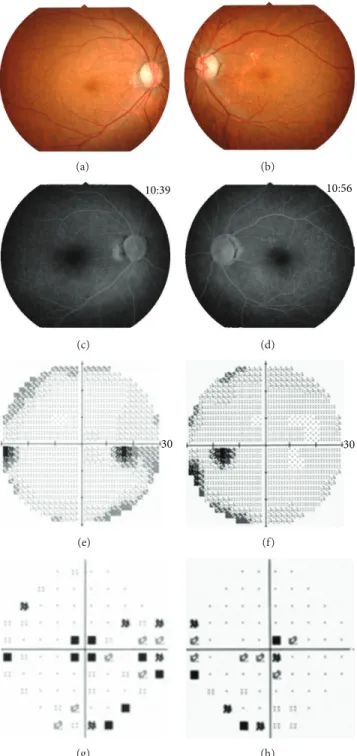
fluorescein angiography were normal (Figures2(c)and2(d)).
The visual fields were full by Goldman perimetry, and a relative reduction of the central sensitivity was detected in both eyes by the Humphrey Visual Field Analyzer (Figures
2(e)–2(h)). The SD-OCT images showed blurred ellipsoid
and discontinuous interdigitation zones at the fovea (Figures
3(e)and3(f)). The a- and b-wave amplitudes of dark-adapted
0.01 and 3.0 full-field ERGs were mildly reduced in the right eye, but the amplitudes of both eyes were within the normal
limits of our institutional age-matched controls (Figure 4).
The amplitudes of the b-wave of the cone ERGs and the ampli-tude of the flicker responses were markedly reduced in both
eyes (Figure 4). The amplitudes of the a- and b-waves of the
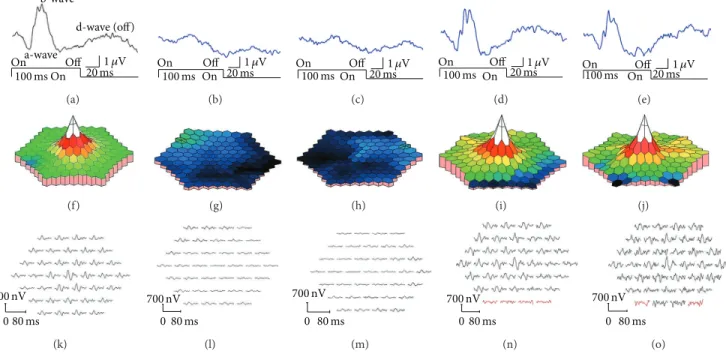
focal macular ERGs were severely reduced (Figures5(b)and
5(c)), and the amplitudes of the mfERGs in the central area
were also severely reduced (Figures5(g),5(h),5(l), and5(m)).
3.2. Molecular Genetic Findings. Mutation analysis of RP1L1
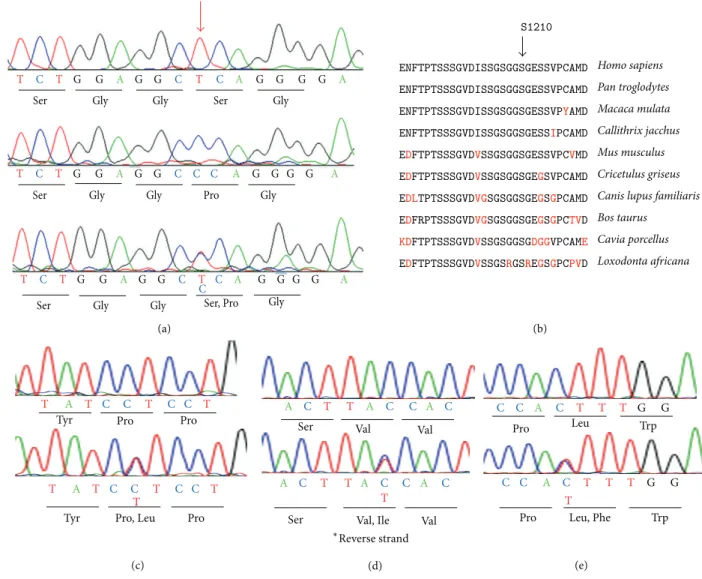
of Case II-2 identified a novel homozygous mutation (Figure 6(a), Table 2). The homozygous mutation was c.3628T>C in exon 4 which resulted in the substitution of proline for serine at amino acid position 1210. Parental consanguinity was denied by the patient. This mutation has not been reported in the single nucleotide polymorphisms
(a) (b) 10:39 (c) 10:56 (d) 30 (e) 30 (f) (g) (h)
Figure 2: Clinical findings of the proband, Patient II-2. Fundus photographs (a, b) and fluorescein angiograms (c, d) show no abnormal findings. The results of the Humphrey Visual Field Analyzer show a relative reduction of the central sensitivity in both eyes (e–h).
(SNP) database (http://www.ncbi.nlm.nih.gov/projects/SNP/),
1,000 gene project database, Japanese 1,500 exome database, the European genome database, and Exome Variant Server (http://evs.gs.washington.edu/EVS/) or in earlier reports
[3,4,42]. This mutation was also not present in 460
ethni-cally matched control alleles. The serine at position 1210 is well conserved among the RP1L1 family in other species (Figure 6(b)). We have previously reported the presence
of the p.S1199C mutation of RP1L1 in an OMD patient [2].
Amino acid residues surrounding these residues, 1193 to 1212, were well conserved among the RP1L1 family proteins (Figure 6(b)). This mutation was predicted to be probably damaging with a score of 1.00 by PolyPhen-2. The SIFT tool analysis revealed a score of 0 that predicted that the replaced amino acid is potentially damaging and would not be tolerated. PMut predicted that this mutation is pathological.
(a) (b) (c) (d) (e) (f) (g) (h) (i) (j) (k) (l)
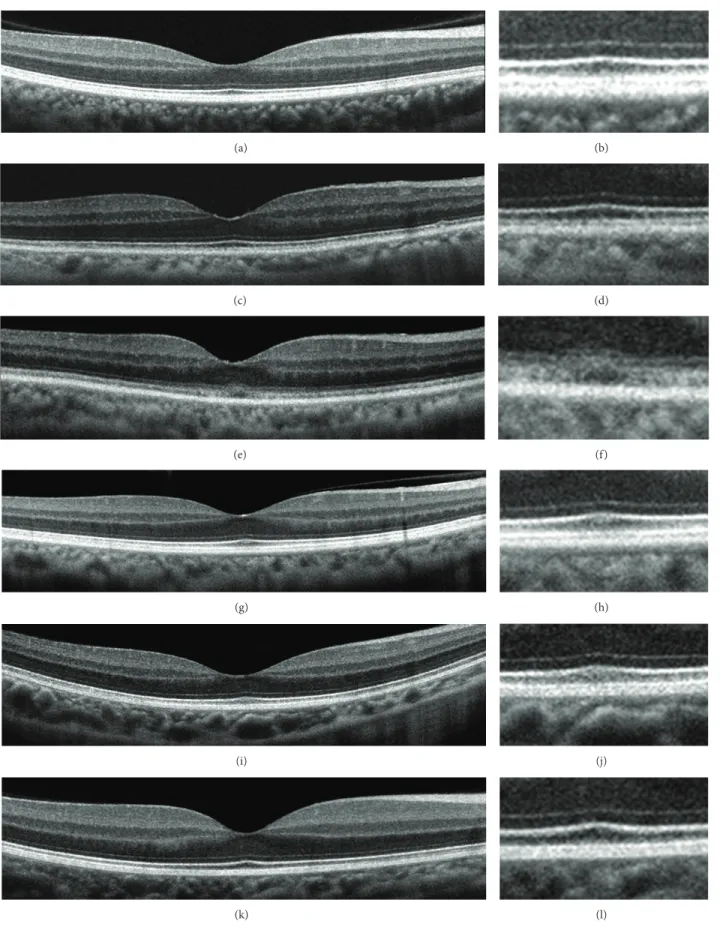
Figure 3: Spectral-domain optical coherence tomographic (SD-OCT) images. Images of normal control (a, b) and of family members (c–l). Images at lower magnification (a, c, e, g, i, and k) and higher magnification (b, d, f, h, j, and l) are shown. SD-OCT images from the right eye of a normal control (a, b), Case II-1 (c, d), Case II-2 (e, f), Case III-2 (g, h), Case IV-1 (i, j), and Case IV-2 (k, l) are shown. The SD-OCT findings of the eyes in Case II-2 show blurred ellipsoid and discontinuous interdigitation zones (e, f). Family member of the case showed clearly distinguishable ellipsoid and interdigitation zones in the central macular area.
OS N o rm al co n tr o l 100 ms 100 ms 100 ms 50 ms 50 ms 50 ms 40 ms 40 ms 40 ms 40 ms 40 ms 40 ms 400 𝜇V 200 𝜇V 0 V 400 𝜇V 200 𝜇V 0 V 400 𝜇V 200 𝜇V 0 V 400 𝜇V 200 𝜇V 0 V 200 𝜇V 100 𝜇V 0 V 200 𝜇V 100 𝜇V 0 V 200 𝜇V 100 𝜇V 0 V 200 𝜇V 100 𝜇V 0 V
Figure 4: Full-field electroretinograms (ERGs). Full-field ERGs recorded from Case II-2 are shown. The dark-adapted 0.01, dark-adapted 3.0, light-adapted 3.0, and light-adapted 3.0 flicker ERGs are shown. The results of dark-adapted 0.01 and dark-adapted 3.0 ERGs show a slight reduction of the b-wave amplitudes of the right eye although the amplitudes are within normal limit of our institutional age-matched standard. The amplitudes of the b-wave of light-adapted 3.0 and light-adapted 3.0 flicker responses are markedly reduced in both eyes.
b-wave a-wave On Off 20 ms1 𝜇V d-wave (off) 100 ms On (a) On Off 20 ms1 𝜇V 100 ms On (b) On Off 20 ms1 𝜇V 100 ms On (c) On Off 20 ms1 𝜇V 100 ms On (d) On Off 20 ms1 𝜇V 100 ms On (e) (f) (g) (h) (i) (j) 700 nV 80 ms 0 (k) 700 nV 80 ms 0 (l) 700 nV 80 ms 0 (m) 700 nV 80 ms 0 (n) 700 nV 80 ms 0 (o)
Figure 5: Results of focal macular ERGs and multifocal ERGs. Focal macular ERGs recorded from normal control (a), Case II-2 (b, c), and Case III-2 (d, e) are shown. The amplitudes of the a-wave and b-wave of Case II-2 are severely reduced. Topographic map (f–j) and local responses (k–o) of multifocal ERGs recorded from normal control (f, k), Case II-2 (g, h, l, and m), and Case III-2 (i, j, n, and o) are shown. The amplitudes of the foveal area are severely reduced in Case II-2. The results from right eyes (b, d, g, i, l, and n) and left eyes (a, c, e, f, h, j, k, m, and o) are shown. The amplitudes of the focal macular ERGs and mfERGs in proband’s daughter (III-2) were within normal limits (Figures5(d),5(e),5(i),5(j),5(n), and5(o)).
Aligned GVGD predicted this mutation as Class C65 which indicates that this protein will most likely interfere with protein function.
We examined the family members and confirmed that the proband’s daughter (III-2) and two grandsons (IV-1,
IV-2) were heterozygous carriers of c.3628T>C (Figure 1,
Figure 6(a)). A brother of the proband (II-1) was homozygous
for the wild type allele of c.3628 T (Figure 1). Clinical
exam-inations including BCVAs, slit-lamp biomicroscopy, fundus ophthalmoscopy, SD-OCT, focal ERGs, and mfERGs were
T C T G G A G G C T C A G G G G A Gly Gly Gly Pro Ser, Pro Ser Ser T C T A C C C A A A G G G G G G G G G G G G Gly Gly Gly Gly Ser T C T T C C C A A G G G G Gly Gly Ser ENFTPTSSSGVDISSGSGGSGESSVPCAMD ENFTPTSSSGVDISSGSGGSGESSVPCAMD ENFTPTSSSGVDISSGSGGSGESSVPYAMD ENFTPTSSSGVDISSGSGGSGESSIPCAMD EDFTPTSSSGVDVSSGSGGSGESSVPCVMD EDFTPTSSSGVDVSSGSGGSGEGSVPCAMD EDLTPTSSSGVDVGSGSGGSGEGSGPCAMD EDFRPTSSSGVDVGSGSGGSGEGSGPCTVD KDFTPTSSSGVDVSSGSGGSGDGGVPCAME EDFTPTSSSGVDVSSGSRGSREGSGPCPVD S1210 Homo sapiens Pan troglodytes Macaca mulata Callithrix jacchus Mus musculus Cricetulus griseus Canis lupus familiaris Bos taurus Cavia porcellus Loxodonta africana Pro Pro Tyr Pro, Leu T A T C C T C C T Pro Tyr T T T T T C C C C A Val Val Val Val, Ile Ser Ser T T T T T C C C C C C C A A A A A A C ∗Reverse strand Trp Trp Leu, Phe Leu G G G G T T T T T T T C C C C C A C A Pro Pro (a) (c) (d) (e) (b)
Figure 6: Molecular genetic results. (a) Sequence chromatograms for normal control (top), Case II-2 (middle), and Case III-2 (bottom) are shown. Case II-2 had a homozygous c.3628T>C mutation in exon 4. Case III-2 had a heterozygous c.3628T>C mutation. Position c.3628 is indicated by red arrow. (b) Alignment of amino acid position 1191 to 1220 of RP1L1 family proteins. Amino acid-sequence alignments of RP1L1 from 10 species reported in the NCBI database are shown. Amino acid position of 1210 is indicated by arrows. (c) Direct sequencing results of PCDH15 gene were shown. Sequence chromatograms for normal control (top) and II-2 (bottom) are shown. II-2 had a heterozygous c.2768C>T mutation. (d) Direct sequencing results of RPGRIP1 gene are shown. Sequence chromatograms for normal control (top) and Case II-2 (bottom) are shown. Case II-2 had a heterozygous c.3634G>A mutation. (e) Direct sequencing results of GPR98 gene were shown. Sequence chromatograms for normal control (top) and Case II-2 (bottom) are shown. Case II-2 had a heterozygous c.7264C>T mutation.
performed on proband’s daughter and grandsons (III-2, IV-1, and IV-2). We also measured the BCVAs, slit-lamp biomicroscopy, ophthalmoscopy, and SD-OCT of proband’s brother (II-1). The findings of all examinations were normal. The OCT findings of the family (II-1, III-2, IV-1, and IV-2)
are shown inFigure 3. The results of focal macular ERGs and
mfERGs of proband’s daughter are shown inFigure 5.
3.3. Molecular Genetic Analysis Using Next-Generation Sequencing (NGS). To search for the possibility that the
cone dystrophy phenotype of the patient was caused by a gene defect other than the RP1L1 mutation, we performed NGS analysis with an exon sequencing array targeting 123 known genes associated with retinal diseases. The NGS approach identified only heterozygous missense changes
in PCDH15 (p.P923L), RPGRIP1 (p.V1211I), and GPR98
(p.L2422F;Table 2). Subsequently, we designed primer pairs
for PCR direct sequencing to amplify the regions identified by NGS. The results of PCR direct sequencing analysis of
the family members are shown in Figures1and6 (Figures
6(c)–6(e)). All three mutations identified by NGS approach
did not cosegregate with the cone dystrophy phenotype, and the results of PolyPhen-2 and SIFT predicted the mutations
to be benign and/or tolerated (Figure 1,Table 2). The RP1L1
mutation was the only one that cosegregated with the cone dystrophy phenotype in the homozygous state and both simulation programs predicted it to be damaging.
3.4. High-Resolution Imaging Analysis. High-resolution en face AO imaging was performed on Cases II-2 (proband) and
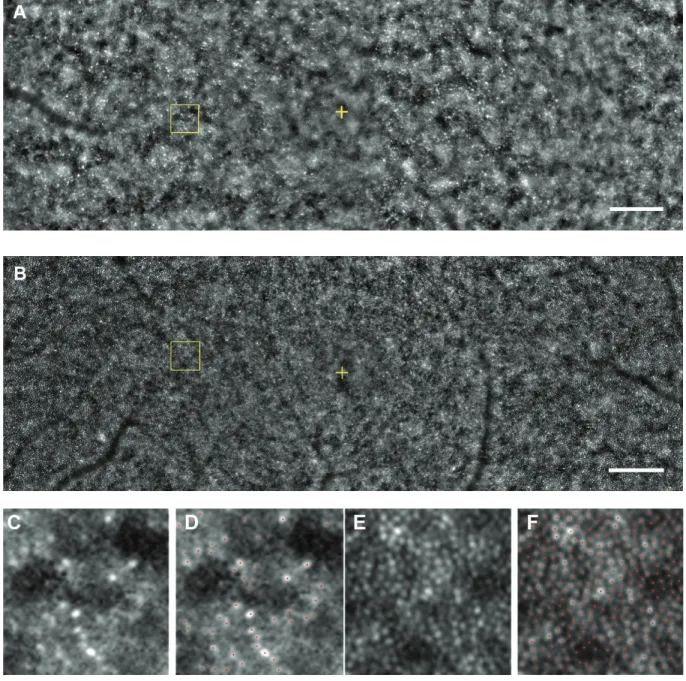
Figure 7: Adaptive optics images. A montage of low-magnification AO image of Case II-2 (A) and Case III-2 (B) is shown. Regular cone mosaics are not observed throughout the posterior pole in AO image of Case II-2, while AO image of Case III-2 shows well-ordered cone mosaic. Yellow cross indicates the fovea. Bar = 200𝜇m. (C, D) Magnified view of the area outlined in (A) is shown. Regular cone mosaics are not observed in the region (C). Distance of the area from the foveal center is 600𝜇m. A size of 100 × 100 𝜇m area is shown. (D) Cone labeling results in same region as (C) are shown. Red dots indicate estimated cones. (E, F) Magnified view of the area outlined in (B). Regular cone mosaics are observed (E). Distance of the area from the foveal center is 600𝜇m. A size of 100 × 100 𝜇m area is shown. (F) Cone labeling results in same region as (E) are shown. Red dots indicate estimated cones.
III-2. The cone mosaic of Case II-2 was disrupted throughout the horizontal 12-degree diameter region surrounding fovea
(Figures7(A),7(C), and7(D)). The AO images of Case
III-2, a daughter of the proband, showed a well-ordered cone
mosaic (Figures7(B),7(E), and7(F)). We examined the cone
density at 600𝜇m from the fovea and the axial length of 26
normal control eyes. The values of normal control group were
compared to the values of Cases II-2 and III-2 (Figure 8).
A significant negative correlation between the axial length
and cone density has been reported [43,44], and it was 0.6187
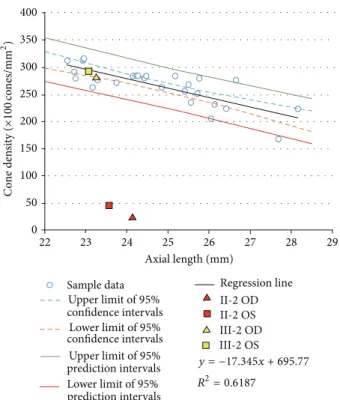
for the normal controls in our study. The cone density of both eyes of Case III-2 was within the 95% prediction interval, whereas the cone densities of Case II-2 were far outside the
95% prediction interval for both eyes (Figure 8). Because the
cone labeling and cone counting were performed manually for the images from Case II-2, the estimated cone density may not be an accurate number of healthy cones. However, we could recognize that the arrangement of cone mosaic was not normal throughout the investigated region of the eyes in Case II-2. By comparing the ellipsoid and interdigitation
II-2 OD II-2 OS III-2 OD III-2 OS y = −17.345x + 695.77 R2= 0.6187 400 350 300 250 200 150 100 50 0 22 23 24 25 26 27 28 29 Axial length (mm)
Sample data Regression line
Upper limit of95% confidence intervals Lower limit of95% confidence intervals Upper limit of95% prediction intervals Lower limit of95% prediction intervals C o ne den si ty ( ×100 co nes/mm 2)
Figure 8: Statistical data of adaptive optics analyses. Relationship between cone density and axial length was obtained from 26 normal control samples. There was a statistically significant negative correlation between cone density and axial length (R2 = 0.6187). Upper and lower limit of 95% confidence intervals, 95% prediction intervals, and regression line of normal controls are shown. The results of estimated cone density and axial length in Patients II-2 and III-2 are plotted as indicated marks.
zones of the OCT images against AO images of Cases II-2 and III-2, a decreased cone density in the AO images of II-2 was consistent with the disrupted ellipsoid and interdigitation zones in the OCT images. Also, a well-ordered cone mosaic in III-2 was consistent with clearly distinguishable ellipsoid and interdigitation zones in the SD-OCT images. Because both the SD-OCT images of ellipsoid and the interdigitation zones and AO images with the focusing depth adjusted at the depth of maximum cone image intensity reflect the morphological feature of the same region, the AO and SD-OCT findings in the family were in good agreement.
4. Discussion
The homozygous mutation of the RP1L1 gene in our case was a missense mutation with a substitution of proline for serine at amino acid position 1210. Heterozygous carriers of the p.S1210P mutation in her family did not have the phenotype of cone dystrophy or OMD despite the intense screening includ-ing high-resolution AO analysis. Genetic and phenotypic studies of the family members suggested that the homozygous p.S1210P mutation in RP1L1 is able to cause cone dystrophy without affecting heterozygous individuals. Thus, our results suggest that the mutation of RP1L1 gene can cause autosomal dominant OMD and autosomal recessive cone dystrophy.
Several genes which can cause both autosomal domi-nant and recessive photoreceptor degeneration have been reported. There are at least five genes, RHO, NRL, NR2E3,
CRX, and RP1, associated with both autosomal dominant
retinitis pigmentosa (ADRP) and autosomal recessive
retini-tis pigmentosa (ARRP) [45–48]. The reported mutations in
RHO, NRL, NR2E3, and CRX are predominantly missense
changes resulting in dysfunction of the mutant proteins. Therefore, these mutations most likely have dominant nega-tive or gain-of-function effects on the molecular mechanism
of RP [45–47]. In contrast, mutations in the RP1 gene are
predominantly truncation mutations resulting in premature
termination codons [48]. Davidson et al. identified two
unre-lated RP patients with homozygous mutations in the RP1L1
gene [3]. The mutations were a homozygous missense
muta-tion with predicmuta-tion of benign and tolerated by PolyPhen-2 and SIFT, respectively, and a homozygous premature termi-nation mutation in RP1L1. These two patients with recessive RP had typical signs of RP including intraretinal bone spicule pigment deposits in the periphery and attenuated retinal vessels.
There have been approximately 1,000 nonsynonymous SNPs reported for the RP1L1 gene with missense and frameshift variants in the SNP database. Almost all of these variants including 11 frameshifts with premature termination of the RP1L1 protein were nonpathogenic. Although none of the frameshift variants reported in the SNP database was found in the population-frequency data, most of them were reported in multiple independent studies. These findings indicate that a loss-of-function effect in RP1L1 gene may not be pathogenic.
At present, several putative pathogenic variants of the
RP1L1 gene have been reported; however, only a variant,
p.R45W, was shown to be in the multiple OMD reports [1–6].
Therefore, it is very important to evaluate new RP1L1 variants carefully to determine whether they are pathogenic. Our case had a variation in the amino acid position 1210 which is close to the region of the reported disease-causing mutations
(p.S1199C and p.G1200A) [2,3]. The region between amino
acid positions 1193 to 1212 is well conserved among species. Computational mutation analyses of all three mutations (S1199C, G1200A, and S1210P) are strongly suggested to be disease-causing, while most of the other putative RP1L1 mutations are predicted to be benign or tolerated in at
least one analysis program [2–4]. These results support the
hypothesis that missense mutations in this region have a gain-of-function effect.
Our cone dystrophy case had similar characteristics as those of OMD. The fundus was normal appearing but with distinctive SD-OCT findings, for example, blurring of the
ellipsoid and discontinuous interdigitation zones [2,4,5,14].
Electrophysiological examinations showed severe dysfunc-tion of the central cones with mild dysfuncdysfunc-tion of the periph-eral cones. Usually, OMD patients have depressed cone
sen-sitivity only in the macula [11,15]. However, an OMD patient
with RP1L1 mutation (p.R45W) has been reported who had slight reductions of cone function in the full-field ERGs suggesting that the dysfunction of RP1L1 can cause cone
not have a mild cone dystrophy or OMD. One hypothesis for this is that the mutation is not pathogenically damaging enough to cause phenotypic alterations in heterozygous indi-vidual because the mutated amino acid position is peripheral to the conserved region of the gene. So far, a detailed three-dimensional conformation and the function of the RP1L1 protein have not been published, and the effects of the missense mutation on protein function have also not been published. Although we could estimate the effect of the variance of RP1L1 gene by computational mutation analysis and their amino acid conservation in other species, we need to confirm the missense effect by their functional aspect, for example, making knock-in mice with the mutation, and protein interaction assay with mutant proteins. We performed NGS analysis to search for possible candidate genes other than the RP1L1 that might have caused the cone dystrophy phenotype of patients. Although we did not find any possible disease causing mutations in other genes, the mutation detection rate of our NGS analysis was 57% of cases
of known and novel mutations [34]. Therefore, we cannot
exclude the possibility that other mutations or large deletions not detectable by the methods used in this study contributed to the phenotype.
We have demonstrated a family with a possible autosomal recessive RP1L1 mutation, but it is important to note that we have found the mutation only in one family. Although we accumulated the evidence to possibly verify the presence of autosomal recessive cone dystrophy with RP1L1 mutation, another patient with the same mutation will be needed to confirm the effect of the mutation.
5. Conclusions
In conclusion, our findings show the possibility that homozy-gous p.S1210P exchange in the RP1L1 gene can cause cone dystrophy, which would then extend the phenotype of OMD.
Conflict of Interests
The authors declare that they have no conflict of interests associated with this paper.
Authors’ Contribution
Sachiko Kikuchi and Shuhei Kameya contributed equally to this work.
Acknowledgments
The authors thank Dr. Duco Hamsaki of the Bascom Palmer Eye Institute, University of Miami School of Medicine, Miami, FL, for discussions and editing the paper. This work was supported by Foundation Voir et Entendre (CZ), Prix
Nationale de la Recherche [LIFESENSES: ANR-10-LABX-65].
References
[1] M. Akahori, K. Tsunoda, Y. Miyake et al., “Dominant mutations in RP1L1 are responsible for occult macular dystrophy,” The
American Journal of Human Genetics, vol. 87, no. 3, pp. 424–429,
2010.
[2] T. Kabuto, H. Takahashi, Y. Goto-Fukuura et al., “A new muta-tion in the RP1L1 gene in a patient with occult macular dys-trophy associated with a depolarizing pattern of focal macular electroretinograms,” Molecular Vision, vol. 18, pp. 1031–1039, 2012.
[3] A. E. Davidson, P. I. Sergouniotis, D. S. Mackay et al., “RP1L1 variants are associated with a spectrum of inherited retinal diseases including retinitis pigmentosa and occult macular dystrophy,” Human Mutation, vol. 34, no. 3, pp. 506–514, 2013. [4] S. J. Ahn, S. I. Cho, J. Ahn, S. S. Park, K. H. Park, and S. J.
Woo, “Clinical and genetic characteristics of Korean occult macular dystrophy patients,” Investigative Ophthalmology and
Visual Science, vol. 54, no. 7, pp. 4856–4863, 2013.
[5] T. Hayashi, T. Gekka, K. Kozaki et al., “Autosomal dominant occult macular dystrophy with an RP1L1 mutation (R45W),”
Optometry & Vision Science, vol. 89, no. 5, pp. 684–691, 2012.
[6] T. Okuno, T. Hayashi, J. Sugasawa et al., “Elderly case of pseudo-unilateral occult macular dystrophy with Arg45Trp mutation in RP1L1 gene,” Documenta Ophthalmologica, vol. 127, no. 2, pp. 141–146, 2013.
[7] I. Conte, M. Lestingi, A. den Hollander et al., “Identification and characterisation of the retinitis pigmentosa 1-like1 gene (RP1L1): a novel candidate for retinal degenerations,” European Journal of
Human Genetics, vol. 11, no. 2, pp. 155–162, 2003.
[8] S. J. Bowne, S. P. Daiger, K. A. Malone et al., “Characterization of
RP1L1, a highly polymorphic paralog of the retinitis pigmentosa 1 (RP1) gene,” Molecular Vision, vol. 9, pp. 129–137, 2003.
[9] T. Yamashita, J. Liu, J. Gao et al., “Essential and synergistic roles of RP1 and RP1L1 in rod photoreceptor axoneme and retinitis pigmentosa,” The Journal of Neuroscience, vol. 29, no. 31, pp. 9748–9760, 2009.
[10] Y. Miyake, K. Ichikawa, Y. Shiose, and Y. Kawase, “Hereditary macular dystrophy without visible fundus abnormality,” The
American Journal of Ophthalmology, vol. 108, no. 3, pp. 292–299,
1989.
[11] Y. Miyake, M. Horiguchi, N. Tomita et al., “Occult macular dystrophy,” American Journal of Ophthalmology, vol. 122, no. 5, pp. 644–653, 1996.
[12] G. P. Matthews, M. A. Sandberg, and E. L. Berson, “Foveal cone electroretinograms in patients with central visual loss of unexplained etiology,” Archives of Ophthalmology, vol. 110, no. 11, pp. 1568–1570, 1992.
[13] Y.-G. Kim, S.-H. Baek, S. W. Moon, H.-K. Lee, and U. S. Kim, “Analysis of spectral domain optical coherence tomography findings in occult macular dystrophy,” Acta Ophthalmologica, vol. 89, no. 1, pp. e52–e56, 2011.
[14] K. Tsunoda, T. Usui, T. Hatase et al., “Clinical characteristics of occult macular dystrophy in family with mutation of RP1L1 gene,” Retina, vol. 32, no. 6, pp. 1135–1147, 2012.
[15] Y. Miyake, “Occult macular dystrophy,” in Electrodiagnosis of
Retinal Diseases, pp. 153–159, Springer, Tokyo, Japan, 2006.
[16] A. Roorda and D. R. Williams, “The arrangement of the three cone classes in the living human eye,” Nature, vol. 397, no. 6719, pp. 520–522, 1999.
[17] J. I. Wolfing, M. Chung, J. Carroll, A. Roorda, and D. R. Williams, “High-resolution retinal imaging of cone-rod dystro-phy,” Ophthalmology, vol. 113, no. 6, pp. 1014.e1–1019.e1, 2006. [18] K. Gocho, S. Kikuchi, T. Kabuto et al., “High-resolution en face
images of microcystic macular edema in patients with autoso-mal dominant optic atrophy,” BioMed Research International, vol. 2013, Article ID 676803, 12 pages, 2013.
[19] S. S. Choi, N. Doble, J. L. Hardy et al., “In vivo imaging of the photoreceptor mosaic in retinal dystrophies and correlations with visual function,” Investigative Ophthalmology and Visual
Science, vol. 47, no. 5, pp. 2080–2092, 2006.
[20] J. L. Duncan, Y. Zhang, J. Gandhi et al., “High-resolution imaging with adaptive optics in patients with inherited retinal degeneration,” Investigative Ophthalmology and Visual Science, vol. 48, no. 7, pp. 3283–3291, 2007.
[21] K. Gocho, S. Kameya, K. Akeo et al., “High-resolution imaging of patients with Bietti crystalline dystrophy with CYP4V2 mutation,” Journal of Ophthalmology, vol. 2014, Article ID 283603, 12 pages, 2014.
[22] J. Liang, D. R. Williams, and D. T. Miller, “Supernormal vision and high—resolution retinal imaging through adaptive optics,”
Journal of the Optical Society of America A: Optics and Image Science, and Vision, vol. 14, no. 11, pp. 2884–2892, 1997.
[23] Y. Kitaguchi, T. Fujikado, S. Kusaka, T. Yamaguchi, T. Mihashi, and T. Tano, “Imaging of titanium:sapphire laser retinal injury by adaptive optics fundus imaging and fourier-domain optical coherence tomography,” American Journal of Ophthalmology, vol. 148, no. 1, pp. 97.e2–104.e2, 2009.
[24] M. F. Marmor, A. B. Fulton, G. E. Holder, Y. Miyake, M. Brigell, and M. Bach, “ISCEV Standard for full-field clinical electroretinography (2008 update),” Documenta
Ophthalmolog-ica, vol. 118, no. 1, pp. 69–77, 2009.
[25] Y. Miyake, “Macular oscillatory potentials in humans. Macular OPs,” Documenta Ophthalmologica, vol. 75, no. 2, pp. 111–124, 1990.
[26] Y. Miyake, “Focal macular electroretinography,” Nagoya Journal
of Medical Science, vol. 61, no. 3-4, pp. 79–84, 1998.
[27] E. E. Sutter and D. Tran, “The field topography of ERG com-ponents in Man-I. The photopic luminance response,” Vision
Research, vol. 32, no. 3, pp. 433–446, 1992.
[28] M. A. Bearse Jr. and E. E. Sutter, “Imaging localized retinal dysfunction with the multifocal electroretinogram,” Journal of
the Optical Society of America A: Optics and Image Science, and Vision, vol. 13, no. 3, pp. 634–640, 1996.
[29] I. A. Adzhubei, S. Schmidt, L. Peshkin et al., “A method and server for predicting damaging missense mutations,” Nature
Methods, vol. 7, no. 4, pp. 248–249, 2010.
[30] P. C. Ng and S. Henikoff, “SIFT: predicting amino acid changes that affect protein function,” Nucleic Acids Research, vol. 31, no. 13, pp. 3812–3814, 2003.
[31] C. Ferrer-Costa, M. Orozco, and X. de la Cruz, “Characteri-zation of disease-associated single amino acid polymorphisms in terms of sequence and structure properties,” Journal of
Molecular Biology, vol. 315, no. 4, pp. 771–786, 2002.
[32] S. V. Tavtigian, A. M. Deffenbaugh, L. Yin et al., “Comprehen-sive statistical study of 452 BRCA1 missense substitutions with classification of eight recurrent substitutions as neutral,” Journal
of Medical Genetics, vol. 43, no. 4, pp. 295–305, 2006.
[33] E. Mathe, M. Olivier, S. Kato, C. Ishioka, P. Hainaut, and S. V. Tavtigian, “Computational approaches for predicting the biological effect of p53 missense mutations: a comparison of three sequence analysis based methods,” Nucleic Acids Research, vol. 34, no. 5, pp. 1317–1325, 2006.
[34] I. Audo, K. M. Bujakowska, T. L´eveillard et al., “Develop-ment and application of a next-generation-sequencing (NGS) approach to detect known and novel gene defects underlying retinal diseases,” Orphanet Journal of Rare Diseases, vol. 7, article 8, 2012.
[35] C. Viard, K. Nakashima, B. Lamory, M. Paques, X. Levecq, and N. Chateau, “Imaging microscopic structures in pathological retinas using a flood-illumination adaptive optics retinal cam-era,” in Ophthalmic Technologies XXI, vol. 7885 of Proceedings of
SPIE, 2011.
[36] M. Lombardo, S. Serrao, N. Devaney, M. Parravano, and G. Lombardo, “Adaptive optics technology for high-resolution retinal imaging,” Sensors, vol. 13, no. 1, pp. 334–366, 2013. [37] M. Lombardo, G. Lombardo, P. Ducoli, and S. Serrao, “Adaptive
optics photoreceptor imaging,” Ophthalmology, vol. 119, no. 7, p. 1498, 2012.
[38] M. Lombardo, S. Serrao, P. Ducoli, and G. Lombardo, “Varia-tions in image optical quality of the eye and the sampling limit of resolution of the cone mosaic with axial length in young adults,”
Journal of Cataract and Refractive Surgery, vol. 38, no. 7, pp.
1147–1155, 2012.
[39] N. Tojo, T. Nakamura, C. Fuchizawa, T. Oiwake, and A. Hayashi, “Adaptive optics fundus images of cone photoreceptors in the macula of patients with retinitis pigmentosa,” Clinical
Ophthalmology, vol. 7, pp. 203–210, 2013.
[40] I. Audo, M. El Sanharawi, C. Vignal-Clermont et al., “Foveal damage in habitual poppers users,” Archives of Ophthalmology, vol. 129, no. 6, pp. 703–708, 2011.
[41] A. G. Bennett, A. R. Rudnicka, and D. F. Edgar, “Improvements on Littmann’s method of determining the size of retinal features by fundus photography,” Graefe’s Archive for Clinical and
Exper-imental Ophthalmology, vol. 232, no. 6, pp. 361–367, 1994.
[42] Genomes Project Consortium, G. R. Abecasis, D. Altshuler et al., “A map of human genome variation from population-scale sequencing,” Nature, vol. 467, pp. 1061–1073, 2010.
[43] K. Y. Li, P. Tiruveedhula, and A. Roorda, “Intersubject vari-ability of foveal cone photoreceptor density in relation to eye length,” Investigative Ophthalmology and Visual Science, vol. 51, no. 12, pp. 6858–6867, 2010.
[44] S. P. Park, J. K. Chung, V. Greenstein, S. H. Tsang, and S. Chang, “A study of factors affecting the human cone photoreceptor density measured by adaptive optics scanning laser ophthalmo-scope,” Experimental Eye Research, vol. 108, pp. 1–9, 2013. [45] L. J. Chen, T. Y. Y. Lai, P. O. S. Tam et al., “Compound
heterozy-gosity of two novel truncation mutations in RP1 causing autoso-mal recessive retinitis pigmentosa,” Investigative Ophthalmology
and Visual Science, vol. 51, no. 4, pp. 2236–2242, 2010.
[46] D. T. Hartong, E. L. Berson, and T. P. Dryja, “Retinitis pigmen-tosa,” The Lancet, vol. 368, no. 9549, pp. 1795–1809, 2006. [47] A. I. Gire, L. S. Sullivan, S. J. Bowne et al., “The Gly56Arg
mutation in NR2E3 accounts for 1-2% of autosomal dominant retinitis pigmentosa,” Molecular Vision, vol. 13, pp. 1970–1975, 2007.
Submit your manuscripts at
http://www.hindawi.com
Stem Cells
International
Hindawi Publishing Corporation
http://www.hindawi.com Volume 2014
Hindawi Publishing Corporation
http://www.hindawi.com Volume 2014
INFLAMMATION
Hindawi Publishing Corporation
http://www.hindawi.com Volume 2014
Behavioural
Neurology
Endocrinology
International Journal ofHindawi Publishing Corporation
http://www.hindawi.com Volume 2014
Hindawi Publishing Corporation
http://www.hindawi.com Volume 2014
Disease Markers
Hindawi Publishing Corporation
http://www.hindawi.com Volume 2014
BioMed
Research International
Oncology
Journal ofHindawi Publishing Corporation
http://www.hindawi.com Volume 2014
Hindawi Publishing Corporation
http://www.hindawi.com Volume 2014
Oxidative Medicine and Cellular Longevity Hindawi Publishing Corporation
http://www.hindawi.com Volume 2014
PPAR Research
The Scientific
World Journal
Hindawi Publishing Corporation
http://www.hindawi.com Volume 2014
Immunology Research
Hindawi Publishing Corporation
http://www.hindawi.com Volume 2014 Journal of
Obesity
Journal ofHindawi Publishing Corporation
http://www.hindawi.com Volume 2014
Hindawi Publishing Corporation
http://www.hindawi.com Volume 2014
Computational and Mathematical Methods in Medicine
Ophthalmology
Journal ofHindawi Publishing Corporation
http://www.hindawi.com Volume 2014
Diabetes Research
Journal of Hindawi Publishing Corporationhttp://www.hindawi.com Volume 2014
Hindawi Publishing Corporation
http://www.hindawi.com Volume 2014
Research and Treatment
AIDS
Hindawi Publishing Corporation
http://www.hindawi.com Volume 2014 Gastroenterology Research and Practice
Hindawi Publishing Corporation
http://www.hindawi.com Volume 2014