Crystallization Studies of Liquid Crystalline
Polycarbonates Based on Substituted Stilbene Mesogen
by
Yao-Yi Cheng
B.S., Tsing Hua University, Hsinchu, Taiwan (1990)
Submitted to the Department of Materials Science and Engineering in partial fulfillment of
the requirement for the degree of
DOCTOR OF PHILOSOPHY
at the
Massachusetts Institute of Technology February, 1995
© Massachusetts Institute of Technology, 1995. All rights reserved.
7? •
Signature of Author
7 Department of Materials Science and Engineering January 13, 1995 Certified by
AcceDted by
(Jr
ý
Associate Professor Peggy Cebe Thesis Supervisor"I Carl V. Thompson II
Professor of Electronic Materia ,Maeisu•,,~pLg.ymCommittee on Graduate Students
OF TECHNOLOGY
dewnýr
JUL
2 0
1995
0 A A ý-
-R J I~%~iil~p~
Crystallization Studies of Liquid Crystalline
Polycarbonates Based on Substituted Stilbene Mesogen
by
Yao-Yi Cheng
Submitted to the Department of Materials Science and Engineering on January 13, 1995, in partial fulfillment of the requirement for the degree
of Doctor of Philosophy
Abstract
The purpose of this research is to investigate the relationship between the chemical structure variations and the macroscopic properties like thermal transition temperatures and crystallization kinetics for liquid crystalline polycarbonates based on substituted stilbene mesogen. The chemical variations include changes in the methylene spacer length and substitution on the mesogen. We are able to determine the role of the chemical variations on the thermodynamic stability of the mesophase and in the nucleation kinetics and growth of the crystalline phase.
For our liquid crystalline a-methyl stilbene (HMS) polycarbonates, there is a very narrow temperature range of stability for the mesophase. The mesophase, which is actually monotropic, can be only observed during cooling when three dimensional crystal growth is suppressed. The multiple melting endotherms seen in the heating scan are assigned either to the melting of more perfect crystals forming from the mesophase (melting at higher temperature) or to less perfect crystals forming from the isotropic phase (melting at lower temperature). The region of stability of the mesophase seen in the cooling scan becomes smaller, when the methylene spacer number, n, ranges from 5 to 8. When the length of spacer becomes greater than that of the mesogen (n 2 9), all the transition temperatures drop. Using wide angle X-ray scattering and molecular modeling, we show that the orientation of the carbonate group and the length of the methylene spacer are both implicated in the rapid nucleation of crystals. When the length of the methylene spacer and the mesogen are comparable, a regularly packed intermeshed crystal structure occurs. This crystal structure forms rapidly from the mesophase which acts as a template for nucleation and growth of crystals from an already ordered melt. Using small angle X-ray scattering, we have found for the first time that HMS polycarbonates with odd-numbered methylene spacer have a higher value of crystal lamellar thickness than those with even-numbered one. The odd-even oscillation in lattice parameters and lamellar characteristics has not been reported before. Changes in long period, lamellar thickness, and linear crystallinity during non-isothermal crystallization and melting are explained by a model of dual lamellar thickness.
The steric effect of the second lateral methyl substituent on the stilbene mesogen lowers the stability of the mesophase of a,1-dimethyl stilbene (DMS) polycarbonates. Because of the steric effect, DMS polycarbonates do not have "odd-even" property oscillation with the methylene spacer length as HMS polycarbonates do.
Thesis Supervisor: Dr. Peggy Cebe
Acknowledgements
I would like first to thank my thesis supervisor, Professor Peggy Cebe, for her guidance and encouragement. I am very grateful for her advocate as my thesis advisor and mentor. Also, her assistance in correcting my thesis writing is deeply appreciated.
I wish to extend my thanks to my committee members, Professor Michael F. Rubner, Professor Anne M. Mayes, and Professor Lionel C. Kimerling, for their advice and encouragement.
I also appreciate the support from Dr. Schreuder-Gibson's group in the U. S. Army Natick R, D &E Center. The materials in this research are synthesized by them.
There is a lot of pleasant time with my colleagues, Dr. Peter P. Huo, Dr. Norene Lucas, Dr. Enid Sichel, Sharon Lu, Dave Rich, Mark Brillhart, Yoshi Aihara, Justyna Teverovsky, Linda Molnar, and undergraduate researchers Wendy Russell, Julie Holmes, Ingchie Kwan, Preston Li and Roland Desrochers. Ms. Amy Sklivas is also highly acknowledged. I would like to thank my other colleagues at MIT, among them are Dr. Yaping Liu, Dr. Ding-Kuo Ding, Peter Kloumann, Joe Adario, Michael Frongillo, John Martin, Ken Zemach, Bill Stockton, Stephanie Simmons and Sandy Schaefer Ung.
The following funds which support this research are gratefully acknowledged. They are U. S. Army Research Office (DAAL03-91-G-0132, DAAH04-94-G-0317), (Scientific Services Program DAAL03-91-C-0034), Petroleum Research Fund of the American Chemical Society, and PPG Industries Foundation.
My family deserves much credit. The support from my parents have been greatly helpful. I also thank my wife, Crystal Liu, for her love and constant encouragement.
TABLE OF CONTENTS
T itle P age ... 1 A bstract ... 2 Acknowledgements ... 3 T able of C ontents ... 4 L ist of F igures ... 8 L ist of T ables ... ... 12Chapter 1: Introduction and Background ... ... 14
1.1 Overview of Liquid Crystalline Behavior ... ... 14
1.1.1 Introduction to Liquid Crystalline Polymers and Definitions ... 14
1.1.2 Review of the History of Liquid Crystalline Polymers ... 16
1.1.3 Introduction to Monotropic Liquid Crystalline Behavior ... 17
1.2 Overview of Main Chain Thermotropic Liquid Crystalline Polymers ... 21
1.2.1 Introduction ... 2 1 1.2.2 Stilbene Containing Liquid Crystalline Polymers ... 22
1.2.3 Theoretical Concerns Relating to the Odd-Even Effect ... 27
1.3 Characterization of Main Chain Thermotropic Liquid Crystalline Polymers ... 29
1.3.1 Identification of Liquid Crystalline Phases ... 29
1.3.2 Crystallization Kinetics and Crystalline Structure ... 31
1.4 Objective and Overview of This Research ... ... 33
Chapter 2: Crystallization Studies and Monotropic Liquid Crystalline Behavior of HMS Polycarbonates ... ... 36
2.1. Introduction ... ... 36
2.2.1 M aterials ... ... 38
2.2.2 Differential Scanning Calorimetry (DSC) ... 38
2.2.3 Optical Microscopy ... 40
2.2.4 Transmission Electron Microscopy (TEM) ... 40
2.3 R esults ... ... 41
2.3.1 Differential Scanning Calorimetry (DSC) ... 41
2.3.2 Optical Microscopy ... 61
2.3.3 Transmission Electron Microscopy (TEM) ... 61
2.4 D iscussion ... ... 63
2.4.1 Relationship Between Transition Temperatures and Flexible Spacer Number ... ... 63
2.4.2 Crystal Formation ... 67
2.5 Conclusions ... 70
Chapter 3: Structure Development in HMS Polycarbonates by Wide Angle X-ray Scattering (WAXS) ... 71
3.1. Introduction ... 71
3.2. Experimental Section ... 72
3.2.1 Reflection Mode WAXS ... 72
3.2.2 WAXS Fiber Analysis ... 72
3.2.3 Molecular Modeling ... 73
3.3 R esults ... 73
3.3.1 Reflection Mode WAXS ... 73
3.3.2 WAXS Fiber Analysis ... 78
3.3.3 Molecular Modeling ... 87
3.4 Discussion ... 92
Chapter 4: Structure Development in HMS Polycarbonates by Small Angle
X-ray Scattering (SAXS) ... 98
4.1. Introduction ... ... 98
4.2. Experimental Section ... 99
4.3 Results and Discussion ... 101
4.3.1 Room Temperature SAXS ... 101
4.3.2 Real-time SAXS during Cooling and Heating ... 104
4.3.3 Real-time SAXS during Isothermal Crystallization ... 119
4.4 Conclusions ... 123
Chapter 5: Characterization of DMS Polycarbonates and Comparison between HMS and DMS Polycarbonates ... 124
5.1. Introduction ... 124
5.2. Experimental Section ... 125
5.2.1 M aterials ... 125
5.2.2 Differential Scanning Calorimetry ... 125
5.2.3 Wide Angle X-ray Scattering ... 126
5.2.4 Small Angle X-ray Scattering ... 127
5.3 R esults ... ... 128
5.3.1 Differential Scanning Calorimetry ... 128
5.3.2 Wide Angle X-ray Scattering ... 137
5.3.3 Small Angle X-ray Scattering ... 144
5.4 Discussion ... 154
5.5 Conclusions ... 156
Bibliography ... 161
List of Figures
Figure 1.1 The type of ordered structures that LCPs form ... 15
Figure 1.2 Possible topologies (molecular arrangements) about point singularities ... ... 15
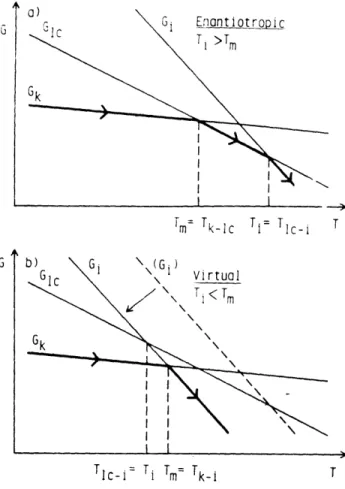
Figure 1.3 The diagram of the free energy vs. temperature used to explain (a) the enantiotropic mesophase, (b) the virtual mesophase ... 19
Figure 1.4 The diagram of the free energy vs. temperature used to explain the monotropic mesophase ... ... 20
Figure 1.5 Chemical structure of stilbene containing polymers ... 23
Figure 1.6 The diagram of Tm and Tlc-i vs. the number of -(CH2)- units in the spacer for a homologous series of a-methyl stilbene polyesters ... 26
Figure 1.7 X-ray diffraction patterns of aligned nematic polymers ... 30
Figure 1.8 Mesogen - spacer packing in (a) intermeshed, (b) layered structure ... ... 32
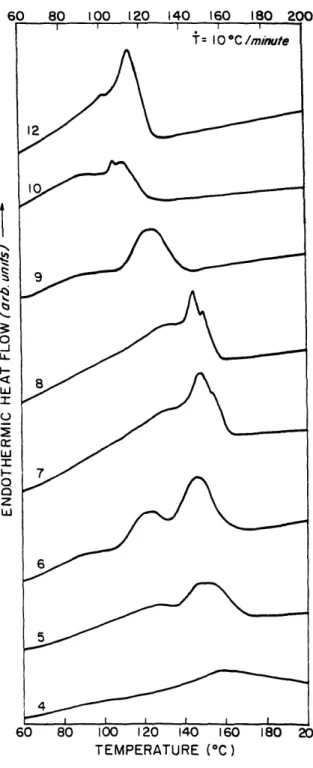
Figure 2.1 DSC thermograms of HMS-4-10,12 at 100C/min cooling ... . 42
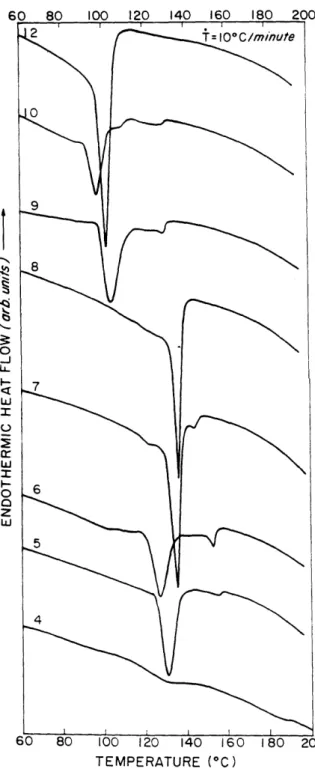
Figure 2.2 DSC thermograms of HMS-4-10,12 at 100C/min heating ... 43
Figure 2.3 Transition temperatures vs. n during cooling ... 45
Figure 2.4 Transition temperatures vs. n during heating ... . 45
Figure 2.5 DSC thermograms of HMS-9 at various cooling rates ... 48
Figure 2.6 DSC thermograms of HMS-8 at various cooling rates ... 49
Figure 2.7 DSC heat flow vs. time, during isothermal crystallization of HMS-9 at (a) 108'C and (b) 1200C ... . 52
Figure 2.8 Immediate rescan DSC thermograms of HMS-9 at 50C/min heating rate after isothermal crystallization at the temperatures shown ... 56 Figure 2.9 Immediate rescan DSC thermograms of HMS-9 after
isothermal crystallization at 1 140C for 4.68 minutes. ... 59 Figure 2.10 Immediate rescan of HMS-9 at 50C/min heating rate after
isothermal crystallization at 114 OC for the indicated times ... 60 Figure 2.11 Optical micrograph of HMS-5 crystallized at 1270C for 40 minutes.
(a) Sample annealed at 1570C for 40 minutes prior to crystallization
at 1270C. (b) Sample cooled directly to 1270C without annealing ... 62 Figure 2.12 TEM micrograph of HMS-5 annealed at 1570C for 30 minutes
and then air-cooled ... 64 Figure 3.1 WAXS intensity versus two theta for HMS-4-10, -12 ... 74 Figure 3.2 Interplanar spacing, d, versus flexible spacer number, n,
for the two major interchain reflections shown in Figure 3.1 ... 75 Figure 3.3 Flat film WAXS of hand drawn raw fibers:
(a) HMS-5, (b) HMS-8. Fiber axis is vertical ... 76 Figure 3.4 WAXS of hand drawn annealed fibers:
(a) HMS-5 experimental pattern, (b) Sketch of HMS-5 pattern,
(c) HMS-8 experimental pattern, (d) Sketch of HMS-8 pattern ... 79 Figure 3.5 Projections of model unit cell of HMS-5.in the:
(a) a-b plane, (b) a-c plane, (c) b-c plane ... . 89 Figure 3.6 Model repeat unit structures for HMS-n: (a) HMS-5, (b) HMS-6 ... 91 Figure 3.7 Disposition of the corner and center chains of the unit cell,
viewed in projection in the b-c plane for HMS-7 ... 93 Figure 3.8 (a) HMS-7, and (b) HMS-8, projection view along the c-axis ... 96 Figure 4.1 Lorentz corrected SAXS intensity vs. scattering vector s at room
temperature for HMS-5 cooled at -50C/min from the melt... 102
Figure 4.2 One-dimensional electron density correlation function, K(z) vs. z:
(a) schematic plot, (b) HMS-5 at room temperature ... 103 Figure 4.3 (a) Lamellar thickness and (b) linear crystallinity vs. n ... 106
Figure 4.4 DSC thermograms of HMS-5 and 6 at 50C/min cooling rate ...
107 Figure 4.5 (a) Lorentz corrected SAXS intensity vs. s for HMS-5 during cooling
at -50C/min from the melt. (b) One-dimensional electron density
correlation function for HMS-5 at several temperatures ... 109 Figure 4.6 (a) Long period, (b) lamellar thickness, and (c) linear crystallinity
vs. temperature for HMS-5 and 6 during cooling at -50C/min ... 110
Figure 4.7 DSC thermograms of HMS-5 to 9 at 50C/min heating rate ... 114
Figure 4.8 (a) Lorentz corrected SAXS intensity vs. s for HMS-6 during heating at -50C/min from the melt. (b) One-dimensional electron density
correlation function for HMS-6 at several temperatures ... 115 Figure 4.9 (a) Long period, (b) lamellar thickness, and (c) linear crystallinity
vs. temperature for HMS-5-8 during heating at 50C/min ... 116
Figure 4.10 (a) DSC exothermic heat flow vs. time during isothermal crystallization, (b) Lorentz corrected SAXS intensity vs. time
at s = 0.0025, for HMS-5 at 1400C ... 120 Figure 5.1 DSC thermograms of DMS-7 and HMS-7 at 100C/min
(a) cooling and (b) heating ... 129 Figure 5.2 DSC thermograms of (a) HMS-7 and (b) DMS-7
at various cooling rates ... 133 Figure 5.3 The time to maximum heat flow vs. temperature of (a) DMS-7
and (b) HMS-7 ... 135 Figure 5.4 WAXS intensity versus two theta for DMS-7 ... 138 Figure 5.5 Flat film WAXS of hand drawn raw fibers:
a.) HMS-7, b.) DMS-7 ... 139 Figure 5.6 WAXS of hand drawn annealed fibers: a.) HMS-7, b.) DMS-7 ... 141 Figure 5.7 Lorentz corrected SAXS intensity vs. s at room temperature for
Figure 5.8 One-dimensional electron density correlation function, K(z) vs. z:
(a) DMS-7, (b) HMS-7 at room temperature ... 146 Figure 5.9 (a) Real-time Lorentz corrected SAXS intensity vs. s,
(b) one-dimensional electron density correlation function,
for DMS-7 isothermal crystallized at 1240C ... 148 Figure 5.10 Schematic presentation of the SAXS fiber pattern ... 151
Figure 5.11 Schematic presentation of the paracrystalline fibrillar model, proposed by Hosemann. (a) Single row of microfibrils.
(b) Part of a layer of crystalline blocks ... 151 Figure 5.12 SAXS intensity of the meridian section vs. s for annealed fiber,
(a) DMS-7 at 1250C, (b) HMS-7 at 1080C ... 152
Figure 5.13 One-dimensional electron density correlation function for annealed
List of Tables
Table 2.1 Thermal Transition Peak Temperatures for HMS Series
Polycarbonates at 100C/minute Scan Rate ... 44
Table 2.2 Estimated AHi-lc and AHlc-k for HMS Series Polycarbonates at 100C/minute Scan Rate ...
... 46 Table 2.3 Onset Temperatures of Transitions of HMS-6 Through 9
at Different Cooling Rates ... ... 50
Table 2.4 Time to Maximum Exothermic Heat Flow (minutes) as a Function
of Crystallization Temperature for HMS-5 through 8 ... 53 Table 2.5 Crystallization Time (minutes) as a Function of Crystallization
Temperature for HMS-5 through 8 ... 54 Table 2.6 Time to Maximum Heat Flow and Crystallization Time (minutes)
as a Function of Crystallization Temperature for HMS-9 ... 55 Table 2.7 Infinite Crystal Melting Point and Thickening Factor.
for HM S-5, 6, 8 and 9 ... 58 Table 3.1 Experimental and Model Crystallographic Parameters of
a Crystal Unit Cell of HMS-5 ... ... 83 Table 3.2 Experimental and Model Crystallographic Parameters of
a Crystal Unit Cell of HMS-6 ... ... 84 Table 3.3 Experimental and Model Crystallographic Parameters of
a Crystal Unit Cell of HMS-7 ... ... 85 Table 3.4 Experimental and Model Crystallographic Parameters of
a Crystal Unit Cell of HMS-8 ... 86 Table 3.5 Crystal Lattice Parameters of HMS-5-8 ... 90 Table 4.1 Long Period, Linear Crystallinity and Lamellar Thickness
from Melt to Room Temperature ... 107
Table 4.2 Long Period, Linear Crystallinity and Lamellar Thickness
for HMS-5-8 Isothermally Crystallized at 1400C ... 121
Table 4.3 Monomer Repeat Unit Length and Estimated Number of Monomer
Repeat Unit in Crystal Lamellae for HMS-5-8 ... 121 Table 5.1 Thermal Transition Peak Temperatures for DMS Series
Polycarbonates at 100C/minute Scan Rate ... 133
Table 5.2 Infinite Crystal Melting Point and Thickening Factor
for HMS-7 and DMS-7 ... 136
Table 5.3 Experimental and Calculated Crystallographic Parameters
of a Crystal Unit Cell of DM S-7 ... 143 Table 5.4 Long period, Linear Crystallinity and Lamellar Thickness
for Crystallized DMS-5-8 and HMS-7 Cooled at 50C/min
from Melt to Room Temperature ... 147 Table 5.5 Long period, Linear Crystallinity and Lamellar Thickness for
Chapter 1
Introduction and Background
1.1
OVERVIEW
1.1.1 Introduction to Liquid Crystalline Polymers and Definitions
Liquid crystalline polymers (LCPs) may exhibit liquid crystalline order either as a function of concentration in solution (lyotropic LCPs) or as a function of temperature in the melt (thermotropic LCPs). The type of ordered structures that liquid crystalline polymers form may be represented as shown in Figure 1.1 [1]. Traditionally, the thermotropic liquid crystalline phase exhibited by small molecular rod-like mesogens can be classified as nematic, cholesteric, smectic A (an untilted nematic) or smectic C (a tilted layer). Disk-like molecules exhibit various discotic liquid crystalline phases.
These ordered liquid crystalline structures give birefringent melts and solutions when observed under crossed polarizers. As with small-molecule liquid crystals the most simple polymeric liquid crystal phase is the nematic phase. The molecule chain axes mutually align in relation to a simple director without long range positional order which might contribute to a crystal lattice. Schlieren texture is a characteristic of the nematic phase. When viewed between crossed polarizers, this texture shows an irregular network of black brushes branching out from a number of scattered points and passing continuously from one point to another. They correspond to extinction positions of nematic mesophase. These points are the intersections of vertical lines of singularity with the glass surfaces [2,3]. Possible topologies (molecular arrangements) about point singularities are given in Figure 1.2 [4]. Disclinations are point or line defects within a mesophase of a liquid crystalline sample. The strength of the disclination, S, is connected with the number of dark brushes meeting at one point [4]:
S
~v 1JIF~rC
he typef orered uctures that
... •tic
A
(top) andsmeetic
S
(b).
i figuie e
(iuetaken flrom
S=-/2
','/ X~? Ill $ws' s~Ipossible topoogies (olecula arrangement) about point singularities. (Figure taken fromRef. 4, Figu
(~i5gutere21' Figure I.1 FigUre 1.2
r
~ ~ ~n r r al
e
l) s tv1
l l-
d
-)
I t SS1 SI1S.1
. . ... .... .I S I = number of brushes / 4
From the observation of singularities with S= +1/2, the mesophase can be identified as a nematic phase. By electron microscopy using a decoration technique [51, disclination structures can be also observed.
One of the major commercial interests in LCPs is their processibility to form uniaxially oriented fibers (for example, see Ref. 1, P. 41). Because of the high chain continuity in oriented LCPs, a desired high stiffness and tensile strength can be achieved along the chain alignment direction. Melt processing is one of the easiest processing methods for thermotropic LCPs . Thermotropic LCPs can be simply extruded from the molten liquid crystalline state to form highly oriented fibers. LCPs can be blended with other polymers to improve processibility and to form high strength composites. One of the characteristics of an LCP fiber is its low coefficient of thermal expansion, which can meet the needs of dimensional stability and reduction of internal stress during cooling. Commercially, LCP fibers are generally more expensive than other fiber materials.
1.1.2 Review of the History of Liquid Crystalline Polymers
The history of LCPs started in 1956 when Flory published a paper on
concentrated polymer solutions [6]. The lattice theory of Flory is applicable for quantitative treatment of phase separation phenomena in solutions of rodlike chain polymers, including melts [7-9]. The theory predicted that at a critical concentration Vp*, athermal solutions of polymer hard rods (no intermolecular attractions) of axial ratio x (length/diameter) show initiation of a stable anisotropic or liquid crystalline phase, i.e.,
Vp* = (8/x)[1-(2/x)] (2)
As the axial ratio of the polymer rod drops approaching to 6.4, the polymer composition of the isotropic phase and the liquid crystalline phase both get close to 1, which is undiluted. Therefore, for an undiluted system, which is thermotropic, the ordered liquid crystalline phase will always be stable with respect to the isotropic phase if the axial ratio of the rod exceeds 6.4. However, this ratio is obtained by considering only the repulsive, shape dominated, forces between the molecules.
Incorporation of possible directional attractive forces makes it possible that polymer rods of lower axial ratio can have a liquid crystalline phase. Groups in polymer chains with polarizabilities higher along their bond axes than along the perpendicular can contribute to the stability of the liquid crystalline phase. Examples of such groups are p-phenylene, -CEC-, -N=N-, and -C=N-. These interactions are important in semiflexible long-chain polymers. Therefore, high axial ratio is not required for liquid crystalline phase formation in the melt. The nature of the liquid crystalline phase appears to be dependent totally on the shape of the monomer unit. For example, consider the structure
[10,11] shown below:
+ CONH - Ph - COO(CH ),OOC - Ph - HNOC - (CH2),m ,dp
These are polyesteramides having a smectic liquid crystalline phase for specific values of n and m. It is very likely that intermolecular hydrogen bonding plays an important role. In this case, strong interactions compensate for a weak steric drive to the liquid crystalline phase.
1.1.3 Introduction to Monotropic Liquid Crystalline Behaviors
In the polymer melt (the thermotropic system), how does the liquid crystalline phase stabilize as opposed to the crystal phase and the isotropic phase? In 1956 Flory
tried to answer this question [6]. As mentioned above, for rodlike chains, when a limiting concentration is exceeded, either a liquid crystalline phase or a crystalline phase separates from the isotropic phase. Crystallization may happen in two steps: 1) the polymer chains order cooperatively in a given region into a parallel alignment without change in the intermolecular interactions; and 2) the increase in intermolecular interactions is possible by the more efficient packing of the chains in the parallel state. The first step is similar for both the crystallization process and the formation of liquid crystalline phase. The second step is separation of a crystalline state or a liquid crystalline phase. With extensive chain alignment and good chain regularity, crystallization should proceed so fast that the two steps are inseparable.
Recently, from a thermodynamic point of view, the liquid crystalline phase can be identified to be either enantiotropic or monotropic [12,13]. The thermodynamic relation required is:
dG = VdP - SdT (3)
where G is the free energy, V is the volume, S is the entropy, P is the pressure and T is the temperature. Assume the phase transition happens at a constant pressure (dP = 0) . The free energies of the crystal (Gk), liquid crystal (Glc), and isotropic (Gi) phases decrease with increasing temperature. The decrease of Gi (dGi/dT) is steeper than Glc and Gk, because
Si > Sic > Sk. (4)
As shown in Figure 1.3(a) (taken from Fig.1 of Ref.12), the enantiotropic liquid crystalline phase is thermodynamically stabilized with respect to the crystalline phase and
G1
Tm= Tklc Ti= TIC1 T
G
Tc-i = Tii m= Tk-i T
Figure 1.3 The diagram of the free energy vs. temperature used to explain (a) the enantiotropic mesophase, (b) the virtual mesophase. (Figure taken from Ref. 12, Figure 1)
I
Tm=
Tklc Ti= TIc i T
0
Tic-k
T-,Tk-_,
T
Figure 1.4 The diagram of the free energy vs. temperature used to explain the monotropic mesophase. (Figure taken from Ref. 13, Figure 2)
the isotropic phase within the temperature range from Tm (Tk-lc) to Ti (Tic-i). It is observed as reversible both on heating and on cooling. As shown in Figure 1.3(b). the virtual liquid crystalline phase is thermodynamically less stable than the crystalline phase and the isotropic phase. The monotropic liquid crystalline phase is a particular case of a virtual mesophase, which can only be observed on cooling, provided that the crystallization process is by-passed due to supercooling. Particularly in polymers, crystallization only happens at a certain supercooling temperature and the crystallization temperature can be appreciably below the equilibrium melting point. In contrast, the formation of liquid crystalline phase generally requires less supercooling. As shown in Figure 1.4 (taken from Fig.2 of Ref.13), an unstable or monotropic liquid crystalline phase can exist from Ti-lc to Tlc-k' in cooling. As temperature drops further, crystallization will happen and the free energy may drop to the value of the perfect crystal Gk. During reheating, the perfect crystal melts directly into isotropic liquid at Tk-i.
It is possible that the free energy only drops in between two extremes, Gk and Gk'. If the free energy remains at a value above Gkc after crystallization, the liquid crystalline phase still can be seen during reheating. Then this liquid crystalline phase can be classified as enantiotropic. Therefore, it is possible that the improved perfection of crystals upon annealing can make this kind of enantiotropic liquid crystalline phase into a
monotropic liquid crystalline phase.
1.2 OVERVIEW OF MAIN CHAIN THERMOTROPIC LIQUID CRYSTALLINE POLYMERS
1.2.1 Introduction
It is helpful to view liquid crystalline polymers as being constructed from the same rigid mesogenic groups that form small-molecule liquid crystals. The most basic
construction is to link the rigid mesogenic groups end to end to form a rigid polymer chain, which is the rigid rod polymer, as mentioned in 1.1.2. However, in practice this approach leads to a problem: although Tm and Tlc-i are both increased as a result of the polymerization, and the range of mesophase stability is in principle maintained or even enhanced, thermal degradation of the polymer tends to curtail this range and often prevents the liquid crystalline phase from being observed.
Therefore, the reduction of the transition temperature into an useful working range without destroying the liquid crystalline stability completely is one of the primary objectives in the design of LCPs. One route to make the chain less stiff is to introduce more mobile linking groups between the rigid units. A further modification involves the connection of the mesogenic units through spacers consisting of lengths of flexible polymer molecules. Such flexible spacers may be incorporated between the mesogenic groups to give a single linear molecule, which is used to form the so-called main chain LCPs. Or a flexible polymer chain can be used as a backbone to which the mesogenic sections are added as side groups, which is used to form side chain LCPs.
Insertion of substituents on the mesogen can modify its steric and electronic features [14-22], and therefore its potential as a mesogen. The steric factor generally plays a more important role for LCPs, which is also the case for small monomeric liquid crystals [18]. The lateral substituents usually reduce the thermal stability of the liquid crystalline phase.
1.2.2 Stilbene Containing Liquid Crystalline Polymers
Main chain thermotropic LCPs with various kinds of mesogens have been studied [23-47]. Stilbene-containing polymers have been widely studied due to the low cost of the monomer. Various linking groups that link the methylene spacer and the stilbene
a-methyl
stilbene polyester
CH
3
O
O
-CO
I
I I
II
;C
OC
-(CH
2)n-CO
H
c-methyl stilbene polyether
CH
3C --
-O-(CH
2)n-O
HC
a-methyl
stilbene polycarbonate (HMS-n)
Cl
C
CI
0
II
(CH
2 )nn-OCO
I
Ha,3-dimethyl
stilbene polycarbonate (DMS-n)
CH
3O
O
c=c
cO
O-(CH
2,)-OCO
CH
3a-ethyl
stilbene polycarbonate (HES-n)
CH
2CH
3O
O
CCQ
OCO
O-(CH
2)n-OCO
H
a,3-diethyl
stilbene polycarbonate (DMS-n)
CH
2CH
30
O
SCOCO-(CH
2)n-OCO
CH
2CH
3mesogen have been studied. Figure 1.5 shows the chemical structure for stilbene-containing polymers. Jackson's [48] stilbene polyesters were reported in the 1980's as high melting enantiotropic LCPs. These polyesters can produce reasonably high strength fibers and injection molding plaques. Polyesters of a-methyl stilbene [49] were found to melt at temperatures similar to Jackson's polyesters and were also enantiotropic LCPs. Percec's a-methyl stilbene polyethers [50] were reported to be lower melting enantiotropic LCPs of stilbene which can exhibit a nematic or smectic liquid crystalline phase. Like other main chain thermotropic LCPs, for these stilbene LCPs, both their melting temperature, Tm (Tm = Tk-lc), and their transition temperature from the liquid crystalline phase to the isotropic phase, Ti (Ti = Tic-i), tend to decrease with increasing
length of flexible spacer. Figure 1.6 is a plot of both Tm and Tlc-i vs. the number of -(CH2)- units in the spacer for a homologous series of polyesters of a-methyl stilbene [14,49]. The zig-zag nature of the plots is an example of the odd-even effect, which was seen in all of the stilbene-containing polymers mentioned above. Both transition temperatures tend to be higher when there is an even number of -(CH2)- units in the flexible spacers. Also notice that the temperature range for liquid crystal stability decreases with increasing length of the spacer. At n=12, Tlc-i first drops below Tm and the stability of the liquid crystalline phase is lost.
Insertion of a second substitution has a drastic depressive effect on Ti that causes
a, B dimethyl stilbene polyesters not to have an enantiotropic liquid crystalline phase.
For example, the a-methyl stilbene liquid crystalline polyester with -(CH2)8- flexible spacer has a melting point of 483K and isotropic temperature of 530K, while the a, 8 dimethyl stilbene polyester with the same flexible spacer has a melting temperature of 500K and a virtual liquid crystalline phase at Ti=454K [21]. In this work, no odd-even effect is discussed because of the limited flexible spacer number.
560 520 T (K) 480 440 6 8 10 12 n
Figure 1.6 The diagram of Tm and Tlc-i vs. the number of -(CH2)- units in the
spacer for a homologous series of a-methyl stilbene polyesters. (Figure taken from Ref. 14, Figure 4)
Expanding on the past work with stilbene-based polyesters and polyethers, a series of polycarbonates have been synthesized by Dr. Schreuder-Gibson with stilbene mesogen, mono- or di- substituted with methyl or ethyl groups, which are referred to as HMS-n, DMS-n, HES-n, DES-n, respectively [51]. Their chemical structures are shown in Figure 1.5. For stilbene polycarbonates containing the heptane flexible spacer, methyl substituted stilbenes (HMS-7 and DMS-7) are semicrystalline, while ethyl substituted stilbenes (HES-7 and DES-7) are amorphous [51].
1.2.3 Theoretical Concerns Relating to the Odd-even Effect
The odd-even effect can be easily understood by considering that the degree of alignment of the polymer chains within the mesophase is higher for the even series than for the odd series, when the methylene units in the flexible spacer have all trans conformation [52]. Although the methylene spacer has been found not to be restricted to the all-trans conformation in the anisotropic phase, its conformation is rather extended [53-57]. An all-trans sequence will only connect two mesogenic groups without introducing a kink in a polymer chain if it has an even number of methylene units. However, there are some theoretical bases which can explain the odd-even phenomenon
[58-61].
Conformational energy calculations [58-61] have pointed out that the methylene spacer length and the linking group both have influence on the conformation of the methylene spacer. Three contributions to the total partition function, ZT, can be considered:
ZT = Zst Zen Zconf (5)
orientation-dependent contribution, and Zconf takes care of the configurational degree of freedom.
When the methylene flexible spacer (F) is attached to the mesogen (M) by M-O-F or M-O(O=)C-F linkage, the even-numbered methylene spacers have a significant population of highly extended conformations which makes the nearly parallel alignment of the mesogen along the macroscopic orientation axis favorable. These conformers help to promote a stable nematic phase and are most likely preferred over others in the nematic phase. The conformational energy and entropy change of the methylene spacer contributed from these conformers can significantly increase the enthalpy and the entropy change of the transition from the isotropic phase to the nematic phase. It has been found experimentally that the enthalpy and entropy changes of the isotropic-nematic transition for these polymers are much larger than those of the monomeric liquid crystal [26,301. In contrast, for an odd-numbered methylene spacer, the number of highly extended conformers is much smaller. For these conformations, the mesogen is tilted by about 300 from the macroscopic orientation axis and the order parameter is smaller. (The order parameter can be defined as 1 - (1.5*< sin2
4
>), where 0 is the angle between a chainsegment and the macroscopic orientation axis). Therefore, the enthalpy and entropy change from the isotropic to nematic transition are much smaller for these polymers with odd-numbered methylene spacer than those with even-numbered one, as experimentally observed [23,26,30,49,62,63].
Interestingly, it has been found experimentally that when the the methylene flexible spacer (F) is attached by M-C(O=)O-F linkage, the tendency to form a nematic phase is significantly suppressed [16,32]. When a nematic phase occurs, the enthalpy and entropy change of the isotropic-nematic transition is larger for these polymers with odd-numbered methylene spacer than those with an even-odd-numbered one [42]. From the conformational energy calculation, it is found that for these polymers with
even-numbered methylene spacer, the population of extended conformers is smaller than those polymers having a M-O-F or a M-O(O=)C-F link. It is ascribed to the fact that the trans conformation of O-C-C-C bonds is not the lowest energy conformation for the polymers having a M-C(=O)O-F link. Therefore, the enthalpy change of the isotropic-nematic transition is reduced for these polymers with even-numbered methylene spacer and the odd-even effect is reversed.
1.3 CHARACTERIZATION OF MAIN CHAIN THERMOTROPIC LIQUID CRYSTALLINE POLYMERS
1.3.1 Identification of Liquid Crystalline Phase
It is recommended to use various methods to identify the liquid crystalline phase in LCP systems because the coexistence of phases might obscure the observation under polarized optical microscopy at different temperatures. For example, when LCPs are oriented by shearing, a shear band structure might be observed under polarized optical microscopy and electron microscopy [64-66]. It is believed that the formation of the shear band is caused by the stress relaxation of polymer chains from the oriented state, which results in periodic thickness change. Recently, it was found that crystallization can also lead to the formation of banding morphology [67]. The banding was caused by the periodic buckling of polymer chains in the crystalline phase.
Two dimensional wide angle X-ray diffraction is also a popular method for the identification of liquid crystalline phases. The X-ray diffraction patterns of aligned nematic polymers will look similar to that shown in Figure 1.7 [52]. The important features which characterize the nematic structure are the presence of diffuse equatorial maxima, and sometimes layer lines which are centered on the meridian and diffuse along their length [68]. The existence of any sharp maximum is indicative of certain type of
.I'
Equator
j
Figure 1.7 X-ray diffraction patterns of aligned nematic polymers.
(Figure taken from Ref. 52, Figure 2.5)
30
long range positional order, such as occurs in smectic structures or crystals, and will take the polymer out of the nematic classification. However, nematic polymers may be partially crystalline, and in that case sharp diffraction features or distinctly quadrantal reflections will then be superimposed on a basic nematic pattern.
1.3.2 Crystallization Kinetics and Crystalline Structures
Many crystallization studies of thermotropic LCPs have been done by using a differential scanning calorimeter (DSC). Typically, two kinds of studies were executed. First, many studies used several different cooling rates to try to find out the effect on the exotherm peak of crystallization and the isotropic to mesophase transition. This approach is especially useful for the study of a monotropic system [69]. The exotherm of crystallization is so suppressed by a higher cooling rate that the isotropic to mesophase transition is observable.
In the second study, the DSC was also used to study the isothermal kinetics of the mesophase formation and of the crystallization from the mesophase or isotropic state. Ideally, if the resolution of data is high enough in the beginning of crystallization, one can determine the Avrami parameter. The general results present some controversial points about the mechanism of the transformation and the resulting Avrami parameters [70]. Parallel studies of polarized optical microscopy and real time wide angle X-ray scattering (WAXS) are usually done. From these studies, it is generally suggested that crystallization from the liquid crystalline phase can preserve the local orientation in the crystalline phase.
By using two dimensional wide angle X-ray diffraction techniques, some packing principles of main chain LCPs in the crystalline phase are proposed by Ungar and Keller
Fibre axis
mesogen
spacer-a
b
Figure 1.8 Mesogen -spacer packing in (a) intermeshed,
structure, the rigid mesogen with bigger cross section matches the flexible spacer on adjacent polymer chains. In a "layered" structure, the rigid mesogen and the flexible spacer are coupled themselves in seiies on adjacent polymer chains. The "intermeshed" structure seems more stable thermodynamically because it will transform into the
"layered" structure by an endothermic reaction.
A detailed study of the influence of the flexible spacer on the solid state structure has been made [72] for a series of mesogenic aromatic-aliphatic azomethine ether polymers (AZMEP-n), with methylene spacers number n =1-16. Unit cell parameters determined from the fiber patterns of annealed single filaments have been used to classify the polymers into distinct groups having different chain conformations and crystal systems. The even members of the series have C-centered monoclinic, I-centered monoclinic or triclinic unit cells changing with the increase of the length of spacer. When n is odd, the unit cells are orthorhombic, I-centered monoclinic or triclinic changing with the increase of the length of spacer.
1.4 Objective and Overview of This Research
Main chain LCPs have potential uses as high strength fiber forming materials because of their tendency to form ordered phases from the isotropic phase. Main chain LCPs can be extruded from the liquid crystalline state and form an extended chain structure in the solid state, which has high chain continuity and therefore high mechanical properties along the orientation direction. Generally, the wider the temperature range of stability for the liquid crystalline phase, the better the fiber forming capability for the LCP during melt processing. In our research, we incorporate the methylene flexible spacer in the LCP structure, which is connected with the stilbene mesogen by the carbonate linking group. This is a popular approach as mentioned in 1.2.1, because the
incorporation of the methylene spacer can lower transition temperatures and therefore ease the melt processing.
The purpose of this research is to investigate the relationship between the chemical structure variations and the macroscopic properties like thermal transition temperatures, crystallization kinetics, and fiber formation. The chemical variations include change in the methylene flexible spacer length, substitution on the mesogen and linking group chemistry. As mentioned in 1.2.2, it has been found both HMS and DMS polycarbonates are semicrystalline. Therefore, in this research, we are concentrating on these two groups of materials, especially on HMS polycarbonates. In our research, we are able to determine the role of the chemical variations on the thermodynamic stability of the liquid crystalline phase and in the nucleation kinetics and growth of the crystalline phase.
For our liquid crystalline a-methyl stilbene polycarbonates, there is a very narrow temperature range of stability for the liquid crystalline phase. The liquid crystalline phase can be only observed during cooling when three dimensional crystal growth is suppressed. Using wide angle X-ray scattering and molecular modeling, we show that the orientation of the carbonate group and the length of the methylene flexible spacer are both implicated in the rapid nucleation of crystals. When the length of the methylene spacer and the mesogen are comparable, a regularly packed crystal structure occurs in which the mesogen (M) and the flexible spacer (F) align as shown below:
-M-F-M-F-M-F-M-
-F-M-F-M-F-M-F-This crystal structure forms rapidly from the liquid crystalline phase which acts as a template for nucleation and growth of crystals from an already ordered melt.
Using small angle X-ray scattering, we found that the orientation of the carbonate group and the length of the methylene spacer are also related to the larger dimension of crystals forming from the liquid crystalline phase. ax-methyl stilbene polycarbonates with odd-numbered methylene spacer have a higher value of crystal lamellar thickness than those with even-numbered one.
The effect of the second methyl substituent on the mesogen for stilbene polycarbonates (DMS-n) is discussed in Chapter 5. In summary, the steric effect of the second methyl substituent lowers the stability of the liquid crystalline phase. The steric effect also reduces the effect of the carbonate group, and therefore DMS polycarbonates do not have the regular property change with the methylene spacer length as the HMS polycarbonates do.
Chapter 2
Crystallization Studies and Monotropic Liquid Crystalline
Behavior of HMS Polycarbonates
2.1. INTRODUCTION
It has been found that the monotropic mesophase exists in several kinds of main chain thermotropic liquid crystalline polymers, such as poly(ester imides) [69], polyurethanes [73,74], and polyethers and copolyethers [75-79]. It has also been found that some enantiotropic LCPs can behave like monotropic LCPs after an annealing process [80].
The behavior of these monotropic LCPs is strongly related to the shape of the monomer unit and the conformation of the polymer chain. One interesting characteristic is the existence of a kink in the polymer chain, which plays an important role in the interaction between the polymer chains. A kink can permanently exist in a polymer chain, as, for example, in polyurethane LCPs [73,74]. This particular kink is caused by two urethane linkages in the meta positions with respect to the benzene ring. Due to the interchain hydrogen bonding forming within the urethane linkage by adjacent polymer chains, these LCPs form an ordered monotropic mesophase. The order is preserved in the crystalline phase which forms from the mesophase. A kink can also exist in a polymer chain as one of the conformational isomers. Percec's liquid crystalline polyethers and copolyethers [75-79] are examples. Instead of being linked by a rigid group, two benzene rings are connected by two methylene linkages to form a flexible rodlike mesogen. The formation of the monotropic mesophase depends on the degree of alignment of polymer chains caused by their cooperative movement.
It is well-known that for main chain LCPs, both the mesogen and the flexible spacer contribute to the orientational order that characterizes the transition from the isotropic (i) phase to liquid crystal (Ic) mesophase. From the intercept and the slope of AHi-lc and ASi-lc versus the number of methylene units in the flexible spacer, Blumstein first obtained the contribution from the mesogen and the flexible spacer, respectively [81]. The former was assigned as the orientational contribution and the latter as the conformational contribution. Blumstein's polyesters showed an odd-even effect in AHi-lc and ASi-lc versus n, the number of methylene units in the flexible spacers [26,81]. The value is higher when n is even. This effect can be understood by considering that the degree of alignment of the polymer chains within the mesophase is higher for the even series than for the odd series, when the methylene units in the flexible spacer have all trans conformation [52,82]. This effect is usually observed and can be theoretically justified [58,59] for those polymers with rigid rod mesogen. However, for Percec's polyethers with flexible mesogen [79], AHi-lc and ASi-lc increase linearly with the number of methylene units in the flexible spacers. This phenomenon was explained by the coupled action of the flexible mesogen and the flexible spacer.
In this Chapter, we report on characterization and crystallization studies of cx-methyl stilbene polycarbonates (HMS-n) whose synthesis has been reported previously [51]. The chemical repeat unit for these polymers is shown in 1.2.2. The flexible spacer number ranges from n = 4-10, 12. A monotropic mesophase was identified for these HMS polycarbonates. Like some other monotropic LCPs mentioned above, HMS-polycarbonates also have kinks in their polymer chains caused by the conformational isomers of the carbonate linkage. If the two bonds adjacent to the carbonate linkage have trans conformation, then HMS polycarbonates will have a linear shape.
In this Chapter, we report on the crystallization and melting behavior of ox-methyl stilbene polycarbonates [51]. In contrast to the enantiotropic stilbene-based polyethers and polyesters, HMS polycarbonates are monotropic LCPs. Also, there is no odd-even effect seen in any of the transition temperatures vs. the flexible spacer number. Finally. there are different trends in the phase transition temperatures for n 5 8 compared with those of higher n value. These differences in thermal behavior can be related directly to differences in the chemical structure of the linking groups and to the relative lengths of the flexible spacer and mesogen.
2.2. EXPERIMENTAL SECTION
2.2.1 Materials
The synthesis of HMS polycarbonates was performed in Dr. Schreuder-Gibson's group [51] and followed the method of Sato [84]. The synthesis is described in the Appendix. The resultant LCPs were soluble in chloroform and obtained as fine white powders, except for n=7,9 which were obtained as white, very fibrous product. All polymers studied in this research have reasonably high molecular weight, in the range from 11,000 to 54,800 with distributions (Mw/Mn) close to 2 as reported previously [51].
2.2 Differential Scanning Calorimetry (DSC)
Thermal properties of materials were studied using a Perkin-Elmer DSC-4 or DSC-7. Indium was used to calibrate the temperature and the heat of fusion. All materials studied had a sample weight range of 2.5-6.5 mg. The studies that were done included heating and cooling at fixed rates, the effect of crystallization temperature on crystallization time and melting temperature, and the effect of crystallization time on melting temperature.
The first approach involved heating and cooling at fixed rates over a wide temperature interval. The sample was heated to 2000C and held at that temperature for
2.5-3 minutes, then cooled at a rate of 100C/min to 500C, then heated at 100C/min to
2000C. This study was done for all HMS-n samples. In addition, HMS-6 through 9 were
cooled and heated at 5, 20, and 500C/min. This study was designed to test the
dependence of the mesophase to isotropic transition on cooling rate.
The next study was isothermal crystallization for HMS-5 through 9. The sample was melted at 1900C for about 3 minutes, then quenched at -500C/min to a
crystallization temperature Tc and held isothermally until the crystallization was finished. The Tcs were specifically chosen for each HMS sample in advance. Because all HMS-5 through 8 materials have close crystallization temperatures, we chose the same crystallization temperatures in the range between 1380C and 1440C for these samples.
Exothermic heat flow as a function of time was measured. Here we were interested in the effect of the flexible spacer number on the isothermal crystallization kinetics.
The next study involved immediate rescan after isothermal crystallization for HMS-5, 6, 8 and 9. After staying at Tc isothermally until crystallization was finished, the sample was immediately heated at 50C/min to 1900C without cooling. This immediate
rescan technique avoids the formation of imperfect crystals during cooling to room temperature, and thus results in a cleaner endothermic response.
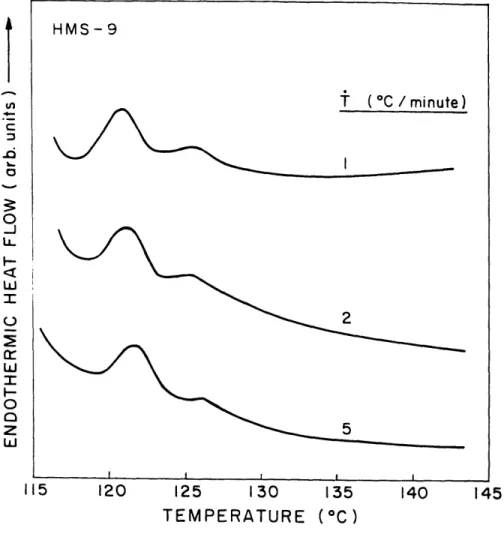
5 and 9 were studied by a variety of other thermal approaches. HMS-9 was held at Tc = 1140C and HMS-5 at Tc = 1400C until crystallization was finished,
then immediately heated at 1, 2, or 50C/min. Finally, the effect of crystallization time
was studied for HMS-9 at Tc =1140C and for HMS-5 at Tc = 1470C. Samples were held
heated at 50C/min to 1900C immediately, without cooling to room temperature.
2.2.3 Optical Microscopy
A Zeiss microscope was equipped with a turret containing long working distance
objective lenses, for use with the Mettler hot stage. The long working distance protects the lens from aberrations that might result from exposure to elevated temperatures. For HMS-n, samples of powder were placed on glass slides and covered with a glass cover slip. These were inserted into the hot stage at room temperature and the stage controller was set to heat and then cool the samples at a fixed rate. Samples were studied using polarized transmitted light geometry, and the analyzer was placed at 900 to the polarizer. The change in transmittance was recorded simultaneously as the sample heated.
Crystallization studies were done on HMS-5. The polymer was heated to 1900C and held at that temperature for 2.5 minutes, then cooled at 200C/min for isothermal crystallization to 1270C, the temperature of the mesophase to crystal transition of HMS-5.
Samples were also cooled at 200C/min from 1900C to 1570C, the transition temperature of the isotropic phase to mesophase transition, and held for 40 minutes, then cooled at 200C/min to 1270C for further isothermal crystallization.
2.2.4 Transmission Electron Microscopy (TEM)
TEM was performed on HMS-5, 7 and 9 using a JOEL 200CX transmission electron microscope operating at 200 KV. Samples were prepared by making a dilute solution of the polymer in chloroform. This was done by dissolving 1 mg of polymer in 2 ml of the solvent. Several drops of the polymer solution were then placed on a freshly cleaved mica surface that had been coated with a thin layer of carbon by thermal evaporation. The chloroform evaporated in about 1 minute leaving a thin film of polymer. The polymer on the mica was then subjected to heat treatment using a Mettler
hot stage. In all cases, the polymer was heated to 1900C and held at that temperature for
3 minutes. For HMS-5, cooling was done at -100C/min. with isothermal holding at
1570C for 30 minutes. The procedure was repeated with an isothermal hold at 127oC.
Cooling was also done for HMS-7 with isothermal holds at 1550C and at 1360C; and for
HMS-9 with holding at 1320C and at 1020C. After holding at the specified temperature,
the samples were removed from the hot stage and allowed to air-cool. The above temperatures correspond to peak temperatures of exotherms observed in a DSC cooling at -100C/min. That is, HMS-5, 7 and 9 were assigned isotropic-to-nematic transitions at 1570C, 1550C and 1320C, respectively, and nematic-to-crystalline transitions at 1270C,
1360C, and 1020C, respectively.
2.3. RESULTS
2.3.1 Differential Scanning Calorimetry
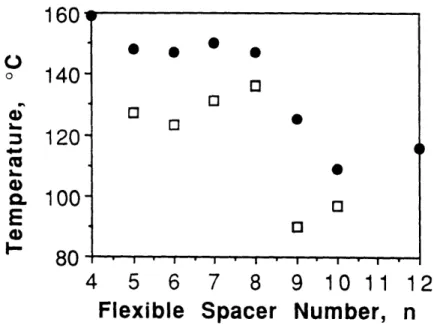
DSC thermograms of HMS-4-12 are shown in Figures 2.1 and 2.2, for first cooling and second heating, respectively. Nearly all samples showed a dual exothermic response indicating a small higher temperature exotherm representing the isotropic to mesophase (i-lc) transition, followed by a large exotherm at the mesophase to crystalline (lc-k) transition. On the reheating scans, usually dual endotherms were observed. Notice that the upper melting temperature range is quite broad, and always covers the temperature range of the isotropic to mesophase transition seen in the cooling scan. Table 2.1 summarizes the melting and crystallization peak positions. Transition temperature vs. n is shown in Figure 2.3 (cooling) and Figure 2.4 (heating). There is only weak odd-even effect seen at the upper crystalline melting temperature in heating for low n, but no odd-even effect is seen in cooling. The stability range of the mesophase becomes smaller from n = 5 to 8 in the cooling scan. For n 2 9, all the transition temperatures drop. Table 2.2 lists the estimated AHi-lc and AHlc-k.
0 o -J I-LLJ w Il. 0 0 z LUJ Z Il. TEMPERATURE (0C)
Figure 2.1 DSC thermograms of HMS-4-10,12 at 100C/min cooling.
Ir
C I-Li. C. I-C c L TEMPERATURE (°C)Table 2.1
Thermal Transition Peak Temperatures for HMS Series Polycarbonates at 100C/minute Scan Rate
Sample Crystallization Temp.(oC) Melting Temp.(oC)
n Tc(upper) Tc(lower) Tm(upper) Tm(lower)
(±20C) ( 10 C) (±+1 C) (±o1C) 4 --- 129 159 5 156 132 148 127 6 154 128 147 123 7 144 135 150 131 8 --- 138 146 136 9 131 106 125 90 10 131 99 109 97 12 --- 104 116
4
5
6
7
8
9 10 11 12
Flexible Spacer Number,
Figure 2.3 Transition temperatures vs. n during cooling:
(0 ) Ti-l and (3) Tlc-k.
5
6
7
Flexible
8
9 10 11 12
Spacer Number,
Figure 2.4 Transition temperatures vs. n during heating: (e ) upper melting Tm2 and (1 ) lower melting Tml peak position.
0
a. 0 ._E
i,-,160
140
120
100
80
160
140
120
100
80
C.)
0 a)E
0, 0 O 0 0 034
" 80 1 I ITable 2.2
Estimated AHi-lc and AHlc-k for HMS Series at 100C/minute Scan Rate
Polycarbonates
Sample AHi-lc AHlc-k
n (KJ/mole) (KJ/mole) 4 ---- 0.6 5 0.1 4.3 6 0.2 2.5 7 0.2 4.4 8 ---- 3.6 9 0.6 5.6 10 0.3 4.5 12 ---- 7.8
Figure 2.5 shows DSC scans at cooling rates of 5, 10, 20, and 500C/min for
HMS-9. There is little change for the isotropic to mesophase transition temperature (indicated by an arrow) with the cooling rate, but the onset of crystallization is suppressed by higher cooling rate. Similar results were seen in HMS-6. The liquid crystalline phase transition is not affected much by this variation of cooling rate for these two samples. However, the formation of three dimensional crystals is greatly affected by the cooling rate due to the strong temperature dependence of the rate of formation of secondary nuclei.
In Figure 2.1, we were unable to observe the isotropic to mesophase transition for HMS-8, which we had expected to see at the front shoulder of the large crystallization exotherm, as was the case for HMS-5 through 7. Given the dependency of the crystallization exotherm on cooling rate, we used a high cooling rate to suppress the exotherm of crystallization causing it to occur at a lower temperature. Figure 2.6 shows DSC scans of HMS-8 at cooling rates of 5, 10, 20, and 500C/minute. At a cooling rate of
500C/min HMS-8 now clearly shows the mesophase transition as a shoulder on the high
temperature side of the crystallization exotherm. It is not seen at lower cooling rates because it overlaps with the crystallization phase transition and can not be separately identified. Similar effect of cooling rate was seen for HMS-7. The mesophase transition of HMS-7 can be observed at cooling rates of 50C/min to 500C/min (see Figure 2.1 for
100C/min) but disappears at a slow cooling rate of 20C/min. At this rate, the onset
temperatures of the transitions from the isotropic to crystalline phase is about 1430C.
Table 2.3 summarizes the onset temperatures of the transitions from the isotropic to mesophase (Ti-lc) and from the mesophase to crystalline phase (Tlc-k). All the heats of transition from the isotropic to mesophase are qualitatively the same with the cooling rates.
o _J LL U W I L-) 0 0 UL 60 80 100 120 140 160 180 200 TEMPERATURE (oC)
Figure 2.5 DSC thermograms of HMS-9 at various cooling rates.
t
u, wr
F-0 0 -J LL H w0 IH 0 0z
w TEMPERATURE (°C)Figure 2.6 DSC thermograms of HMS-8 at various cooling rates.
U 0: U 0 U H U U a; U SE o k U U a W C0 r-NoCI rj .E U H: S Cu Hkf 0
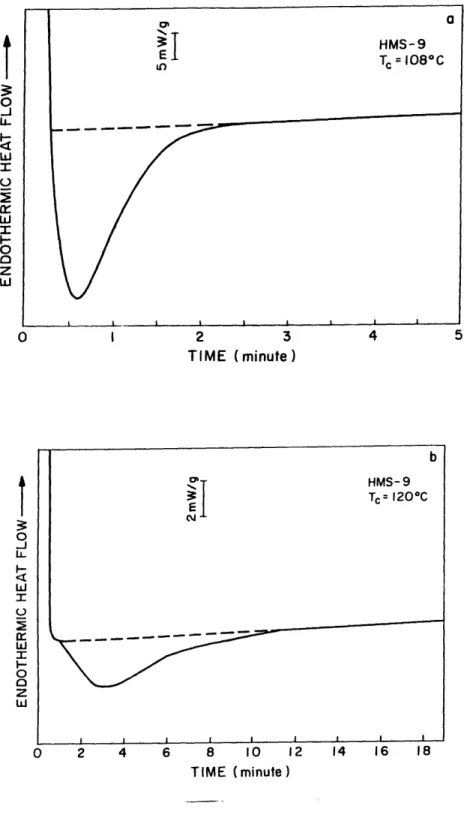
During isothermal crystallization, the crystallization time, tc, is the time after
which no further exothermic heat flow can be detected. As the crystallization temperature increases, the crystallization time increases, and the exothermic peak area decreases and finally becomes undetectable. Figure 2.7 shows the isothermal crystallization heat flow versus time for HMS-9 crystallized at 1080C and 1200C. As the
crystallization temperature increases, the crystallization kinetics become slower, and the area under the exothermic peak also becomes smaller. Tables 2.4 and 2.5 summarize the time to maximum exothermic heat flow and crystallization time as a function of the crystallization temperature from the isothermal study of HMS-5 through 8. Table 2.6
summarizes both the time to maximum exothermic heat flow and crystallization time as a function of the crystallization temperature for HMS-9.
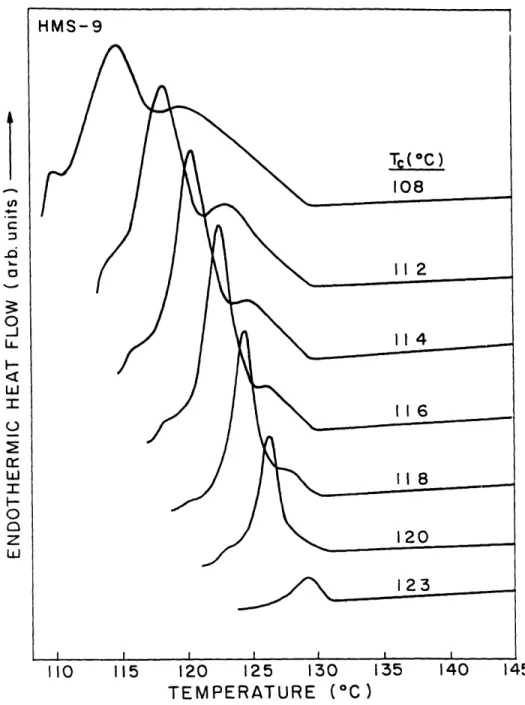
Figure 2.8 shows DSC scans of HMS-9 at a heating rate of 50C/min after staying
at the crystallization temperature isothermally until crystallization was finished. The sample is not cooled before scanning, therefore this technique is called an 'immediate rescan'. These thermograms represent the immediate rescans after isothermal crystallization at 108, 112, 114, 116, 118, 120 and 1230C. We can see that there are two major peaks in nearly all the immediate rescan endotherms. We will designate the lower one as Tm I and the upper one as Tm2, according to the peak position. Tm2 is broader and extends to the bottom of Tm 1. The area under Tm2 becomes smaller as the crystallization temperature increases. Finally, when crystallization temperature equals 1230C, only the lower peak remains. Also, the temperature range of Tm2 becomes smaller, and appears to have a fixed upper limit. We observed similar results for the DSC scans of HMS-5, 6 and 8. In each case, there are two endotherms, the upper one of which becomes relatively smaller as crystallization temperature increases.
:3
01
-.J LL I,1o
r IL I-0 0 z h LU I 2 3 4 5 TIME (minute) 0 2 4 6 8 10 12 14 16 18 TIME (minute)Figure 2.7 DSC heat flow vs. time, during isothermal crystallization of HMS-9 at (a) 1080C and (b) 1200C. b HMS-9
Tc=
120
0C
CQE. . . I I iTable 2.4
Time to Maximum Exothermic Heat Flow (minutes)
as a Function of Crystallization Temperature for HMS-5 through 8
Sample Crystallization Temperature (OC)
130 134 138 140 142 144 147
HMS-5 --- 0.7 0.7 0.9 1.2 1.4 2.2
HMS-6 0.4 0.8 1.3 1.6 1.9 2.1
HMS-7 --- 0.9 1.0 1.4 1.7 3.4
HMS-8 --- --- 0.2 0.4 0.7 1.2 2.6