Cost Accounting System for an Emergency Department
by
Josh Chang
B.S., Carnegie Mellon University, 2009
MASSACHUSETTS INSTITUTE OF TECHNOLOLGY
JUN 2 4 2015
LIBRARIES
Submitted to the Engineering Systems Division and the MIT Sloan School of Management in PartialFulfillment of the Requirements for the Degrees of Master of Science in Engineering Systems
and
Master of Business Administration
In conjunction with the Leaders for Global Operations Program at the Massachusetts Institute of Technology
June 2015
2015 Josh Chang. All right reserved.
The author hereby grants to MIT permission to reproduce and to distribute publicly paper and electronic copies of this thesis document in whole or in part in any medium now known or hereafter.
Signature of Author
A
Signature redacted
___'MIT Engineering Systems Divisioi;\iIT Sloan School of Management May 8, 2015
Certified by
Signature redacted
David Simchi-Levi, Thesis Supervisor Professor of Civil and Environmental Engineering
\
N
MIT School of EngineeringCertified by
Signature redacted
Vivek Farias, Thesis Supervisor Robert N. Noyce Career Development Associate Professor of Management MIT Sloan School of Management
Accepted by
Signature redacted
Munther A. Dahleh, William A. Coolidge Professor of Electrical Engineering and Computer Science Chair Eggineering Systems Division Education Committee
Accepted by
Signature redacted
(Maura Herson, [Y1rector of MIT Sloan MBA Program MIT Sloan School of Management
Cost Accounting System for an Emergency Department
by
Josh Chang
Submitted to the Engineering Systems Division and the MIT Sloan School of Management on May 8, 2015 in Partial Fulfillment of the requirements for
the Degrees of Master of Science in Engineering Systems and Master of Business Administration
Abstract
In 2011, Michael Porter and Robert Kaplan - the godfather of modern managerial accounting and professor at Harvard Business School - said "There is an almost complete lack of understanding of how much it costs to deliver patient care, much less how those costs compare with the outcomes achieved." They also stated "U.S. healthcare costs exceed 17% of GDP and continue to rise" and "a fundamental source of escalating costs is the system by which those costs are measured" [1]
In 2015, Beth Israel Deaconess Medical Center (BIDMC), a Harvard teaching hospital, and MIT's Leaders for Global Operations program partnered to address this cost measurement issue for BIDMC's
Emergency Department (ED). The joint team developed a cost accounting model and implemented it as a software system.
Using the resulting system as a ruler for measuring cost of each patient visit, the ED is now able to assess cost of each visit, identify leverage points for cost reduction, and discover best practices from its own data. Most importantly, the ED is now making informed cost improvement decisions and can measure the impact of changes.
This paper documents in detail how we developed the cost accounting model and implemented the cost accounting system at the BIDMC ED, so that other emergency departments may be able to benefit.
Project Supervisor: Larry Nathanson, MD
Title: Director of Informatics Division, Emergency Department, Beth Israel Deaconess Medical Center
Project Supervisor: Gary Shillin
Title: Chief Administrative Officer, Emergency Department, Beth Israel Deaconess Medical Center
Thesis Supervisor: Vivek Farias
Title: Robert N. Noyce Associate Professor of Management, MIT Sloan School of Management
Thesis Supervisor: David Simchi-Levi
Acknowledgements
The author would like to thank everyone who helped make this project a reality and provided advice and contributions throughout the entire process. In particular, this project would not have been possible without the vision of Dr. Richard Wolfe, the Chief of Emergency Medicine at Beth Israel Deaconess Medical Center, technical advisory and medical context provided by Dr. Larry Nathanson and Dr. Steven Horng, and accounting guidance by Gary Shilling, the Chief Administrative Officer. I would also like to acknowledge the Leaders for Global Operations program for its support of this work.
Table of Contents
A b stra ct
...
3
Acknowledge ments
...
5
Table of Contents
...
7
List
...
. 1 1
List o f T a b le s ...
1 2
List of Equations...
13
1. Overview
...
15
1 .1 . C o n te xt ... 1 5 1.1.1. Em ergency M edicine ... 151.1.2. Emergency Department within a Hospital Business ... 16
1.2. Beth Israel Deaconess Medical Center (BIDMC) ... 16
1.3. Emergency Department at BIDMC... 17
1.3.1. Chief C o m p laints... 18
1.3.2. O rganizational Structure ... 18
1 .3 .3 . P ro ce ss Flo w ...
19
1.4 . Sum m ary of Pro blem s ... 21
1.5. Summary of Approach... 22
1.6. Summary of Findings and Next Steps... 22
2. Problem
...
25
2.1. The Emergency Department Cost Accounting Problem... 25
2.1.1. "C urrent" A pproach... 25
2.1.2. Limited Depth of Analysis ... 26
2.1.3. Lim ited Breadth of Cost... 27
2.1.4. Current Approach Example ... 27
2.1.5. The Project Objective and Scope... 28
3. Literature Review on Cost Accounting
...
31
3.1. Relevant Introduction to Managerial Accounting by Scott Keating [121... 31
3 .1.1. Types of C osts... 3 1 3 .1.2 . Stand ard C osts... 32
3.1.3. Simple Multi-Product Cost Allocation ... 32
3.1.5. Transfer Pricing... 34
3.1.6. Perform ance M easurem ent ... 34
3.2. Tim e-Driven Activity-Based Costing ... 35
3.3. Nurse W orkload M easures... 35
3.4. Cost Accounting for Health Care Organizations ... 36
4. Literature Review on Healthcare IT...
41
4.1. Choice of the Developer ... 41
4.2. Development Process... 43
4.3. Requirements Engineering ... 43
4.4. Other Considerations ... 45
5.
Cost A ccounting M odel...
47
5.1. Cost Breakdown... 47
5.2. Varia ble Costs ... 48
5.2.1. Nurse Labor ... 49
5.2.2. Other Variable Labor ... 58
5.2.3. Supplies... 60
5.2.4. Transfer Costs ... 65
5.2.5. Variable Cost Sum m arized M odel ... 67
5 .3 . Fix e d C o sts ... 6 8 5.3.1. Em ergency Departm ent Fixed Labor ... 69
5.3.2. Em ergency Departm ent Overhead... 74
5.3.3. Institution Overhead ... 74
5.3.4. Fixed Cost Sum m arized M odel ... 76
5.4. Conclusion of Accounting M odeling... 76
5.4.1. Final Accounting M odel... 77
5.4.2. Result: Finalized M odel vs. Current State ... 79
6.
Cost A ccounting System
...
85
6.1. Software Requirements... 86
6.1.1. Business Requirements ... 86
6.1.2. User Requirements... 87
6.1.3. System Requirements... 87
6.2. Program m ing Language... 88
6.2.3. Limitations as a W eb-Service... 91
6.3. Environment Setup... 91
6.4. Data Sourcing and Preparation ... 92
6.4.1. Daily Dynamic Sourcing ... 92
6.4.2. Periodic Sourcing ... 93
6.4.3. M anually Generated Data ... 95
6.5. Software Com ponents & Implementation ... 96
6 .5 .1 . M o d e l... 9 6 6 .5 .2 . C o ntro l ... 10 0 6 .5 .3 . V ie w ... 10 2
7. Findings & A pplications...
103
7.1. Visibility into Cost vs. Reimbursement... 103
7.2. Identification & Prioritization of Cost Saving Opportunities... 104
7.3. Discovery of Best Practices... 107
7.3.1. Provider Performance Management & Best Practice ... 107
7.3.2. M ulti-Site Performance M anagement & Best Practice ... 109
8. Next Steps & Enabled Future Research...
111
List of Figures
Figure 4-1: Reasons for Outsourcing ... 41
Figure 4-2: W aterfall vs. Agile Cost M odel ... 43
Figure 4-3: Cost of a Software Defect... 44
Figure 5-1: Cost Breakdown of BIDM C ED... 48
List of Tables
Table 1-1: Top 8 Chief Com plaints in FY2013... 18
Table 2-1: Current Approach Exam ple (pre-project)... 27
Table 5-1: Nurse Procedure Prioritization... 50
Table 5-2: Procedure Standard Times ... 51
Table 5-3: Procedure Standard Times, including "other procedure"... 52
Table 5-4: Procedure & Procedure-Set Standard Times ... 54
Table 5-5: Supply Prioritization ... 60
Table 5-6: M edication Prioritization... 62
Table 5-7: Variable Cost Allocation M ethod Sum mary ... 68
Table 5-8: Current Approach Exam ple (pre-project)... 79
Table 5-9: M odel Application Exam ple (post-project) ... 80
Table 6-1: Business Requirem ents ... 86
Table 6-2: Standard Cost Data Frames... 97
Table 6-3: M edicine Cost M apping Data Frame... 100
Table 7-1: Charged Amount vs. Cost ... 104
List of Equations
Equation 2-1: Current Approach Cost M odel ... 26
Equation 3-1: Standard Cost Exam ple ... 32
Equation 3-2: M ulti-Product Allocation Exam ple ... 33
Equation 3-3: Tim e-driven Activity-based Costing Exam ple ... 35
Equation 3-4: Visit Cost via Diagnosis... 37
Equation 3-5: Visit Cost via Procedures... 37
Equation 5-1: Nurse Procedure Tim e ... 53
Equation 5-2: Nurse Procedure Cost ... 53
Equation 5-3: Nurse Procedure-Set Tim e... 55
Equation 5-4: Nurse Procedure-Set Cost... 55
Equation 5-5: Nurse General Care Intensity... 56
Equation 5-6: Nurse General Care Tim e... 57
Equation 5-7: Nurse General Care Cost... 57
Equation 5-8: Nurse Labor Cost ... 57
Equation 5-9: Triage Nurse Labor Cost... 58
Equation 5-10: Nursing Labor Consum ption Rate... 58
Equation 5-11: Technician Tim e ... 58
Equation 5-12: Technician Labor Cost ... 59
Equation 5-13: Observer Labor Cost ... 59
Equation 5-14: Other Direct Labor Cost ... 59
Equation 5-15: Variable Labor Cost... 60
Equation 5-16: M edication Supply Cost ... 62
Equation 5-17: Blood Bank Supply Cost ... 63
Equation 5-18: Procedure Supply Cost... 64
Equation 5-19: General Supply Cost... 64
Equation 5-20: Sup ply Cost ... 64
Equation 5-21: Lab Transfer Cost ... 65
Equation 5-22: Radiology Transfer Cost ... 66
Equation 5-23: Cardiology Transfer Cost... 66
Equation 5-24: Transfer Cost... 66
Equation 5-26: Attending Labor Intensity ... 70
Equation 5-27: Attending Fixed Labor Cost (on intensity) ... 70
Equation 5-28: Nursing Labor Consumption Rate [dupe]... 71
Equation 5-29: Attending Fixed Labor Cost (on nursing labor consumption)... 71
Equation 5-30: Attending Fixed Labor Cost (even allocation)... 71
Equation 5-31: Resident Fixed Labor Cost... 72
Equation 5-32: Administrative Clinician Salary ... 73
Equation 5-33: Administrative Fixed Labor Cost ... 73
Equation 5-34: Fixed Labor Cost ... 73
Equation 5-35: ED Overhead Cost ... 74
Equation 5-36: Institute Overhead Cost... 75
Equation 5-37: Fixed Cost (of a patient visit) ... 76
Equation 5-38: Total Visit Cost (top layer) ... 77
Equation 5-39: Total Visit Cost (middle layer)... 77
Equation 5-40: Total Visit Cost (full blown model)... 77
Equation 6-1: Nested Loop Pseudo Code ... 89
Equation 6-2: Vector Math Pseudo Code ... 90
Equation 6-3: Medicine Load & Average R Code... 97
Equation 6-4: HTTP Request & Data Structuring R Code ... 99
1. Overview
This first chapter sets context for the Beth Israel deaconess Medical Center's (BIDMC) Emergency Department (ED) for the purpose of our project. This chapter also summarizes the problem, our approach to solving it, and the results and findings.
1.1. Context
For any nation, the management and delivery of healthcare is a critically important issue. Unfortunately, the US trails other developed nations in health and outcome measures despite spending significantly more on care [2] [3]. Furthermore, our healthcare costs have consumed an increasing share of GDP over the past fifteen years [4].
Within the overall healthcare costs, emergency medicine (i.e. the costs of emergency room visits) is an important component due to its scale and role as an entry point and filtering mechanism for the more expensive inpatient care [5] [6].
1.1.1. Emergency Medicine
Emergency medicine (EM) is a medical specialty caring for adult and pediatric patients with illnesses or injuries that require immediate and urgent medical attention [7]. EM physicians (MDs) diagnose a large variety of illnesses and focus on two objectives: If possible, they perform acute interventions to treat the illness and discharge the patient home. Otherwise, they resuscitate and stabilize patients enough to be admitted for more definitive inpatient care which could involve surgery and ICU (intensive care unit).
Historically, emergency care started in the military. Then, until 1960s, interns and residents often staffed emergency rooms at large hospitals. However, given the importance of the emergency care and the unique combination of skills required, EM was recognized as a medical specialty in 1979, making it one of the most modern medical specialties [5]. Today, emergency physicians require a broad field of knowledge and advanced procedural skills including airway management, surgical procedures, heart attack treatment, X-Rays interpretation, and even delivery of babies to name a few.
As a result, now emergency medicine plays an important role in our healthcare system as a 24-hour one-stop shop for urgent medical needs.
1.1.2. Emergency Department within a Hospital Business
As the emergency medicine matured as a specialty, emergency rooms have grown into emergency departments (EDs) and became a critical component of hospital businesses. Today, a hospital in the US may run an ED for three reasons:
1. Generate revenue as a business unit.
2.Drive customer traffic for higher-margin inpatient care business: In the last decade, inpatient business increased only 4% in number of admissions, but the ED-related inpatient admissions increased 17% [8].
3.Medicare receiving hospitals are required by federal law to provide care to anyone needing emergency healthcare treatment regardless of citizenship, legal status or ability to pay [9].
In practice, most EDs are successful at attracting inpatient customers and providing access to emergent care, but lose money as a business unit in the process. Worse yet, due to the lack of research on how to accurately measure the fixed and variable costs of ED visits, most hospitals don't have a clear idea on just how much money their ED is losing (or making) and where within the ED the losses are happening [6].
1.2. Beth Israel Deaconess Medical Center (BIDMC)
BIDMC is a fully integrated medical center born from the 1996 merger of New England
Deaconess and Beth Israel hospitals. Today, BIDMC is ranked each year as a "Best Hospital" by U.S. News & World Report in multiple specialties. Furthermore, BIDMC is the lead hospital of the CareGroup Network, a top 5 healthcare system in the country for quality and safety
BIDMC provides adult care, with over 50,000 annual inpatient discharges, 540,000 outpatient visits, 649 licensed beds, and over 1,250 physicians, virtually all of whom are faculty at Harvard
Medical School. As a result, BIDMC is focused on training the next generation of physicians and researching revolutionary therapies and healthcare management techniques.
Finally, as a "Most Wired" - and a "Most Wireless" - Hospital, BIDMC leads the way in
healthcare information technology (IT) and all BIDMC clinicians use centrally hosted, certified electronic medical records [10]. This culture of modern IT made BIDMC a perfect medical center for studying cost-related data and implementing a software solution.
1.3. Emergency Department at BIDMC
The Emergency Department at BIDMC is a Level I Trauma Center serving the Boston metropolitan area with 59 beds, over 40 Attending physicians, 39 residents, and over 200 nurses and supporting staff. Each year nearly 55,000 patients are treated in the state-of-the-art ED, which includes dedicated CT scanning, bedside monitoring and registration, and enhanced communication systems.
Also, the BIDMC ED's Division of Emergency Informatics has faculty members with board certifications in Medical Informatics. These MD-informaticians conduct relevant research and host a fellowship program to train the next generation of informaticians. For example, major components of the ED's cutting edge information systems were developed in-house by these faculty members and fellows. The department director and this project's supervisor Larry Nathanson, M.D. designed and programmed the "ED Dashboard", the ED information system that is used at BIDMC and a number of other hospitals. This project's mentor Steven Horng, M.D. developed a Google Glass application for assisting diagnosis and documentation by the ED physicians [11].
Finally, Since the BIDMC leads the CareGroup network (i.e. BID network), the physicians affiliated with BIDMC ED oversee 7 other ambulatory care sites at BID Milton, BID Needham, BID Plymouth, St. Luke's Hospital, St. Vincent's Hospital, and 2 urgent cares, treating over 300,000 total annual ambulatory visits annually.
1.3.1. Chief Complaints
As a Level 1 Trauma Center, BIDMC ED receives every type of emergency cases. As these cases arrive "pre-diagnosis", they are categorized by chief complaints. Chief complaints are very brief statement of the reason for the ED visit entered by the triage
nurses. Also, some cases arrive to the ED with multiple chief complaints. In the FY20131, ED saw 9807 unique combinations of chief complaints, demonstrating the complexity of the ED environment similar to "a manufacturing floor dealing with almost ten thousand
unique products".
The following are the eight most typical cases as examples.
Chief Complaint Number of Visits in FY2013
ABD PAIN 3596 CHEST PAIN 1952 S/P FALL 1150 HEADACHE 806 SHORTNESS OF BREATH 784 FEVER 760 DYSPN EA 756 BACK PAIN 741 1.3.2. Organizational Structure
Executives: As one of the thirteen medical departments at BIDMC, the ED is headed by three individuals at the top:
1. Chief of Emergency Medicine (Chief): The chief has a "chairman" responsibility over the BIDMC ED and 7 other ambulatory care sites of the BID network. Chief reports directly to the CEO, manages over 150 Attending physicians and allied health providers, and oversees the residency program for 39 residents through the program director. As an Attending physician and faculty himself, the Chief also practices emergency medicine and instructs the residents.
2. Chief Administrative Officer (CAO): The CAO dual-reports to the ED Chief as the administrative head of all ambulatory care sites of the BID network. CAO
manages all fiscal and administrative operations throughout the BID network.
3.Director of Ambulatory Services: This is a complex role combining management of over 100 nurses, over 30 technicians, and other direct labor as well as logistical and ancillary operations (e.g. supplies, ambulances, etc.) of all
ambulatory care sites. This director dual-reports to the ED Chief and BIDMC SVP of Ambulatory and Emergency Services who reports to the CEO.
Operating Divisions: The Chief distributes medical responsibilities across these divisions run by his physicians and nurses. Examples are the residency program, QA, and
informatics to name a few.
Harvard Medical Faculty Physicians (HMFP): The Attending physicians are employed by HMFP, a physicians group that is affiliated with BIDMC and Harvard Medical School. HMFP is contracted by the hospital for the physician services. HMFP manages the physicians, pays them directly, and provides them supports such as the malpractice insurance.
Harvard University: Given BIDMC's teaching hospital designation, the Attending
physicians are appointed as faculties at Harvard Medical School with varying ranks from instructors through professors. The 39 residents are therefore enrolled trainees of Harvard Medical School.
1.3.3. Process Flow
An average visit to BIDMC ED lasts around five and half hours and follows the following process:
1.Upon arriving, the patient is welcomed by a greeter who collects basic
information. If arriving via ambulance, the patient goes directly to the next step. Otherwise, the patient may wait for the next step in the waiting room.
2.A triage nurse collects pertinent medical information, takes vitals, and listens to the symptoms. Then, the triage nurse registers the patient into the system and assigns chief complaint(s) and acuity level. These two labels determine how quickly the next step happens and in which part of the ED. For example, if the triage nurse is concerned that the patient is having a heart attack, stroke or another imminently life threatening condition they will call a rapid response "trigger" which mobilizes a team of physicians and nurses to immediately evaluate and stabilize the patient.
3.Based on the acuity, patients are assigned to different "zones" of the ED where a registered nurse and resident will "work up" the patient, draw blood for lab testing, and order other tests and scans as necessary. If the patient arrived in critical condition (by ED standard), multiple physicians and nurses will be involved in this process and may attempt immediate resuscitation.
4.The lab and scan results will allow the resident to diagnose the patient and order treatments. Every diagnosis and order is discussed and confirmed by the Attending physician for quality and learning.
5.The nurse will administer the treatments and continue to monitor the patient progress.
6.Once the patient condition is improved or stabilized, the resident will order discharge or admission appropriately with the Attending physician's approval.
7.The nurse will process the discharge or admission.
8.Sometimes a decision to admit or discharge cannot be made without a longer period of monitoring and tests. These patients can be placed into ED
Observation status for up to 23 hours prior to a decision to admit or discharge. This observation has an impact of the total length-of-stay in the ED and cost of
Once the patient is in one of the ED zones, the nurse is constantly managing the patient's well-being medically and otherwise. To manage the nurse load, simpler tasks are often performed by the technicians. Depending on the patient condition, other personnel such as other personnel such as technicians or housekeepers may be involved.
1.4. Summary of Problems
As discussed in 1.1.2, many EDs are loss leaders as business units. This was not the case at BIDMC ED, where the annual reimbursements from the payers provided sufficient contribution margin to cover the direct labor and supply costs (not including hospital indirect costs such as utility, space, etc)2
. However, the margin was slim and the reimbursement rates are coming down. The ED had to start reducing cost, without compromising on quality.
Unfortunately, the department was unable to answer the following basic questions necessary to identify opportunities and measure progress:
1. Was a particular patient visit contributing or detracting from the overall margin? 2. Which type of visit drives majority of the annual cost?
3. Which process step drives majority of the annual cost? 4. Which provider is deemed more cost-efficient?
5. Are individual providers or the department improving over time?
In short, they were missing a "ruler" for measuring the cost of each visit to compare against the reimbursements to understand their contributions to the hospital's financial sustainability. Furthermore, the ruler was necessary to compare across the Attending physicians, chief complaints, or process steps to understand where the improvement opportunities existed.
2 The CAO tracked the average reimbursement vs. average cost, calculated as the fiscal year total cost divided by
1.5. Summary of Approach
At a very high level, we designed and implemented the "ruler" for measuring per-visit cost of every single ED patient visit. The project broke down into two phases:
1. Cost accounting model: We studied different ways of allocating variable and fixed costs across units produced from literature review and the manufacturing industry. Then, we combined and customized them to represent the actual environment of the ED, which is very different from other hospital services such as surgery which more closely
resembles a manufacturing cell. We used regression analysis, time study, and other analytic methods to inform our custom modeling choices.
2. Cost accounting system: We implemented our trained model as managerial accounting software that runs daily to calculate standard costs, report on the per-visit cost of each patient visit from the prior day, and report on various cost-related and other aggregated performance metrics about providers, chief complaints, etc.
1.6. Summary of Findings and Next Steps
From this project, we learned various ways to design a cost accounting model for complex yet flexible ED environment and the method and value of implementing the model as a software system.
As a result, BIDMC ED can now assess the financial contribution of each visit, identify
opportunity areas to reduce cost, and discover best practices as the direct result of the project works. Chapter 7 discusses these findings in detail. Furthermore, Section 5.4 summarizes the
learnings specific to the cost accounting modeling and Chapter 6 highlights learnings about the software implementation.
As the next step, BIDMC ED will continue to improve the accounting model and the software system. Furthermore, the cost performance management analytic tools will be extended to non-cost metrics such as throughput and also be applied to other departments and hospitals.
Table 5.8) unlocks a plethora of cost-related research topics which lacked the data to study until today.
Therefore, this project team hopes that future research will enrich the knowledge of ED cost management. Furthermore, we hope that other departments and hospitals will use this project as a baseline to implement their own cost accounting systems and begin to systematically and continuously improve cost performance.
2. Problem
In the previous chapter, we developed a case for the BIDMC Emergency Department (and EDs in general) to improve its cost efficiency without compromising on quality.
In fact, BIDMC ED made a few isolated attempts already, such as conducting Lean studies and instituting standardized processes (called clinical pathways) for cases based on a narrow set of symptoms. Unfortunately, each effort either wasn't focused on big enough of a cost driver or the result couldn't be quantified, because the ED didn't have a reliable way to measure the cost of the patient visits it tried the new processes on.
Instead, to continuously improve its cost efficiency, ED needs an accurate costing, as it allows the impact of process improvements to be readily calculated, validated, and compared. [1] With the right costing, ED should follow this systematic approach:
1. Identify the current cost of individual (or a set of) visits and assess their margin
2. Prioritize a similar set of visits, when their margin is improved, could have the largest impact on the financial sustainability of the ED
3. Change the process (or provider behavior) to improve the cost 4. Measure the result, then repeat
And to enable the above process, the ED had to first address the cost measurement problem, by building a good "ruler".
2.1. The Emergency Department Cost Accounting Problem
Therefore, the ED invested in this project to develop a cost measurement (accounting) system for BIDMC ED that would measure cost, help prioritize interventions, and inform types of changes that could improve the cost efficiency.
Prior to this project, the current state of analysis for ED cost was limited in breadth and depth.
Basically, the ED Chief Administrative Officer (CAO) had a very difficult job of managing ED's cost without the necessary data. He had reliable access to only the direct costs of operations.
1. Nurse, technician, and other hourly labor
2. Supplies purchased by the ED supply manager, such as IV bags and sutures 3. Residency program cost (including the resident salary)
4. ED administration labor
5. ED office supply and other office budget
With this data, he could track if the ED's expenditure increased in aggregate and for per-visit basis. He could also tell which of the above five categories drove the increase or decrease.
2.1.2. Limited Depth of Analysis
In the current approach above, the CAO took the sum of the five categories of costs he knew (i.e. ED expenditure) then divided it by the number of patient visits to get per-visit cost.
per visit cost = ED expenditure num patient visits
Unfortunately, this high-level analysis did not inform the CAO if a particular visit was actually profitable. He could assess if an overall average visit was becoming more or less costly per year, but couldn't assess if a certain classes of visits were losing money while other classes of visits were subsidizing them. In managerial accounting terms, the CAO had "cost allocation" problem.
As a result, the CAO was under-equipped to direct the ED attention to classes of visits that would contribute the most to the financial sustainability of the ED through more
cost-efficient care. Also, the Chief of Emergency Medicine didn't know which of his Attending physicians were most cost-efficient and hence potential role models.
2.1.3. Limited Breadth of Cost
To worsen the issue, the CAO's dataset excluded the costs that the ED didn't directly pay for but "caused" the hospital to spend in support of the ED's business. So in reality, the
CAO couldn't even assess if the department as a whole was fiscally balanced inclusive of these shared costs.
1.Annual attending labor paid to HMFP (see 1.3.2 re: HMFP)
2.Costs that other departments - mainly radiology, lab, pharmacy, and blood bank - incurred to support the ED
3.Utility
4.Support teams such as IT and billing 5.Other hospital shared costs
To imprecisely compensate for this at the annual review, the hospital was charging ED an "indirect overhead" based on the ED's square footage compared to the overall hospital real estate.
2.1.4. Current Approach Example
Hence, prior to this project, the following two visits couldn't be distinguished in their costs because the "Cost to ED" of each visit was the average cost of all visits.
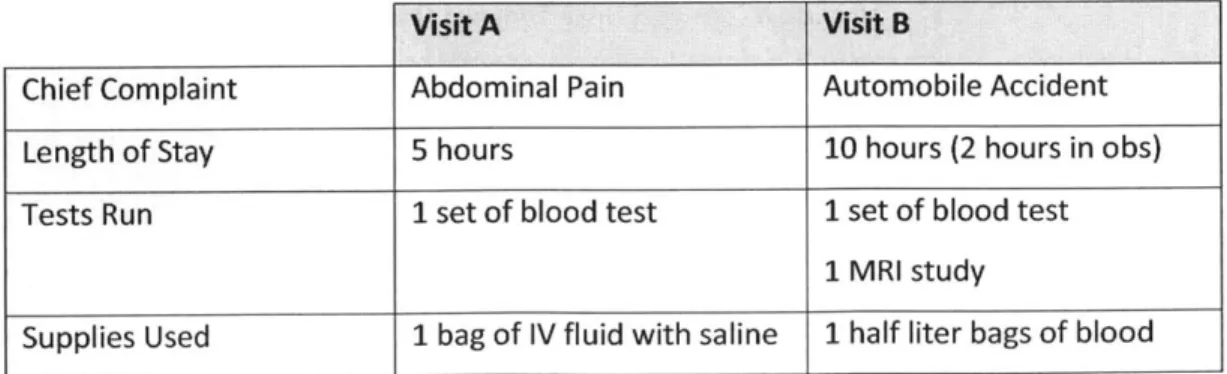
Table 2-1: Current Approach Example (pre-project)
Visit A Visit B
Chief Complaint Abdominal Pain Automobile Accident
Length of Stay 5 hours 10 hours (2 hours in obs)
Tests Run 1 set of blood test 1 set of blood test
1 MRI study
4 dosage of Vicodin Sutures
Temporary Cast
Nurse Labor $100 $100
Technician Labor $20 $20
Medicine Cost Other department Other department
Blood Cost Other department Other department
Supply Cost $30 $30
Total Cost to ED $200 $200
*All dollarfigures in this paper are hypotheticals
Notice that the average nurse labor cost per visit was "allocated" to both visits, despite the significant difference in complexity and the likely duration a nurse was occupied by each patient. Furthermore, blood, likely the most expensive component of the Visit B, is not included in the total cost because the ED administration doesn't have visibility into the Blood Bank Department's cost and lacks the information system to tie "orders" of
blood to the "cost" of the blood.
2.1.5. The Project Objective and Scope
To address these "lack of ruler" problems, this project focused on the following objectives and scope:
1. Develop a cost accounting model that estimates the full "variable cost" of each visit with the highest precision we could practically achieve in 3 months
2. Implement a software that would estimate the variable cost of every visit on daily basis according to the model and report those costs to the management in digestible format
The indirect cost (i.e. shared cost, overhead) were in scope, but wasn't modeled out in the same precision as the variable cost was. BIDMC ED made this prioritization decision since it could more directly influence variable costs.
Also, we didn't pursue a mathematically perfect cost accounting model that could prove exact cost of each visit in a closed-form. As cost accounting (aka managerial accounting) is intended to inform managerial actions, our objective was precise enough model that could still be explained simply and implemented within the project timeline.
We believe these prioritizations make this project as documented in this paper practical for other emergency departments to replicate for their use.
3. Literature Review on Cost Accounting
While there is very limited literature on cost accounting for Emergency Department specifically, this subject has been well studied in the manufacturing industry and more recently been applied to other parts of the healthcare delivery system. Therefore, we started this project with in-depth literature review of renowned accounting principles that would become the building blocks of our customized cost accounting model.
The following are highlights of our iterative literature review process, which informed the design of the cost accounting system implemented at BIDMC ED. We want to disclaim there were many other literature that informed the design and thank them.
3.1. Relevant Introduction to Managerial Accounting by Scott Keating [12]
MIT Sloan's Prof. Keating's book provides general survey of the managerial accounting terminologies and techniques that are utilized in the manufacturing floors and hospital floors alike.
3.1.1. Types of Costs
Cost Accounting discussed in this paper is an internal and managerial accounting process, by which administrators identify costs of operations and assess them. At the highest level, an organization's costs break down into two categories.
* Fixed cost is a cost that does not change with the volume of activity or production.
* Variable cost, by contrast, varies with the volume of activity of a firm. It is important to identify which activity a particular variable cost varies with. For example, some hospital costs vary with the number of patients while others vary with the length of stay.
Often, accountants also divide costs into direct costs such as materials spent to produce goods versus indirects, i.e. overhead, such as utility that cannot be tied directly to a particular unit of good or service produced.
3.1.2. Standard Costs
In cost accounting, where one tries to understand the cost of producing a unit of product or providing a unit of service, managers are interested in being able to say "this unit costs x dollars" prospectively.
To do so, managers use historical cost data to decide standard cost for a particular unit of product or service. For example, if a stethoscope is made of metal, plastic, and
rubber parts using an assembly tool by a technician, the standard cost of one unit can be defined based on one month of historical data. In other words, one month costs of all resources dedicated to production of stethoscopes are absorbed into the unit cost of each stethoscope.
standard cost (per unit) =
one month cost of metal +
-one month cost of plastic + one month cost of rubber + one month salary of technician +
cost of a tool
L lifespan of a tool (months)
-number of units produced in a month
Once the standard cost is set, managers will use it as the estimate of any future unit of the same product (e.g. stethoscope) or service for decision making (e.g. pricing), until they update the standard cost.
Actually, the above equation only accounts for direct costs. Indirect costs - also
referred to as overhead or period cost - are also divided by the expected unit production and absorbed into the standard cost of each unit.
When an organization produces multiple products -for example, stethoscope and blood pressure cuff- the above process of determining standard costs become complex due to shared resources.
If the same technician assembles stethoscopes and blood pressure (BP) cuffs, his or her monthly salary needs to be absorbed into the units of both products produced in the past month.
Equation 3-2. Multi-Product Aliocation Exarmple
technician salary (per unit of Stethoscope or BP Cuff)
one month salary of technician
number of units of stethoscope and BP cuffs produced in a month
However, the above absortion wouldn't be appropriate if the technician takes twice as long to assemble a BP cuff than a stethoscope.
Simple multi-product cost allocation attempts to solve this by combining these shared resources into a pool of overhead, then allocating overhead to a unit of each product based on another metric such as direct cost. In that case, if stethoscope's standard cost excluding the technician salary was $100 and BP cuff's was $300, each unit of BP cuff would be allocated three times as much technician cost than a unit of stethoscope would.
3.1.4. Activity-based Costing
Activity-based costing is an alternative to traditional accounting in which a business's overheads (indirect costs such as lighting, heating and marketing) are allocated in proportion to an activity's direct costs as shown above. However, the above approach does not precisely reflect how different products utilize different resources at a different rate. [13]
To address this issue, Prof. Robert Kaplan of Harvard Business School introduced the following methodology of activity-based costing (ABC) in 1988. Using the technician example from above, a manager would perform ABC by:
* Listing all the activities the technician needs to do complete to produce a unit of Stethoscope and BP Cuff
* Asking the technician to estimate what percentage of his or her time is spent on each activity in a month
* Determining a standard cost of each activity
" Summing the cost of each activity for every activity required for Stethoscope, arriving at a standard technician cost for a unit of Stethoscope
" Doing the same for BP Cuff
Activity-based costing is valuable in healthcare delivery environment because almost every service shares resources with other services (e.g. two different types of surgeries would share the same nurse).
3.1.5. Transfer Pricing
If an organization has many departments, one department may consume services of another to produce goods such as a stethoscope. In that case, the supporting department would charge transfer price to the producing department.
In a hospital, a surgical unit would not only incur standard cost of a surgery such as appendectomy based on all the resources and activities consumed, it would also need to account for transfer price of medicine provided by the pharmacy department.
3.1.6. Performance Measurement
Accounting information is frequently used in the process of evaluating and rewarding people's performances in organizations. For example, a hospital may reward cost-efficient surgeons and evangelize their surgical methods as best practices. To do so, the cost measurement has to be precise and accurate. Otherwise, the hospital can end up
focused on development and implementation of a cost accounting ruler with reasonable precision.
3.2. Time-Driven Activity-Based Costing
While the activity-based costing was an improvement over the traditional overhead allocation, it was difficult to get accurate cost measurements by surveying employees. It was also difficult to model service environments where an employee performed many different tasks. As a result, at one large bank's brokerage operation, the ABC data-gathering process required
70,000 employees at more than 100 facilities to submit monthly reports of their time allocation. [14]
Therefore, Robert Kaplan introduced time-driven activity-based costing (TD-ABC) in 2004 where managers directly estimate the resource demands imposed by each transaction, product, or customer, to arrive at an equation as below. [14] Then, the manager can multiply the
packaging time by per-minute salary of the packer to calculate the standard cost of packaging a special, air-shipping item.
Equation 3-3: Time-driven Activity-based Costing Example
Packaging Time (minute) = 0.5 + 6.5 (if special packaging) + 2.0 (if air shipping)
In the emergency room setting, TD-ABC can be used to estimate the labor cost of drawing blood for lab testing or other common tasks.
3.3. Nurse Workload Measures
While the traditional standard costing can cover materials cost and TD-ABC can cover
procedure labor, we needed another method for modeling nurse and other labor cost incurred for the general patient care but not for specific procedures or activities.
For example, if a patient is held in the emergency department for observation after an acute treatment, nurses aren't providing particular procedures that can be time-studied but are
monitoring the patient vitals, communicating with the patient, and providing general care. Based on literature review, the following ICU (intensive care unit) nursing labor models provided best approximations of what we needed for the ED.
" TISS (Therapeutic Intervention Scoring System) - Developed in 1974, determines how much nursing time is required to care for an ICU patient for an hour based on acuity. TISS evolved in complexity till 1996 where TISS-28 categorized nurse cost based on 28 parameters not just acuity.
* NEMS (Nine Equivalent of Nursing Manpower Score) - Developed in 1997, where regression analysis was used to narrow down TISS-28 to none most influential variables and simplified the scoring process.
* NAS (Nursing Activity Score) - Published in 2003 as an evolution of TISS/N EMS to cover 81% of variations in nursing time as opposed to 60%.
In general, these models calculate labor requirement as the amount of nursing capacity different patients require based on several characteristics, i.e. parameters like age. This approach inspired our linear regression based estimation of non-procedure labor cost as discussed in section 4.2.1.3 Nurse Non-Procedure Labor.
3.4. Cost Accounting for Health Care Organizations
Finally, the 1994 article "Cost Accounting for Emergency Services" by John Moorhead, MD, informed how to combine the above accounting techniques to design a cost accounting system specifically for an emergency department.
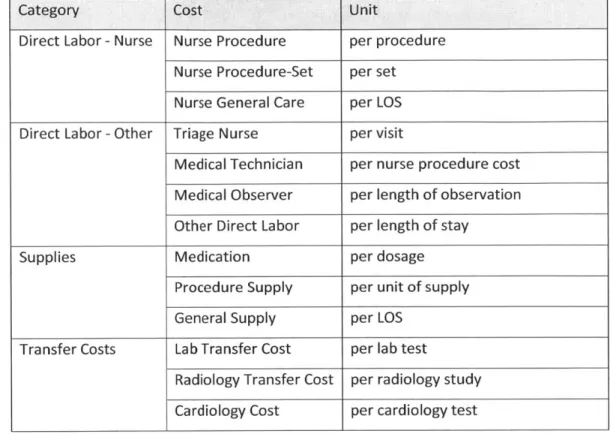
According to Moorhead, costs that are generally of interest to ED managers are the "direct" cost of providing care, including variable and fixed direct cost. [15] To measure and track them,
1. Define cost elements
First step is defining the categories of costs to be included in the accounting model. Moorhead listed direct labor, indirect labor, supplies, department overhead, and institution overhead as the common ED costs. Our project started with his list and added transfer costs of other departments' resources consumed during the care of an
ED patient visit.
2. Define unit of cost
Another step is defining the unit of cost. While the ultimate goal is to estimate the cost of each individual ED patient visit, there are many ways to break down the visit cost.
Moore provided two examples.
First, every ED visit results in one or more diagnosis. Because each diagnosis is arrived at via a similar set of actions which consume similar resources, it is possible to
determine a standard cost for each diagnosis. Then, the total cost of a visit will be estimated as the sum of standard costs of all the diagnosis provided.
Equation 3-4: Visit Cost via Diagnosis
Visit Cost = Standard cost of diagnosis
each diagnosis
given for that visit
Alternatively, every ED visit is also made of a list of procedures provided. Therefore, it is possible to determine a standard cost for each procedure. In this case, the total cost of a visit will be estimated as the sum of standard costs of all the procedures provided.
Equation 3-5: Visit Cost via Procedures
Visit Cost = Standard cost of procedure
each procedure performed for that visit
Both approaches have drawbacks. BIDMC ED managers wanted to not only review cost retroactively, but also estimate them in real-time or prospectively. Therefore,
estimating visit cost based on diagnosis which is given at the end of an ED visit was not suitable. On the other hand, time studying each procedure and identifying supplies consumed for each procedure is cost prohibitive.
Therefore, this project used perprocedure costing also known as job order costing -but categorized the procedures into several buckets to simplify data collection.
Furthermore, because each ED visit incurs costs that are not the result of a specific job order, we modeled it separately as non-procedure labor cost and overhead.
3. Model direct nursing costs
Nursing cost is the largest category of cost in emergency departments. When a nurse's time is spent on executing procedures for a patient, it is direct nursing cost that can be
modeled as a job order cost.
4. Model indirect nursinq costs
Nursing activities like monitoring the vitals of a group of patients are not direct procedures, they can be categorized as indirect nursing labor costs.
5. Model other labor
Moorehead suggests modeling physician, technician, and other medical labor that aren't directly tied to each procedure separately from the nursing labor costs.
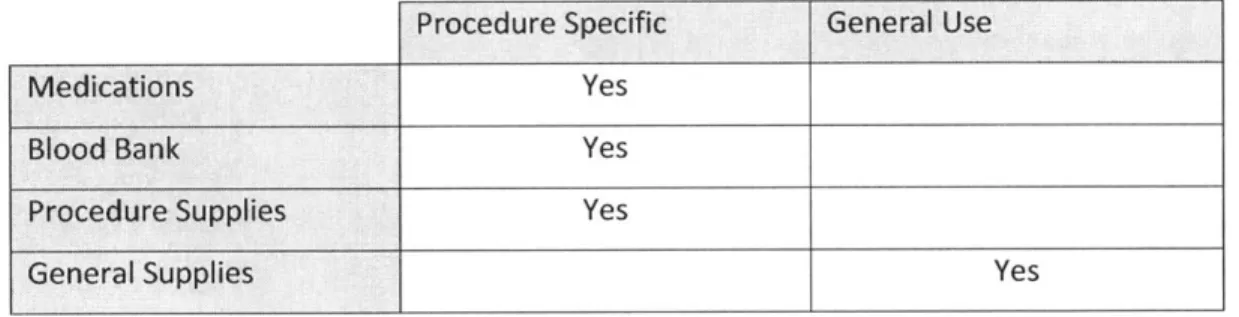
6. Model supply
Each procedure incurs direct nursing cost and direct material cost, such as the cost of a syringe. Moorehead suggest mapping significant material cost (i.e. expensive items) to individual procedures while treating insignificant materials as a shared cost to be allocated or absorbed based on acuity or length of stay.
To complete Moorehead's process, department and institution overhead must be modeled and incorporated.
The above 7-step process would allow a manager to determine standard cost of each
procedure, absortion rate of non-procedure cost, and allocation of overhead to calculate the cost of each individual visits.
Our project largely followed Moorehead's process but made different modeling decisions than his suggestions.
4. Literature Review on Healthcare IT
For the system implementation phase of our project, we relied less on the literature review and more on the team's experience.
BIDMC ED Informatics team had an in-house capability to design, develop, and deploy software for immediate use on the ED floor and management suite. In fact, most of the IT system used in the ED were developed in-house, rather than purchased. Therefore, it was practical to develop the system how the informatics team was used to developing software, even if it deviated from the industry best practices.
For the more common cases where the IT implementation has to be performed by the hospital IT department, outside developers, or consultants*, it is important to consider best practices in software development methodologies. Therefore, we've included a brief literature review that can assist other EDs in planning their cost accounting system implementation.
*Outsourcing IT development is considered the best practice for healthcare organizations, outside of cases like BIDMC ED which acts as an R&D lab for the ED industry. [17]
4.1. Choice of the Developer
First, the ED will need to choose an appropriate developer. The hospital might have an IT department who develops new IT systems as needed and understands existing systems well. The ED could also hire an outside vendor.
2004 IET journal Manufacturing Engineer, provides a helpful framework for making an
outsourcing decision such as this. [18] As demonstrated below, an organization may choose to outsource for four different reasons.
I
I
I
autsowd~gOLtsowdw"
FRmw~daI kupact
For an emergency department, cost accounting software system can be considered Strategic Outsourcing. It means the project is a bottleneck to the organization's strategic initiative but the primary goal of outsourcing isn't to get it done cheaper.
Therefore, if the ED believes an outside vendor has successfully implemented cost accounting systems for other EDs, it is advisable to choose that vendor. If the hospital's IT department has
implemented cost accounting systems for other departments successfully, they should take on the ED cost accounting project in-house. Either way, the ED is advised against choosing a
low-cost or generic vendor without a specialty in this strategic project.
If an emergency department decides to outsource, the following IEEE publications can guide it to form an outsourcing agreement, consider the outsourcing risks, and align the stakeholders:
* Outsourcing Decisions & Models - Some Practical Considerations for Large Organizations. [19]
* The Ins and Outs of IT Outsourcing. [20] wnlrm: . . .
4.2. Development Process
Another important decision is which software development model the ED would employ.
At a high level, Structured vs. Agile methods provide the tradeoff of a stable plan versus flexibility. [21] In other words, agile methods such as scrum allow the developers to prototype small pieces of the system in successive iterations to be validated by the ED staffs, while structured methods like waterfall start implementation only after a thoroughly documented requirements and project plan are signed off.
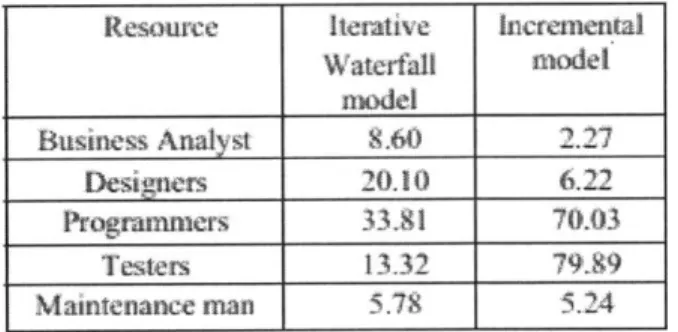
Because the iterative, agile methods do not need to over-invest in the analysis and design stages to build a bullet-proof plan, it is intended to offer cost efficiency and faster time to market. [211 However, this is not always the case as a 76-sample study in Switzerland [22] and simulation in India [23] found. For example, the following table from the Indian study
demonstrates not an absolute cost advantage for one model but how different stages of resources are consumed in each model.
Figure 4-2: Waterfall vs. Agile Cost Model
Resource Iterative hicerewntal
Waterfall model model Business Analyst 9.6) 2.27 Designers 20.10 6.22 Prograramers 33,91 70.03 Testers 13.32 79.9 Maintenance man 5.79 5.24
For this project, the first phase - cost accounting modeling - generated in depth requirement and design of how the software should compute cost. Therefore, it was clear that the waterfall model would offer better economics for the remaining software work. Furthermore, we wanted to avoid the additional iterations interrupting the MDs from their core responsibilities.
Requirement engineering is the first step of structured and agile models and critical to a successful project. For example, the below figure demonstrates the cost of correcting a mistake in requirement in a later stage. [24]
Cost
of Change
Requirements Analysis and Coding Testing in the Production
Oesign Large
In performing the requirements engineering IEEE recommends a five step approach [25].
1. Software requirement elicitation: Software user and the developer collaborate to discover, review, articulate, and understand the user's needs.
. Software requirement analysis: The developer thinks through the collected needs to
understand them in terms of the software requirements.
3. Software requirement specification: The developer documents software requirements in clear and precise terms.
4. Software requirement verification: The developer and user confirm that the
requirements address the user needs comprehensively. The developer also ensures that the software requirements specification is in compliance with the system requirements, conforms to document standards of the requirements phase, and is an adequate basis
5. Software requirement management: Throughout design, implementation, and QA phases, the developer maintains and updates the requirements elicitation, specification, analysis, and verification activities as needed and justified.
In our project, all five steps were completed in a handful of internal meetings within the ED Informatics Department due to a unique set of capabilities and experiences. At other ED sites, MDs, nurses, supply managers, and administrators should work closely with the software development team throughout the requirements phase.
4.4. Other Considerations
We believe the other considerations in software development are unique to different ED sites, their existing IT infrastructure, and the development team's capabilities and preference.
For example, there isn't one academically right answer on which design pattern to use for the general architecture of the system. This project used a variation of the model-view-controller (MVC) pattern but other approaches would have right as well.
Therefore, we advise other ED sites to make the remaining software development decisions based on their unique circumstances. To raise awareness of key factors, Chapter 5 documents some of the decisions this project team made.
5. Cost Accounting Model
As discussed in the problem statement, the goal of this project was to develop a software that will precisely and accurate measure the cost of each patient visit at BIDMC ED. The ultimate goal is to repeatedly answer questions around the margin of each visit, opportunity areas to reduce cost, and best practices for cost efficiency.
To address this problem statement, the first phase was developing a customized accounting model by applying the various principles learned from the literature review. This chapter discusses our design decisions and the final model, which incorporates standard costing, absortion costing, time-driven activity-based costing, and more. While this model was customized for BIDMC ED, we believe it can be implemented in other emergency or ambulatory care sites as-is or with small modifications.
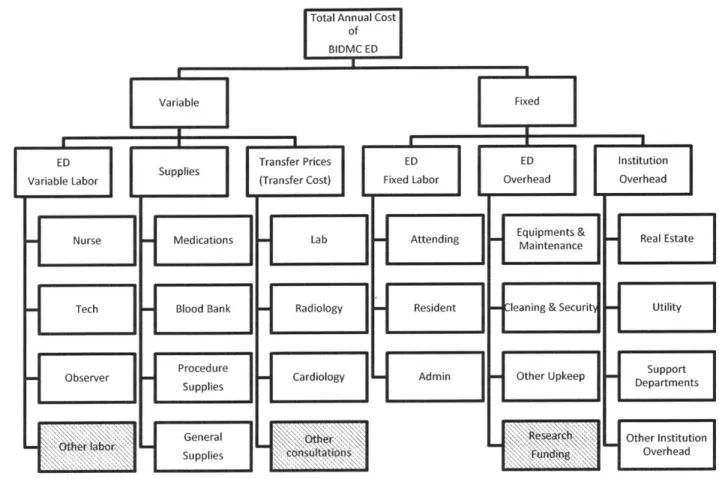
5.1. Cost Breakdown
Following the Moorehead's process from the literature review [16], we first identified the cost elements of BIDMC ED to be included in the scope. The total cost was broken down into components then grouped as variable or fixed. The following sections 4.2. Variable Costs and 4.3. Fixed Costs will discuss how each component of the ED cost can be best modeled for accurate and precise cost accounting.
Figure 5-1: Cost Breakdown of BIDMC ED
Total Annual Cost
of
BIDMVC ED
Variable
ED Transfer Prices ED
Variable Labor Supplies (Transfer Cost) Fixed Labor
Nurse Medications] Lab Attending
Tech Blood Bank Radiology Resident
SObserver
Procedure Cardiology Admin
General :"Othw
Supplies tiois
ED Institution
Overhead Overhead
Equipments & Real Estate Maintenance
ileaning & Securit- Utility
Other Upkeep DepartmentsSupport
esrtC Other Institution
Overhead
Other labor and other consultations are examples of insignificant costs that were excluded from the scope. Research funding was excluded as that cost is for different business purpose than direct patient care.
5.2. Variable Costs
Variable costs consist of labor, supplies, and transfer prices of other departments' resources consumed. Procedure-driven variable costs are allocated to specific procedures and remaining variable costs are allocated across visits based on length of stay, acuity, and several other parameters.
mw l
Fixed
I U
5.2.1. Nurse Labor
Nurse labor is a part of the variable labor and the most significant single cost category for the entire emergency department. Therefore, allocating nurse labor to the
appropriate procedures and visits is critical to the overall accuracy and precision of the accounting model.
To do so, we separated nurse labor into two categories: procedure labor and general care labor. Then, we applied time-driven activity-based costing and labor intensity model respectively.
Nurse Procedure Labor
An emergency department visit can be viewed as a collection of procedures intended to cure or stabilize the patient. Most of these procedures are performed by a registered nurse, either based on a physician order or nurse's discretion. Most emergency
departments, including BIDMC, record these discreet procedures in a computer system.
If we can estimate the labor cost of each procedure, then this digitized data format allows us to sum up the labor cost for the entire visit, helping us estimate the largest component of the per-visit cost. (Remember that estimating the per-visit cost is the
ultimate goal of this project.) As discussed in the literature review, Robert Kaplan's recent time-driven activity-based costing is a good method for determining the standard labor cost of each procedure. [1]
For example, we could time how long a sample of nurses take to administer a particular pain medication Hydromorphone via syringe and take the average as the standard time in hours (more likely fraction of an hour). Then, we can multiply the standard time by per-hour salary of an average nurse to arrive at the "standard labor cost for pain medication Hydromorphone administration via syringe".
However, unlike the highly specialized surgical nurses and other hospital staff, ED nurses perform hundreds of different procedures like the Hydromorphone example. This
makes taking a sample of nurses to perform hundreds of tasks and timing them very impractical.
Therefore, we classified procedures into three categories and prioritized them.
Table 5-1: Nurse Procedure Prioritization
Time-consuming Q-cuick
Frequent A
Infrequent B C
* Type A: Most frequent tasks that consume 80% of the nursing time. * Type B: Infrequent tasks, which are unusually time consuming such that
inclusion of that task in the course of a patient visit can significantly increase the amount of nursing labor consumed by that visit.
* Type C: Infrequent tasks, which aren't unusually expensive.
Based on the Pareto Principle (i.e. 80-20 rule), we focused our time studies on Type A and Type B tasks. Furthermore, similar tasks in Type A were grouped together.
For example, the time it takes a nurse to administer Hydromorphone via syringe is much longer than oral administration as a pill. However, oral administration of most medicine such as Hydromorphone and Acetaminophen are relatively similar. Therefore, we grouped oral administration of all "pills" into one Type A task and time studied a sample of 50 administrations. Then, we used the median of that measurement - let's
hypothetically say 3 minutes - as the standard time for administering a pill. Finally, we multiplied the 3 minute with the standard perhour salary of a registered ED nurse -let's hypothetically say $60 inclusive of all the benefits, training, and support costs - to arrive at $3 per-procedure as the standard cost of administering a pill.
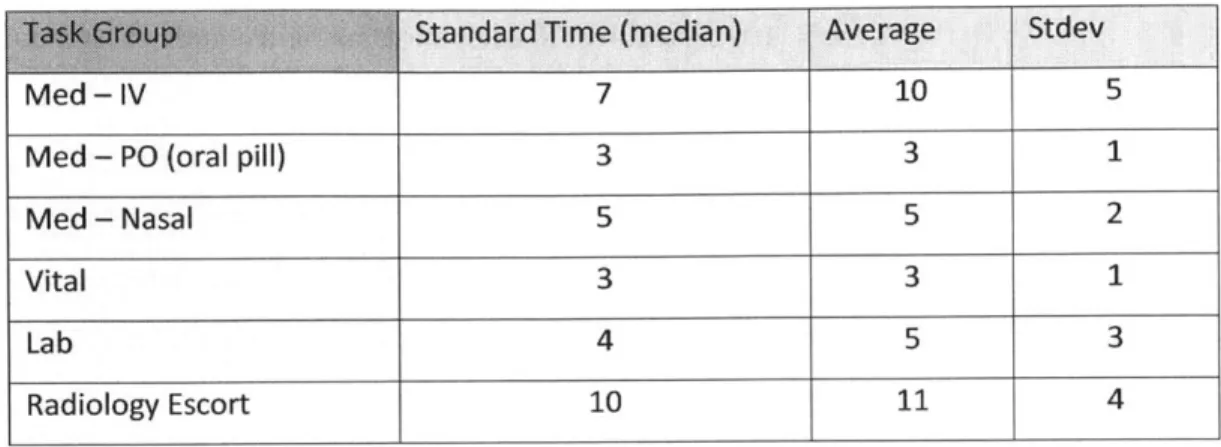
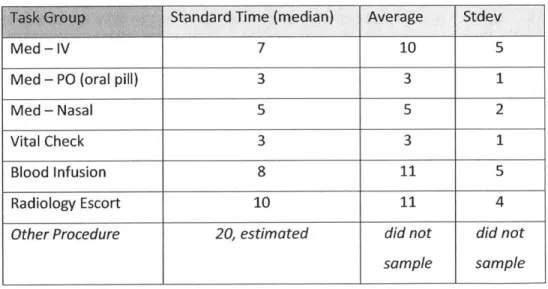
Table 5-2: Procedure Standard Times
Med - IV 7 10 5
Med - PO (oral pill) 3 3 1
Med - Nasal 5 5 2
Vital 3 3 1
Lab 4 5 3
Radiology Escort 10 11 4
The table above shows averages that are typically higher than median. The standard deviation is significant compared to the average as well. This is primarily due to the following three variations resulting in a long-tail distribution of the observed times.
Variation across patients: Depending on the patient demographic and clinical factors, certain tasks could take longer. For example, administering IV medication for an 80-year-old female takes longer than 30-year-old male because of the difficulty in accessing their vein. This variation can be modeled by regressing the nurse time on the relevant demographic and clinical factors.
Based on the result, we could assign different standard time and standard cost to different patients. In this project, we did not pursue this layer to err on the side of simple and easier-to-implement system.
* Variation across nurses: Different nurses have different skill levels and can take a different length of time for the same task (assuming the same patient). However, since the patient is not requesting a particular nurse, the model should not assign higher cost to a visit because the assigned nurse was slower. Therefore, this project time studied the same task (or group of tasks) across several nurses to address the variation across the nurses.
* Variation across tasks: Finally, because the above statistics were for groups of similar tasks, the variation between tasks such as Hydromorphone pill and