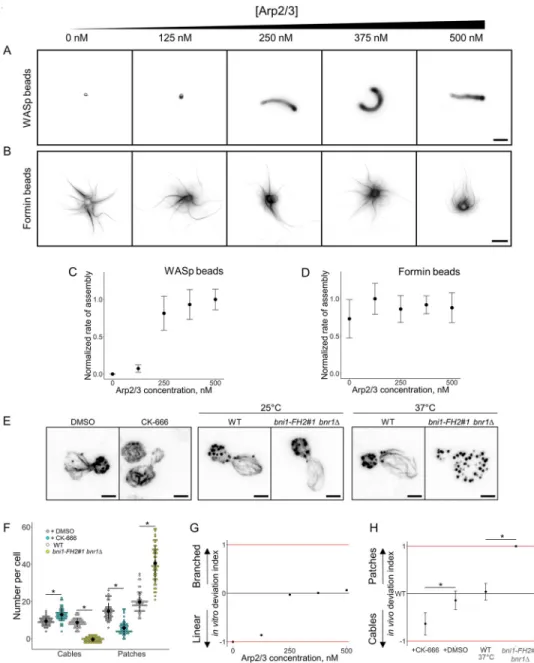
La taille de réseaux d'actine partageant un environnement commun est déterminée par leurs vitesses d'assemblage respectives
Texte intégral
Figure


Documents relatifs
Figure 14: Dispersion curves for an elliptic shell (e=1 mm) which major axis parallel to the transducer array. The squares represents the results obtained from the x 0
Damien Stehlé pour leurs bons conseils ; à Tancrède Lepoint pour ses exposés toujours clairs ; à Luca De Feo qui a dé terminé à lui seul le nom avec lequel je signe mes articles ;
Modèles de référence Pour évaluer notre modèle d’apprentissage de représentations multimodales basé sur le contexte visuel (QR2), nous évaluons : 1) le mo- dèle de texte
In this paper, we are interested in the numerical homogenization of a non-local PDE that derives from a microscopic first order model for traffic flow that simulates the presence of
Figure1: A) Representative images of one animal acquired 17 days post tumor inoculation. The red line corresponds to the manual tumor delineation. Color-coded clustering result
We prove the existence of a solution to an ergodic master equation, towards which the time-dependent master equation converges as the horizon becomes large, and towards which
Cell type specific targeting of microbial opsins to retinal bipolar cells, that utilize neural circuits upstream of ganglion cells, can elicit ganglion cell responses
Also, we observe a difference between the theoretical and the empirical packet loss rate, depicted in Fig.13. In theory, when the attack starts, the packet loss rate is expected
