HAL Id: inserm-03117120
https://www.hal.inserm.fr/inserm-03117120
Submitted on 20 Jan 2021HAL is a multi-disciplinary open access archive for the deposit and dissemination of sci-entific research documents, whether they are pub-lished or not. The documents may come from teaching and research institutions in France or abroad, or from public or private research centers.
L’archive ouverte pluridisciplinaire HAL, est destinée au dépôt et à la diffusion de documents scientifiques de niveau recherche, publiés ou non, émanant des établissements d’enseignement et de recherche français ou étrangers, des laboratoires publics ou privés.
Dementia risk scores as surrogate outcomes for
lifestyle-based multidomain prevention trials-rationale,
preliminary evidence and challenges
Nicola Coley, Marieke Hoevenaar-blom, Jan-willem van Dalen, Eric Moll van
Charante, Miia Kivipelto, Hilkka Soininen, Sandrine Andrieu, Edo Richard
To cite this version:
Nicola Coley, Marieke Hoevenaar-blom, Jan-willem van Dalen, Eric Moll van Charante, Miia Kivipelto, et al.. Dementia risk scores as surrogate outcomes for lifestyle-based multidomain prevention trials-rationale, preliminary evidence and challenges. Alzheimer’s and Dementia, Elsevier, 2020, 16 (12), pp.1674-1685. �10.1002/alz.12169�. �inserm-03117120�
1
This is the pre-peer reviewed version of the following article:
Coley N, Hoevenaar-Blom MP, van Dalen JW, Moll van Charante EP, Kivipelto
M, Soininen H, Andrieu S, Richard E; PRODEMOS consortium, the preDIVA
study group, the MAPT/DSA group, and the HATICE consortium. Dementia risk
scores as surrogate outcomes for lifestyle-based multidomain prevention
trials-rationale, preliminary evidence and challenges. Alzheimers Dement. 2020 Aug
16. doi: 10.1002/alz.12169. Epub ahead of print. PMID: 32803862,
The article has been published in final form at DOI:
10.1002/alz.12169
This article may be used for non-commercial purposes in accordance with
Wiley Terms and Conditions for Use of Self-Archived Versions.
2 Dementia risk scores as surrogate outcomes for lifestyle-based multidomain prevention trials –
rationale, preliminary evidence and challenges
Nicola Coley*,1,2,a, Marieke P Hoevenaar-Blom*, 3, 4, Jan-Willem van Dalen 3, 4, Eric P Moll van Charante5, Miia Kivipelto6,7,8,9, Hilkka Soininen10, 11, Sandrine Andrieu†,1,2, Edo Richard†, 3, 4, on behalf of
the PRODEMOS consortium#, the preDIVA study group#, the MAPT/DSA group#, and the HATICE consortium#
* contributed equally; † contributed equally; # members are listed in the acknowledgements
1
INSERM-University of Toulouse UMR1027, Toulouse, France
2
Department of Epidemiology and Public Health, Toulouse University Hospital, Toulouse, France
3 Department of Neurology, Amsterdam UMC, University of Amsterdam, Meibergdreef 9, 1100 DD,
Amsterdam, the Netherlands
4
Department of Neurology, Donders Centre for Brain, Behaviour and Cognition, Radboud University Medical Center, Geert Grooteplein 10, 6525 GA, Nijmegen, the Netherlands
5
Department of General Practice, Amsterdam UMC, University of Amsterdam, Meibergdreef 9, 1100DD, Amsterdam, the Netherlands.
6
Public Health Promotion Unit, Finnish Institute for Health and Welfare, Helsinki, Finland Division of Clinical Geriatrics, Center for Alzheimer Research, Care Sciences and Society (NVS),
7
Division of Clinical Geriatrics, Center for Alzheimer Research, Department of Neurobiology, Care Sciences and Society, Karolinska Institutet, Stockholm, Sweden
8
Institute of Public Health and Clinical Nutrition, University of Eastern Finland, Kuopio, Finland
9
Ageing Epidemiology Research Unit, School of Public Health, Imperial College London, United Kingdom
10
Department of Neurology, Institute of Clinical Medicine, University of Eastern Finland, Kuopio, Finland
3
11
Neurocenter Finland, Neurology, Kuopio University Hospital, Kuopio, Finland
a
Corresponding author: Nicola Coley
INSERM-Université de Toulouse UMR1027 Faculté de Médecine
37 allées Jules Guesde 31000 Toulouse France
Email: nicola.coley@inserm.fr Tel: +33 (0)5 61 14 56 80
4 Structured abstract
INTRODUCTION: Although not designed as such, dementia risk scores might be useful surrogate outcomes for dementia prevention trials. Their suitability may be improved by using continuous scoring systems, taking into account all changes in risk factors, not only those crossing cut-off values. METHODS: In three large multidomain dementia prevention trials with 1.5-2 years of follow up (MAPT, preDIVA and HATICE) we assessed 1) responsiveness (sensitivity to change) and 2) actual and simulated intervention effects of the original and crude/weighted z-score versions of the CAIDE and LIBRA scores.
RESULTS: All versions of the risk scores were generally responsive, and able to detect small though statistically significant between-group differences following multidomain interventions. Simulated intervention effects were well detected in z-score versions as well as in the original scores.
DISCUSSION: Dementia risk scores and their z-score versions show potential as surrogate outcomes. How changes in risk scores affect dementia remains to be determined.
5 1. Background
The growing burden of dementia and a continuing lack of effective treatment,1,2 make it increasingly important to develop and test the effectiveness of preventive interventions. Lifestyle factors could be suitable targets for such interventions since, particularly during midlife and early late-life, certain modifiable risk factors are thought to account for as much as 35% of dementia risk.3 Lifestyle interventions aiming to reduce this risk may therefore need to target and be tested in individuals in their 50s and early 60s.
A key methodological decision for randomized controlled trials (RCTs) testing interventions aiming to prevent dementia is the choice of primary outcome measure. The ultimate aim is to lower dementia incidence, but its measurement in trial settings presents numerous challenges, including the need for long follow-up of many participants in an age range offering sufficient room for prevention, and sufficiently high incidence rates to demonstrate significant between-group differences. Also, reliably ascertaining the date of dementia onset is challenging when extensive cognitive evaluations are performed frequently. Given these difficulties, and the conceptualization of dementia as a late stage in a continuum of cognitive decline, rather than an acute binary event, measuring the impact of interventions has shifted towards performance-based estimates of cognitive function.4 However, for intervention trials carried out in mid-life or early late-life, cognitive decline is likely to be absent or slow, and the clinical relevance of small changes uncertain. There is therefore a need for surrogate outcomes. Despite widespread interest in dementia biomarkers, they are not yet validated such.5 However, dementia risk scores could serve as surrogate outcomes for dementia prevention trials, similar to the use of risk scores such as the Framingham risk score and SCORE in cardiovascular trials.6-8 These scores may register changes in dementia risk before detectable cognitive decline, facilitating studies in relatively young populations with a relatively short follow-up period.
This goal of this work was to evaluate the suitability of dementia risk scores as surrogate outcome measures for dementia prevention trials. The aims were to: (i) identify dementia risk scores that
6 might be suitable as outcome measures for multidomain prevention trials conducted from midlife onwards (ii) propose methods to theoretically improve their responsiveness (sensitivity to change); (iii) assess the responsiveness of (improved) risk scores in prevention trial settings using data from recent prevention trials (Multidomain Alzheimer Preventive Trial’ (MAPT),9 ‘Prevention of dementia by intensive vascular care’ (preDIVA),10 ‘Healthy Ageing Through Internet Counselling in the Elderly (HATICE)11; and (iv) assess the ability of (improved) risk scores to detect intervention effects on modifiable risk factors in the MAPT, preDIVA, and HATICE trials and in simulated studies.
2. Methods
a) Preliminary literature review
First, we identified dementia risk scores that might be suitable for use as a primary outcome measure for multidomain dementia prevention trials from two systematic reviews,12,13 published in 2010 and
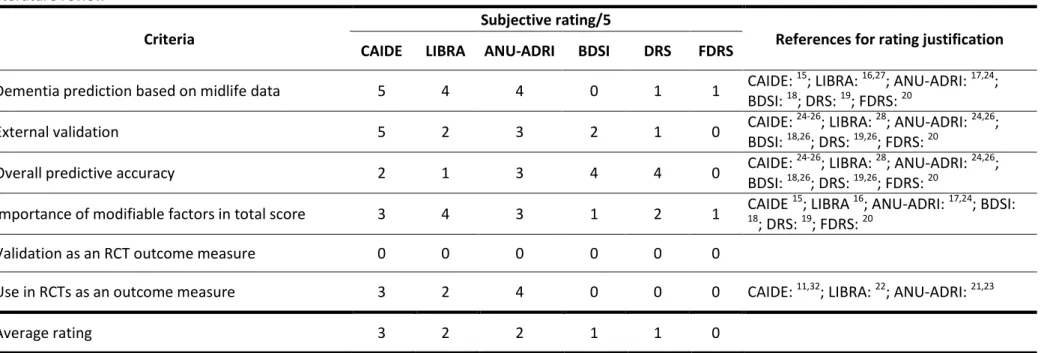
2015, and a narrative review from 2016.14 We additionally searched Pubmed for papers published since 2015 using the following searches: (i) “(dementia[TI] AND risk [TI] AND (score OR predict* OR index OR tool)”; (ii) "dementia risk" AND trial. Further references were identified through reference lists and our own files. Scores developed to predict risk of incident dementia which included at least one modifiable risk factor were retained, and those specifically designed for populations with particular medical conditions (e.g. mild cognitive impairment, type 2 diabetes) and requiring extensive, burdensome and/or expensive clinical or biological evaluations (e.g. cognitive testing, biomarker data) were excluded. Six criteria (Table 1) deemed to be important when selecting a risk score as an outcome measure for multidomain dementia prevention trials, were rated (by two raters, NC and MHB) for each identified risk score on a scale of 0 (absence of evidence) to 5 (consistent strong evidence). The three highest rated scores were considered for further evaluation.
b) Evaluation of performance of risk scores Participants and setting
7 We analyzed data from the randomized MAPT, preDIVA and HATICE trials, which are summarized in Supplementary Table 1, and have been previously described in detail.9-11 MAPT tested a 3-year multidomain intervention (cognitive training, physical activity, nutrition counselling, and a preventive consultation), alone or in combination with an omega-3 supplement, for the prevention of cognitive decline in 1679 individuals aged ≥70 in France; preDIVA tested a 6-year multidomain nurse-led vascular care intervention for the prevention of dementia in 3526 individuals aged 70-78 in the Netherlands; and HATICE tested an 18-month coach-supported interactive internet platform to encourage self-management of cardiovascular risk factors for the prevention of cardiovascular disease and cognitive decline in 2724 individuals aged 65 and older in Finland, France and the Netherlands. For this analysis, we used 1.5- (HATICE) or 2- (MAPT, preDIVA) year follow-up data, and for MAPT, here the intervention group comprises all subjects who received the multidomain
intervention, and the control group those who did not, regardless of omega-3 assignment. All three trials were approved by local ethical committees, and participants gave written informed consent. The trials were registered at clinicaltrials.gov (MAPT: NCT00672685) or the ISRCTN registry (preDIVA: ISRCTN29711771, HATICE: ISRCTN48151589).
Outcomes
The literature review suggested that the Cardiovascular Risk Factors, Aging and Incidence of
Dementia (CAIDE) dementia risk score,15 Lifestyle for Brain Health (LIBRA) index,16 Australian National University AD Risk Index (ANU-ADRI) 17 were the most suitable candidate risk scores (see Results section for details). We performed data analysis for the CAIDE and LIBRA scores, but did not assess the ANU-ADRI because of a lack of data for the modifiable risk factors specific to this risk score (e.g. pesticide exposure, traumatic brain injury; the available modifiable factors were the same as those used in the LIBRA).
8 Both the CAIDE score and the LIBRA index attribute points using categorical scoring systems based on underlying prediction models. For example, the CAIDE awards 0 points if systolic blood pressure (SBP) is ≤140 mmHg, and 2 points if SBP is >140 mmHg (Supplementary Table 2). Responsiveness may not be optimal for such scoring systems, since large changes in individual risk factors (and thus likely in dementia risk) may not be registered if these changes do not cross the categorical cut off points. For example, a decrease in SBP from 180 to 160 mmHg would not result in a change in the CAIDE risk score, whereas a decrease from 141 to 139 mmHg, although much smaller, would. Responsiveness of the CAIDE score could also be limited by the fact that non-modifiable factors (e.g. sex or education) account for up to 8 out of a possible 15 points (53%).
We hypothesized that the ability of the CAIDE and LIBRA scores to detect relatively modest (yet meaningful) intervention effects could be improved by using continuous, rather than categorical, measures of exposure to the modifiable risk factors. We therefore calculated CAIDE and LIBRA scores at baseline and follow-up (2-years for MAPT and PreDIVA; 18-months for HATICE) in three ways: (i) using the original scoring system; (ii) an unweighted average of the z-scores of the modifiable risk factors; and (iii) a weighted average of the z-scores of the modifiable risk factors.
For the original categorical scoring systems,15,16 we operationalized risk factors as described in Supplementary Table 2. For both CAIDE and LIBRA, higher scores indicate greater dementia risk. Z-score versions of the CAIDE and LIBRA Z-scores were calculated as the average of the z-Z-scores of all of the modifiable risk factors (measured continuously; see Supplementary Table 2 for details),
standardized using baseline mean and standard deviations (SDs). Finally, to account for differences between risk factors in predictive value for dementia, we also calculated weighted z-score averages, with weights based on the points attributed in the original scores (Supplementary Table 2).
9 The CAIDE score included all seven risk factors for all three trials, with total possible scores ranging from 4 (because all participants were aged >52 years) to 15. The risk factors included in the LIBRA index, and therefore the minimum/maximum theoretical total scores, varied across trials
(Supplementary Table 2). In MAPT, the total LIBRA index ranged from 0 to 8.9 for between-group comparisons, and -1 to 11.7 for analyses limited to the intervention group only (more risk factors were measured in the intervention group than in the control group, as described in Supplementary Table 2). In PREDIVA, the total possible LIBRA index ranged from -1 to 12.7, and in HATICE, it ranged from -4.2 to 11.6.
Statistical analysis
Responsiveness of the original CAIDE and LIBRA scores was first explored descriptively by calculating the number and proportion of participants showing changes between baseline and follow-up in the total score and individual score components. Change in original scores was compared to change in z-scores using scatter plots. These analyses were restricted to participants in the intervention groups with a total score available at both baseline and follow-up.
The ability of the original and crude/weighted z-score versions of each score to detect intervention effects was assessed by comparing changes from baseline between the intervention and control groups within each trial, adjusting for baseline scores, using linear regression for HATICE and mixed models for the studies with multiple measurement points and/or cluster randomization (MAPT, preDIVA). Furthermore, based on control group data from preDIVA, we evaluated how hypothetical intervention effects (of varying magnitude) on individual risk factors would affect the original and z-score versions of the CAIDE and LIBRA z-scores, simulating the intervention using 500 bootstraps of the following procedure: (i) adding the hypothetical intervention effect to control group participants (e.g. random normal distribution of SBP -2 ±0.5 mmHg) (ii) drawing equally sized random samples with replacement from the original and altered control groups, and (iii) calculating the difference in scores between the intervention groups.
10 Analyses were performed using Stata version 14.1 (StataCorp LP, College Station, Texas) and R version 3.6.1 (RStudio, Inc., Boston, MA).
3. Results
a) Preliminary literature review
Six dementia risk scores met our eligibility criteria: the CAIDE dementia risk score, LIBRA index,16 ANU-ADRI,17 Brief Dementia Screening Indictor (BDSI),18 Dementia Risk Score (DRS),19 and
Framingham Dementia Risk score (FDRS).20 Supplementary Table 3 lists the risk factors included in each score. Of the six identified scores, the three most suitable as primary outcome measure were the CAIDE, LIBRA and ANU-ADRI, notably because they specifically take into account midlife data, they have been validated in several cohorts, and each includes at least four modifiable risk factors (Table 1). However, none of these scores were specifically designed as RCT outcome measures with CAIDE and ANU-ADRI including both modifiable and non-modifiable risk factors,15-20 and their responsiveness has not been well studied. Nonetheless, the ANU-ADRI and LIBRA scores are already being used as primary outcome measures in proof of concept trials.21-23
On the basis of data availability, the CAIDE and LIBRA scores were selected for further study in the analyses presented below. The CAIDE score was developed in a Finnish prospective population-based cohort study to predict late-life dementia risk in middle-aged people using four modifiable (blood pressure, cholesterol, body mass index (BMI), physical activity) and three non-modifiable (age, education, sex) risk factors.15 Total scores range from 0 to 15 points. It has been evaluated in numerous validation cohorts, of varying ages and nationalities, in which it generally showed poorer predictive performance (area under the curve (AUC): 0.49-0.75) than in the original development cohort (AUC 0.77).24-26
11 The LIBRA index was developed to predict dementia only using modifiable risk factors. Weightings for the different factors were derived from relative risks from published meta-analyses for each individual factor.16,27The full version includes 12 modifiable risk factors (Supplementary Table 3), giving a total score ranging from -4.2 to 14.4 (Supplementary Table 2). Validation studies have shown moderate predictive accuracy (AUC 0.5-0.6) in several mid- to late-life cohorts, in which the LIBRA index was calculated using the available variables (not all 12 risk factors were assessed in each cohort).
b) Performance of risk scores as outcome measures
Mean ages of the participants in the MAPT, preDIVA and HATICE trials ranged from 70.8 to 75.3 years, and mean baseline CAIDE and LIBRA scores ranged from 7.3 to 9.3, and 2.9 to 3.7, respectively (Supplementary table 1). Subjects excluded from the analyses tended to be older and less educated, and to have poorer cognitive function, than those included in the analyses (Supplementary Table 4).
Responsiveness
Across the three trials, 48 to 58% of intervention group participants underwent change on the CAIDE score between baseline and follow-up (30-31% decreased (i.e. reduced their dementia risk), and 18-27% increased) (Figure 1a). The LIBRA index appeared more responsive: up to 79% of participants changed over time (Figure 1b), although the proportion of participants whose score increased (32-42%) was similar to the proportion whose score decreased (29-43%). Figure 2 shows the proportion of subjects undergoing changes in the individual risk factors in each score.
Figure 3 compares the change in the original CAIDE and LIBRA scores against the change in the z-score versions within each trial. The z-z-score versions registered changes in risk factors that were not detected by the original scores: for both scores, but particularly the CAIDE, subjects with no change over time in the original score showed great variability in their change in z-scores, for example,
12 ranging from as much as -1.25 to 1.25 for the CAIDE. Furthermore, 25% of subjects in preDIVA, for example, who underwent no change on their LIBRA hypertension score (using the original scoring system) showed a decrease in SBP of 21 mmHg or more (range -21 to -78 mmHg; data not shown). Conversely, for very small changes in z-score, the change in original CAIDE or LIBRA scores was as much as -5 to 5 points, indicating multiple small changes in risk factors just across the cut-off values for the original scoring system (e.g. systolic blood pressure drop from 141 to 140 or BMI drop from 30.1 to 30).
Ability to detect intervention effects
Although the theoretical potential range of change for the original CAIDE score is -7 to +7 points (because a maximum of 7 points are attributable to the modifiable risk factors), in the MAPT, preDIVA and HATICE populations, the average potential for improvement (i.e. the average baseline score for the modifiable risk factors) was 1.8, 2.2 and 2.8 points, respectively. Mean differences in change from baseline between intervention and control groups ranged from -0.11 to -0.19 points (representing 4-9% of the potential for improvement). Despite relatively modest intervention effects, between-group differences in CAIDE score change, in both its original or z-score formats, were significant in almost in all trials (Table 2). Across all studies there did not seem to be much difference between the original or the (weighted) z-scores in their ability to detect intervention effects.
In the simulations, “small”, “medium”, and “large” intervention effects on all modifiable risk factors simultaneously led to mean betweengroup differences in the total original CAIDE score of 0.11, -0.25 and -0.50 points, respectively and in the z-score version of -0.05, -0.11 and -0.24 standard deviations respectively (Table 3).
For the original LIBRA index, the potential range of change is up to -15.8 to +15.8 points, but again the average potential for improvement was much more limited in our populations (2.9 points in MAPT, 3.5 in preDIVA, 3.7 in HATICE). Mean differences in change between intervention and control groups on the original index ranged from -0.02 to -0.15 points (1-4% of the potential for
13 improvement). In preDIVA, there was a significant difference in favor of the intervention group for the original score, but not for the (weighted) z-score. In MAPT and HATICE, however, there was no between-group difference for the original LIBRA index, but there were significant differences in favor of the intervention group for the (weighted) z-scores. Simulated “small”, “medium”, and “large” intervention effects on all modifiable risk factors simultaneously led to mean between-group differences in the total original LIBRA index of -0.19, -0.31 and -0.52 points, respectively and in the z-score version of -0.03, -0.07 and -0.15 standard deviations respectively (Table 3).
4. Discussion
This work shows that the CAIDE dementia risk score and the LIBRA index, although not designed as outcome measures, are responsive to 1.5-2 year multidomain interventions. However, overall changes on the original scores are modest even when simulating very large intervention effects. Such intervention effects brought about between-group differences of up to 0.24 standard deviations in Z-score versions of the risk Z-scores, however, which could translate into substantial effects at the population level.
It is uncertain how intervention effects on dementia risk scores translate into effects on long-term dementia incidence rates. A 20-year dementia risk prediction equation for the CAIDE score was developed in the original Finnish CAIDE cohort.15 Applying this formula to the intervention effects on the CAIDE score described in Table 3, the intervention effects on estimated 20-year dementia risk in the MAPT, preDIVA and HATICE trials were -0.17%, -0.31% and -0.20%, respectively (more
information in Supplementary Table 5). When we simulated intervention effects on the components of the CAIDE score in the preDIVA population, results suggested that 0.2% to 0.9% (depending on the strength of the intervention) of dementia cases could be prevented in this population in the 20 years following the intervention (Table 3). However, these estimates should be interpreted cautiously since
14 this equation has not been validated in the older multinational populations studied here, and they assume that short-term benefits of lifestyle interventions remain apparent after long-term follow-up. Furthermore, the predictive ability, in terms of absolute dementia risk, of the LIBRA index, and any modified scoring systems used for the CAIDE or LIBRA scores, is not yet known. Extended follow-up data from lifestyle intervention trials measuring long-term (>10 years) dementia incidence could help to determine whether or not reduction of dementia risk scores after an intervention actually results in lower dementia incidence over time. Further work is also required to improve and validate the alternative scoring systems proposed here (and any others that may be proposed), since they were only designed as a proof of principle. For example, the clinical meaningfulness of small changes in these alternative scoring systems, at both the individual and population level, and their ability to predict dementia, needs to be assessed.
Although dementia risk scores show promise as outcome measures for multidomain dementia prevention trials, their use is not without challenges. First, the strongest predictors of dementia in the risk scores, such as age and educational level, are not amenable to change.15,17,28 Second,
whereas the non-modifiable risk factors (age, gender, educational level) included in the risk scores can often be objectively established, many of the modifiable risk factors (e.g. physical or cognitive activity or diet) are relatively subjective and therefore more susceptible to measurement error. Third, whether improving risk scores actually results in lower dementia incidence is still unknown. Indeed the premise of lifestyle interventions for dementia prevention, assumes that observed associations between lifestyle risk factors and dementia are causal, but this cannot be proven beyond doubt based on existing evidence.27 Notably, though there is accumulating evidence that many vascular and lifestyle related risk factors are related to neurodegeneration, 29,30 and amyloid deposition,31 there is so far no consistent evidence from randomized controlled trials that interventions targeting lifestyle related risk factors have any effect on dementia incidence.4 Nonetheless, the problem is difficult to overcome since, it is difficult to directly prove an effect on dementia incidence, since one would need
15 a very long follow-up duration, thus rendering the need for dementia risk scores as intermediate outcomes.
Our study is limited by a lack of data for certain risk factors in some risk scores of interest, and by differential data availability across datasets for the LIBRA score (Supplementary Table 2).
Furthermore, we did not have long-term data on dementia incidence. However, it is strengthened by using data from three recent large multidomain prevention trials conducted in populations with varying levels of dementia risk recruited across several countries. To our knowledge, it is the first study to evaluate the use of dementia risk scores as outcome measures from a methodological point of view, and to propose alternative scoring systems which may be more suitable for this context.
In conclusion, scores designed to predict dementia risk are responsive to multidomain interventions. However, overall changes and between-group differences on original scores are small, although statistically significant in large sample sizes. Due to the binary character of most variables in the original risk scores, large improvements may go unnoticed, and small improvements may have major impacts on overall scores, questioning the validity of use of these prediction scores as surrogate outcomes in dementia prevention trials. Using risk scores based on continuous, rather than categorical, measures of risk factors theoretically increases the potential to detect important intervention effects on risk factors which do not cross categorical cut-points, and indeed, in the simulation models the z-score versions were capable of picking up intervention effects that were present. Dementia risk scores and their z-score versions show potential as surrogate outcomes, but how changes in risk scores affect dementia and cognitive decline remains to be determined.
16 The research leading to these results has received funding from the European Union’s Horizon 2020 research and innovation programme under grant agreement no 779238 and the National Key R&D Programme of China (2017YFE0118800)
The MAPT study was supported by grants from the Gérontopôle of Toulouse, the French Ministry of Health (PHRC 2008, 2009), Pierre Fabre Research Institute (manufacturer of the omega-3
supplement), Exhonit Therapeutics SA, and Avid Radiopharmaceuticals Inc. The promotion of this study was supported by the University Hospital Center of Toulouse. The data sharing activity was supported by the Association Monegasque pour la Recherche sur la maladie d’Alzheimer (AMPA) and the UMR 1027 Unit INSERM-University of Toulouse III.
The preDIVA Trial was supported by the Dutch Ministry of Health, Welfare and Sports (grant number 50-50110-98-020), the Dutch Innovation Fund of Collaborative Health Insurances (grant number 05-234), and Netherlands Organisation for Health Research and Development (grant number 62000015).
HATICE (www.hatice.eu) is a collaborative project co-funded by the European Union’s Seventh Framework Program (FP7, 2007- 2013), under grant agreement No 305374. The funders of the study had no role in study design, data collection, data analysis, data interpretation, or writing of the report.
Consortia/study group memberss: PRODEMOS
The members of the PRODEMOS consortium are: Edo Richard, Pim van Gool, Eric Moll van Charante, Marieke Hoevenaar-Blom, Esmé Eggink, Melanie Hafdi (Academic Medical Center, University of Amsterdam, Amsterdam, The Netherlands); Carol Brayne, Linda Barnes, Rachael Brooks (University of Cambridge, Cambridge, UK); Wei Wang, Wenzi Wang, Youxin Wang, Manshu Song (Capital Medical
17 Univesity, Beiging, China); Anders Wimo, Ron Handels (Karolinska Institutet, Stockholm, Sweden); Sandrine Andrieu, Nicola Coley (INSERM UMR1027, Toulouse France); Harm van Marwijk , Elizabeth Ford, Shanu Sadhwani (University of Sussex, Brigton, UK); Jean Georges, Cindy Birk (Alzheimer Europe, Luxembourg); Bram van de Groep, Mark van der Meijden (Vital Health Software, Ede, the Netherlands)
MAPT/DSA
MAPT Study Group - Principal investigator: Bruno Vellas (Toulouse); Coordination: Sophie Guyonnet ; Project leader: Isabelle Carrié ; CRA: Lauréane Brigitte ; Investigators: Catherine Faisant, Françoise Lala, Julien Delrieu, Hélène Villars ; Psychologists: Emeline Combrouze, Carole Badufle, Audrey Zueras ; Methodology, statistical analysis and data management: Sandrine Andrieu, Christelle Cantet, Christophe Morin; Multidomain group: Gabor Abellan Van Kan, Charlotte Dupuy, Yves Rolland (physical and nutritional components), Céline Caillaud, Pierre-Jean Ousset (cognitive component), Françoise Lala (preventive consultation). The cognitive component was designed in collaboration with Sherry Willis from the University of Seattle, and Sylvie Belleville, Brigitte Gilbert and Francine Fontaine from the University of Montreal.
Co-Investigators in associated centres : Jean-François Dartigues, Isabelle Marcet, Fleur Delva, Alexandra Foubert, Sandrine Cerda (Bordeaux); Marie-Noëlle-Cuffi, Corinne Costes (Castres); Olivier Rouaud, Patrick Manckoundia, Valérie Quipourt, Sophie Marilier, Evelyne Franon (Dijon); Lawrence Bories, Marie-Laure Pader, Marie-France Basset, Bruno Lapoujade, Valérie Faure, Michael Li Yung Tong, Christine Malick-Loiseau, Evelyne Cazaban-Campistron (Foix); Françoise Desclaux, Colette Blatge (Lavaur); Thierry Dantoine, Cécile Laubarie-Mouret, Isabelle Saulnier, Jean-Pierre Clément, Marie-Agnès Picat, Laurence Bernard-Bourzeix, Stéphanie Willebois, Iléana Désormais, Noëlle Cardinaud (Limoges); Marc Bonnefoy, Pierre Livet, Pascale Rebaudet, Claire Gédéon, Catherine Burdet, Flavien Terracol (Lyon), Alain Pesce, Stéphanie Roth, Sylvie Chaillou, Sandrine Louchart (Monaco); Kristelle Sudres, Nicolas Lebrun, Nadège Barro-Belaygues (Montauban); Jacques Touchon,
18 Karim Bennys, Audrey Gabelle, Aurélia Romano, Lynda Touati, Cécilia Marelli, Cécile Pays
(Montpellier); Philippe Robert, Franck Le Duff, Claire Gervais, Sébastien Gonfrier (Nice); Yannick Gasnier and Serge Bordes, Danièle Begorre, Christian Carpuat, Khaled Khales, Jean-François Lefebvre, Samira Misbah El Idrissi, Pierre Skolil, Jean-Pierre Salles (Tarbes).
MRI group: Carole Dufouil (Bordeaux), Stéphane Lehéricy, Marie Chupin, Jean-François Mangin, Ali Bouhayia (Paris); Michèle Allard (Bordeaux); Frédéric Ricolfi (Dijon); Dominique Dubois (Foix); Marie Paule Bonceour Martel (Limoges); François Cotton (Lyon); Alain Bonafé (Montpellier); Stéphane Chanalet (Nice); Françoise Hugon (Tarbes); Fabrice Bonneville, Christophe Cognard, François Chollet (Toulouse).
PET scans group: Pierre Payoux, Thierry Voisin, Julien Delrieu, Sophie Peiffer, Anne Hitzel, (Toulouse); Michèle Allard (Bordeaux); Michel Zanca (Montpellier); Jacques Monteil (Limoges); Jacques Darcourt (Nice).
Medico-economics group: Laurent Molinier, Hélène Derumeaux, Nadège Costa (Toulouse). Biological sample collection: Bertrand Perret, Claire Vinel, Sylvie Caspar-Bauguil (Toulouse). Safety management : Pascale Olivier-Abbal
DSA (Data Sharing Alzheimer) Group - Sandrine Andrieu, Christelle Cantet, Nicola Coley
HATICE
The members of the HATICE group are: Edo Richard, Pim van Gool, Eric Moll van Charante, Cathrien Beishuizen, Susan Jongstra, Tessa van Middelaar, Lennard van Wanrooij, Marieke Hoevenaar-Blom (Academic Medical Center, University of Amsterdam, Amsterdam, The Netherlands); Hilkka Soininen, Tiia Ngandu, Mariagnese Barbera (University of Eastern Finland, Kuopio, Finland); Miia Kivipelto, Francesca Mangiasche (Karolinska Institutet, Stockholm, Sweden); Sandrine Andrieu
Nicola Coley, Juliette Guillemont (INSERM-Toulouse University UMR1027, Toulouse, France); Yannick Meiller (Novapten, Paris, France); Bram van de Groep (Vital Health Software, Ede, the Netherlands); Carol Brayne (University of Cambridge, Cambridge, UK).
19 PreDIVA
The members of the preDIVA group are: Eric P. Moll van Charante, Edo Richard, Lisa S. Eurelings, Jan-Willem van Dalen, Suzanne A. Ligthart, Emma F. van Bussel, Marieke P. Hoevenaar-Blom, Marinus Vermeulen, Willem A. van Gool (Amsterdam Medical Centre, Amsterdam, the Netherlands) We are indebted to all practice nurses delivering the intervention and all general practitioners involved in the care for the participants, including the ‘Zorggroep Almere’. We particularly thank our project
manager C.E. Miedema for her outstanding role in coordinating the trial. We acknowledge the efforts of the interim committee members (Dr. A. de Craen†, Prof. N. de Wit and Prof. J. Stam). We thank the members of the independent outcome adjudication committee.
20 References
1. Global Burden of Disease Dementia Collaborators. Global, regional, and national burden of Alzheimer's disease and other dementias, 1990-2016: a systematic analysis for the Global Burden of Disease Study 2016. Lancet Neurol 2019; 18(1): 88-106.
2. Gauthier S, Albert M, Fox N, et al. Why has therapy development for dementia failed in the last two decades? Alzheimers Dement 2016; 12(1): 60-4.
3. Livingston G, Sommerlad A, Orgeta V, et al. Dementia prevention, intervention, and care. Lancet 2017.
4. Andrieu S, Coley N, Lovestone S, Aisen PS, Vellas B. Prevention of sporadic Alzheimer's disease: lessons learned from clinical trials and future directions. Lancet Neurol 2015; 14(9): 926-44. 5. European Medicines Agency CfMPfHUC. Guideline on the clinical investigation of medicines for the treatment of Alzheimer’s disease (CPMP/EWP/553/95 Rev. 1), 2018.
6. Keyserling TC, Sheridan SL, Draeger LB, et al. A comparison of live counseling with a web-based lifestyle and medication intervention to reduce coronary heart disease risk: a randomized clinical trial. JAMA Intern Med 2014; 174(7): 1144-57.
7. Ma J, Berra K, Haskell WL, et al. Case management to reduce risk of cardiovascular disease in a county health care system. Arch Intern Med 2009; 169(21): 1988-95.
8. Salisbury C, O'Cathain A, Thomas C, et al. Telehealth for patients at high risk of cardiovascular disease: pragmatic randomised controlled trial. BMJ 2016; 353: i2647.
9. Andrieu S, Guyonnet S, Coley N, et al. Effect of long-term omega 3 polyunsaturated fatty acid supplementation with or without multidomain intervention on cognitive function in elderly adults with memory complaints (MAPT): a randomised, placebo-controlled trial. Lancet Neurol 2017; 16(5): 377-89.
10. Moll van Charante EP, Richard E, Eurelings LS, et al. Effectiveness of a 6-year multidomain vascular care intervention to prevent dementia (preDIVA): a cluster-randomised controlled trial. Lancet 2016; 388(10046): 797-805.
21 11. Richard E, Jongstra S, Soininen H, et al. Healthy Ageing Through Internet Counselling in the Elderly: the HATICE randomised controlled trial for the prevention of cardiovascular disease and cognitive impairment. BMJ Open 2016; 6(6): e010806.
12. Stephan BC, Kurth T, Matthews FE, Brayne C, Dufouil C. Dementia risk prediction in the population: are screening models accurate? Nat Rev Neurol 2010; 6(6): 318-26.
13. Tang EY, Harrison SL, Errington L, et al. Current Developments in Dementia Risk Prediction Modelling: An Updated Systematic Review. PLoS One 2015; 10(9): e0136181.
14. Stephan BC, Tang E, Muniz-Terrera G. Composite risk scores for predicting dementia. Curr Opin Psychiatry 2016; 29(2): 174-80.
15. Kivipelto M, Ngandu T, Laatikainen T, Winblad B, Soininen H, Tuomilehto J. Risk score for the prediction of dementia risk in 20 years among middle aged people: a longitudinal, population-based study. Lancet Neurol 2006; 5(9): 735-41.
16. Schiepers OJG, Kohler S, Deckers K, et al. Lifestyle for Brain Health (LIBRA): a new model for dementia prevention. Int J Geriatr Psychiatry 2018; 33(1): 167-75.
17. Anstey KJ, Cherbuin N, Herath PM. Development of a new method for assessing global risk of Alzheimer's disease for use in population health approaches to prevention. Prev Sci 2013; 14(4): 411-21.
18. Barnes DE, Beiser AS, Lee A, et al. Development and validation of a brief dementia screening indicator for primary care. Alzheimers Dement 2014; 10(6): 656-65 e1.
19. Walters K, Hardoon S, Petersen I, et al. Predicting dementia risk in primary care:
development and validation of the Dementia Risk Score using routinely collected data. BMC Med 2016; 14: 6.
20. Li J, Ogrodnik M, Devine S, Auerbach S, Wolf PA, Au R. Practical risk score for 5-, 10-, and 20-year prediction of dementia in elderly persons: Framingham Heart Study. Alzheimers Dement 2018; 14(1): 35-42.
22 21. Anstey KJ, Bahar-Fuchs A, Herath P, et al. Body brain life: A randomized controlled trial of an online dementia risk reduction intervention in middle-aged adults at risk of Alzheimer's disease. Alzheimers Dement (N Y) 2015; 1(1): 72-80.
22. O'Donnell CA, Browne S, Pierce M, et al. Reducing dementia risk by targeting modifiable risk factors in mid-life: study protocol for the Innovative Midlife Intervention for Dementia Deterrence (In-MINDD) randomised controlled feasibility trial. Pilot Feasibility Stud 2015; 1: 40.
23. Kim S, McMaster M, Torres S, et al. Protocol for a pragmatic randomised controlled trial of Body Brain Life-General Practice and a Lifestyle Modification Programme to decrease dementia risk exposure in a primary care setting. BMJ Open 2018; 8(3): e019329.
24. Anstey KJ, Cherbuin N, Herath PM, et al. A self-report risk index to predict occurrence of dementia in three independent cohorts of older adults: the ANU-ADRI. PLoS One 2014; 9(1): e86141. 25. Exalto LG, Quesenberry CP, Barnes D, Kivipelto M, Biessels GJ, Whitmer RA. Midlife risk score for the prediction of dementia four decades later. Alzheimers Dement 2014; 10(5): 562-70.
26. Licher S, Yilmaz P, Leening MJG, et al. External validation of four dementia prediction models for use in the general community-dwelling population: a comparative analysis from the Rotterdam Study. Eur J Epidemiol 2018.
27. Deckers K, van Boxtel MP, Schiepers OJ, et al. Target risk factors for dementia prevention: a systematic review and Delphi consensus study on the evidence from observational studies. Int J Geriatr Psychiatry 2015; 30(3): 234-46.
28. Vos SJB, van Boxtel MPJ, Schiepers OJG, et al. Modifiable Risk Factors for Prevention of Dementia in Midlife, Late Life and the Oldest-Old: Validation of the LIBRA Index. J Alzheimers Dis 2017; 58(2): 537-47.
29. Rovio S, Spulber G, Nieminen LJ, et al. The effect of midlife physical activity on structural brain changes in the elderly. Neurobiol Aging 2010; 31(11): 1927-36.
23 30. Akinyemi RO, Mukaetova-Ladinska EB, Attems J, Ihara M, Kalaria RN. Vascular risk factors and neurodegeneration in ageing related dementias: Alzheimer's disease and vascular dementia. Curr Alzheimer Res 2013; 10(6): 642-53.
31. Gottesman RF, Schneider AL, Zhou Y, et al. Association Between Midlife Vascular Risk Factors and Estimated Brain Amyloid Deposition. JAMA 2017; 317(14): 1443-50.
32. Solomon A, Levalahti E, Antikainen R, et al. Effects of a multidomain lifestyle intervention on overall risk for dementia: the FINGER randomized controlled trial. Alzheimers Dement 2018; 14(7): P1024-P5.
24 Tables and figures
Table 1: Ratings of relevant criteria for the choice of a risk score outcome measure for dementia prevention trials for the 6 risk scores identified in the literature review
Criteria
Subjective rating/5
References for rating justification
CAIDE LIBRA ANU-ADRI BDSI DRS FDRS
Dementia prediction based on midlife data 5 4 4 0 1 1 CAIDE:
15
; LIBRA: 16,27; ANU-ADRI: 17,24; BDSI: 18; DRS: 19; FDRS: 20
External validation 5 2 3 2 1 0 CAIDE:
24-26
; LIBRA: 28; ANU-ADRI: 24,26; BDSI: 18,26; DRS: 19,26; FDRS: 20
Overall predictive accuracy 2 1 3 4 4 0 CAIDE:
24-26
; LIBRA: 28; ANU-ADRI: 24,26; BDSI: 18,26; DRS: 19,26; FDRS: 20
Importance of modifiable factors in total score 3 4 3 1 2 1 CAIDE
15
; LIBRA 16; ANU-ADRI: 17,24; BDSI:
18
; DRS: 19; FDRS: 20
Validation as an RCT outcome measure 0 0 0 0 0 0
Use in RCTs as an outcome measure 3 2 4 0 0 0 CAIDE: 11,32; LIBRA: 22; ANU-ADRI: 21,23
Average rating 3 2 2 1 1 0
Subjective ratings for each of the criteria range from 0 (absence of evidence) to 5 (consistent strong evidence).
ANU-ADRI: Australian National University AD Risk Index; BDSI: Brief Dementia Screening Indictor; CAIDE: Cardiovascular Risk Factors, Aging and Incidence of Dementia; DRS: Dementia Risk Score; FDRS: Framingham Dementia Risk score; LIBRA: Lifestyle for Brain Health
25 Table 2. Effect of the interventions on selected dementia risk scores (original and modified scoring systems)
Baseline mean (SE) Follow-up mean (SE)
MD in change intervention vs
control
P-value
NC NI Control Intervention Control Intervention (95%-CI)
CAIDE Original MAPT 754 767 7.4 (0.16) 7.4 (0.16) 7.4 (0.17) 7.3 (0.17) -0.16 (-0.34, 0.02) 0.08 preDIVA 858 1022 8.5 (0.06) 8.7 (0.05) 8.4 (0.06) 8.4 (0.06) -0.19 (-0.32, -0.06) 0.008 HATICE 1175 1139 9.2 (0.06) 9.3 (0.06) 9.1 (0.06) 9.1 (0.06) -0.11 (-0.23, 0.00) 0.05 z-scorea MAPT 754 767 -0.02 (0.04) 0.02 (0.04) -0.03 (0.05) -0.08 (0.05) -0.09 (-0.15, -0.04) 0.001 preDIVA 858 1022 0.00 (0.02) -0.00 (0.02) -0.07 (0.02) -0.10 (0.02) -0.03 (-0.07, 0.01) 0.10 HATICE 1175 1139 -0.01 (0.02) 0.01 (0.02) -0.01 (0.02) -0.05 (0.01) -0.05 (-0.08, -0.02) 0.002 Weighted z-scorea MAPT 754 767 -0.01 (0.05) 0.03 (0.05) -0.04 (0.05) -0.07 (0.05) -0.07 (-0.12, -0.02) 0.006 preDIVA 858 1022 -0.00 (0.02) 0.00 (0.02) -0.09 (0.02) -0.13 (0.02) -0.05 (-0.09, -0.01) 0.03 HATICE 1175 1139 -0.01 (0.02) 0.01 (0.02) -0.03 (0.02) -0.06 (0.02) -0.04 (-0.07, -0.01) 0.004 LIBRAb Original MAPT 773 769 2.80 (0.12) 2.82 (0.12) 2.84 (0.13) 2.76 (0.13) -0.09 (-0.29, 0.11) 0.37 preDIVA 792 885 3.5 (0.07) 3.5 (0.07) 3.7 (0.08) 3.6 (0.07) -0.15 (-0.29, -0.02) 0.02 HATICE 1080 1051 3.7 (0.08) 3.7 (0.08) 3.5 (0.08) 3.4 (0.08) -0.02 (-0.20, 0.16) 0.84 z-score MAPT 750 762 -0.01 (0.03) 0.00 (0.03) 0.00 (0.03) -0.04 (0.03) -0.05 (-0.10, -0.01) 0.03 preDIVA 792 885 0.03 (0.01) 0.03 (0.01) 0.04 (0.01) 0.02 (0.01) -0.01 (-0.04, 0.01) 0.33 HATICE 1080 1051 0.03 (0.01) 0.03 (0.01) 0.04 (0.01) 0.02 (0.01) -0.02 (-0.04, -0.00) 0.03 Weighted z-score
26
MAPT 750 762 -0.01 (0.03) 0.00 (0.03) 0.00 (0.04) -0.04 (0.03) -0.05 (-0.09, -0.01) 0.03 preDIVA 792 885 0.02 (0.01) 0.02 (0.01) 0.01 (0.01) 0.00 (0.01) -0.02 (-0.04, 0.01) 0.14 HATICE 1080 1051 0.02 (0.01) 0.02 (0.01) 0.03 (0.01) 0.02 (0.01) -0.02 (-0.04, -0.01) 0.01
NI=number of individuals in intervention group; NC=number of individuals in control group; CAIDE= cardiovascular risk factors, ageing and incidence of dementia; LIBRA = Lifestyle for Brain Health index; MD = mean difference
For MAPT, mean (SE) are estimated from a mixed model using 3 measurement times; For PREDIVA and HATICE, mean (SE) are calculated from the observed data. All mean differences are adjusted for baseline score, and for preDIVA, analyses accounted for clustering of participants within practices and healthcare centers
a For the 4 modifiable risk factors; b The LIBRA index is based on 6 available risk factors for MAPT (total (original) score range: 0 to 8.9), 10 for PREDIVA (total (original) score range: -1 to 12.7), and 11 for HATICE (total (original) score range: -4.2 to 11.6). See Supplementary Table 3 for further details.
27 Table 3. Simulation of translation of intervention effects on individual risk factors on CAIDE, on 20 year dementia
risk (according to CAIDE) and on LIBRA based on 500 bootstraps of the control group of the preDIVA data
Intervention Effect on Risk Factorsb Effectb on CAIDE Effect on 20 year dementia riskc based on CAIDE score (%)
Effectb on LIBRA
Small effect in at-risk groupsa
SBP = -2 mmHg -0.06 (-0.23 to 0.12) -0.10 (-0.41 to 0.23) - 0.01 (-0.21 to 0.20) BMI = -0.25 kg/m2 - 0.03 (-0.19 to 0.15) -0.07 (-0.38 to 0.25) -0.02 (-0.22 to 0.17) Total Chol = - 0.2 mmol/L -0.02 (-0.20 to 0.13) -0.06 (-0.36 to 0.27) -0.02 (-0.22 to 0.18) Alcohol = - 1 unit/wk N/A N/A -0.10 (-0.22 to 0.03) GDS = - 1 N/A N/A - 0.01 (-0.23 to 0.18) GFR = +2 N/A N/A -0.10 (-0.30 to 0.08) Physical activity + 0.5 hr/wk 0.00 (-0.17 to 0.16) -0.02 (-0.33 to 0.31) 0.00 (-0.21 to 0.21)
combined effect -0.11 (-0.28 to 0.06) -0.20 (-0.53 to 0.12) -0.19 (-0.40 to 0.00) combined effect on z-score -0.05 (-0.10 to 0.00) N/A -0.03 (-0.07 to 0.00)
Medium effect in at-risk groupsa
SBP = -4 mmHg -0.13 (-0.32 to 0.04) -0.21 (-0.51 to 0.13) 0.05 (-0.24 to 0.18) BMI = -0.5 kg/m2 -0.06 (-0.26 to 0.11) -0.15 (-0.49 to 0.17) -0.05 (-0.25 to 0.16) Total Chol = - 0.4 mmol/L -0.04 (-0.24 to 0.14) -0.08 (-0.38 to 0.24) -0.04 (-0.25 to 0.16) Alcohol = - 2 unit/wk N/A N/A -0.09 (-0.28 to 0.13) GDS = - 2 N/A N/A -0.04 (-0.25 to 0.16) GFR = +4 N/A N/A -0.02 (-0.20 to 0.17) Physical activity + 1 hr/wk -0.01 (-0.18 to 0.15) -0.02 (-0.34 to 0.29) 0.00 (-0.20 to 0.22)
combined effect -0.25 (-0.42 to -0.08) -0.46 (-0.78 to -0.18) -0.31 (-0.53 to -0.09) combined effect on z-score -0.11 (-0.16 to -0.06) N/A -0.07 (-0.10 to -0.03)
Large effect in at-risk groupsa
SBP = -8 mmHg -0.29 (-0.47 to -0.10) -0.47 (-0.78 to -0.15) -0.09 (-0.29 to 0.13) BMI = -1 kg/m2 -0.11 (-0.28 to 0.06) -0.26 (-.03 to 0.08) -0.08 (-0.31 to 0.11) Total Chol = -1mmol/L -0.07 (-0.22 to 0.09) -0.17 (-0.47 to 0.17) -0.08 (-0.28 to 0.13) Alcohol = - 4 unit/wk N/A N/A -0.08 (-0.28 to 0.13) GDS = - 3 N/A N/A -0.06 (-0.26 to 0.16) GFR = +8 N/A N/A -0.08 (-0.29 to 0.10) Physical activity + 2 hr/wk -0.03 (-0.20 to 0.14) -0.08 (-0.40 to 0.26) -0.04 (-0.24 to 0.18)
combined effect -0.50 (-0.67 to -0.32) -0.88 (-1.18 to -0.59) -0.52 (-0.75 to -0.33) combined effect on z-score -0.24 (-0.29 to -0.19) N/A -0.15 (-0.18 to -0.11)
CAIDE= cardiovascular risk factors, ageing and incidence of dementia; LIBRA = Lifestyle for Brain Health index; SBP = systolic blood pressure; BMI = body mass index; Chol = cholesterol; GDS = geriatric depression score; GFR = glomerular filtration rate
a The effect on SBP only in those with baseline hypertension, on BMI only in those with baseline BMI >25, on total cholesterol only in those with baseline total cholesterol > 6.5, on alcohol only in men with baseline consumption of > 14 units per week and women with > 7 units per week, on GDS only in those with baseline GDS >5, on physical activity only in those inactive (according to WHO guidelines) at baseline. There was no appreciable difference in effect if the intervention was carried out in all participants due to the fact that if you have no risk, no improvement can be made. Also there was no appreciable difference on z-score or weighted z-score.
b
Effect is defined as the mean difference in change between intervention and control groups
c see Supplementary Table 5 for details of calculation and for estimated 20-year risk at baseline in the preDIVA population (on which the simulations were based)
28 Figure 1. Responsiveness of the original versions of the a) CAIDE and b) LIBRA scores: percentage of participants undergoing the specified amount of change between baseline and 18-24 months of follow up in the intervention groups of the MAPT, preDIVA and HATICE trials. Theoretical range of changes in CAIDE: -7 to 7 points; LIBRA: -12.7 to 12 .7 points in MAPT (score based on 9-items), -13.7 to 13.7 in PREDIVA (score based on 11 items), -17.5 to 17.5 in HATICE (score based on 12 items). A decrease in either risk score represents a decrease in dementia risk.
29 Figure 2. Responsiveness of individual components of the LIBRA and CAIDE (modifiable components only) scores: change in score of the individual components between baseline and 18-24 months of follow up in the intervention groups of the MAPT, preDIVA and HATICE trials. An increase in score for both the CAIDE and LIBRA scores represents an increase in projected dementia risk. Analyses include only participants for whom a total score could be calculated at baseline and follow-up (i.e. with no missing data for any of the score’s components)
30
Figure 3:
Change from baseline to 18-24m follow-up in original scores compared to change inz-scores in the intervention groups for a) CAIDE in MAPT, b) LIBRA in MAPT, c) CAIDE in preDIVA, d) LIBRA in preDIVA, e) CAIDE in HATICE, f) LIBRA in HATICE
Theoretical range of changes in original scores: CAIDE: -7 to 7 points in all trials; LIBRA: -12.7 to 12 .7 points in MAPT (score based on 9-items), -13.7 to 13.7 in PREDIVA (score based on 11 items), -17.5
31
to 17.5 in HATICE (score based on 12 items). A decrease in either risk score represents a decrease in dementia risk. See Supplementary Table 3 for details of score calculation.
Correlation coefficients for changes from baseline to 18-24m follow-up in the original and z-score versions are as follows: a) CAIDE in MAPT (r2= 0.51) b) LIBRA in MAPT (r2= 0.51) c) CAIDE in preDIVA (r2= 0.46) d) LIBRA in preDIVA (r2= 0.29) e) CAIDE in HATICE(r2= 0.56) f) LIBRA in HATICE (r2= 0.53)
32 Supplementary material
Supplementary table 1: Main trial design features and selected baseline characteristics
MAPT preDIVA HATICE
Trial design features
Year started 2008 2006 2015 Year completed 2014 2015 2018 Sample size (country) 1679 (France) 3526 (Netherlands) 2724
(Netherlands, France, Finland) Intervention and control
conditions
Multidomain intervention (cognitive training, physical activity, nutrition counselling, preventive consultation) + placebo
Multidomain intervention + omega-3 supplement Omega-3 supplement versus Placebo Nurse-led multidomain cardiovascular care versus Usual care
Coach-supported interactive internet platform to encourage self-management of cardiovascular risk factors
versus Static internet platform
Intervention duration (years) 3 6-8 1.5
Primary outcome Change in cognitive function Dementia, disability Composite score of BMI, SBP, and LDL
cholesterol Main secondary outcomes Functional status, physical status,
depression, dementia, health resources utilization
Cardiovascular events, change in cognitive
function
Cardiovascular events, individual risk factors, diet, physical activity, smoking, cognitive
functioning Main eligibility criteria - Age 70+
- Spontaneous memory complaint, and/or limitations in one instrumental activity of daily living, and/or slow gait speed - Free of dementia
- Age 70-78 - Free of dementia
- Age 65+
- ≥2 CV risk factors and/or history of CVD - Computer literate
- Free of dementia Participants’ baseline characteristics
33 Age, mean (SD) 75.3 (4.4) 74.3 (2.5) 70.8 (4.7) Men, N(%) 592 (35.3%) 1607 (45.6%) 1427 (52.4%) Level of education, N(%) Low Medium High 85 (5.2%) 839 (51.1%) 719 (44.8%) 836 (23.9%) 1978 (56.7%) 677 (19.4%) 781 (28.7%) 823 (30.2%) 1120 (41.1%)
MMSE, median [IQR] 28 [27-29] 28 [27-29] 29 [28-30]
Presence of dementia risk factors, N(%)* Hypertension Hypercholesterolemia Obesity Physical inactivity Diabetes** CHD Depression Smoking**
Zero or high alcohol intake** Low adherence to
Mediterranean Diet Low cognitive activity
703 (42.2%) 292 (20.2%) 267 (16.0%) 468 (27.9%) 54 (7.1%) N/A 432 (25.9%) 27 (3.6%) 483 (64.1%) N/A N/A 2675 (75.9%) 408 (11.8%) 804 (22.8%) 463 (16.8%) 646 (18.3%) 1044 (29.8%) 328 (9.3%) 468 (13.3%) 2176 (62.1%) N/A N/A 1542 (56.6%) 281 (10.3%) 1016 (37.3%) 921 (33.8%) 602 (22.1%) 536 (19.7%) 35 (12.3%) 202 (7.9%) 1496 (55.0%) 1663 (61.0%) 1875 (68.9%)
CAIDE score, mean (SD)*** 7.3 (1.9) 8.6 (1.8) 9.3 (2.1)
LIBRA index, mean (SD)**** 2.9 (1.7) 3.5(2.1) 3.7 (2.6)
* Hypertension, hypercholesterolemia, obesity and physical inactivity are defined in the same way as for the CAIDE score, and diabetes, renal function, depression, smoking, alcohol intake, Mediterranean diet and cognitive activity are defined in the same way as for the LIBRA index (see supplementary Table 3 for details) ** In MAPT, data are only available for participants receiving the multidomain intervention and attending the baseline preventive consultation (N=758) *** CAIDE score range: 4 to 15 in all trials. Higher scores indicate higher risk of dementia.
**** LIBRA index range: 0 to 8.9 in MAPT (based on 6 items); -1 to 12.7 in preDIVA (based on 11 items); -5.9 to 11.6 in HATICE (based on 12 items). See Supplementary Table 3 for details of score calculation. Higher scores indicate higher risk of dementia.
34 Supplementary Table 2: Original and modified scoring systems, and risk factor definitions, for the CAIDE and LIBRA scores in the MAPT, PREDIVA and HATICE trials
Risk Factor
CAIDE LIBRA
Original score Z-score version Original score Z-score version Points Definition Definition Points Definition Definition
MAPT PREDIVA HATICE MAPT PREDIVA HATICE MAPTa PREDIVA HATICE MAPT a PREDIVA HATICE
Age 0 <47 years [Non-modifiable] 3 47-53 years 4 >53 years Education 0 ≥ high school
diploma ≥10 years Tertiary
[Non-modifiable]
2
Secondary/high school, without high
school diploma 7-9 years Post-secondary non-tertiary 3 ≤ Primary school
certificate 0-6 years Basic
Sex 0 Female [Non-modifiable]
1 Male
Blood pressure
0 SBP ≤140 mmHg
z-score of SBP
0 SBP <140 and DBP <90 and no self-reported
use of antihypertensives z-score of mean of SBP and DBP (medication not taken into account)
2 SBP >140 mmHg 1.6 SBP ≥140 and/or DBP ≥90 and/or
self-reported use of antihypertensives
Cholesterol
0 Total cholesterol ≤6.5 mmol/l
z-score of total cholesterol
0
Total Cholesterol <6.2 mmol/l and no self-reported use of cholesterol-lowering
medication z-score of total cholesterol (medication not taken into account)
2 Total cholesterol >6.5 mmol/l 1.4
Total cholesterol ≥6.2 mmol/l and/or self-reported use of cholesterol-lowering
medication
BMI 0 ≤30 z-score of BMI 0 <30 z-score of BMI
2 >30 1.6 ≥30
Physical activity 0
Fulfilling WHO criteria for physical activity (≥150 minutes/week moderate-intensity or ≥75 minutes/week vigorous-intensity or an
equivalent combination) b
z-score of total min/wk of moderate to vigorous intensity physical activity
(inversely coded, i.e. higher z-score indicates less physical activity and
greater dementia risk) b
0
Fulfilling WHO criteria for physical activity (≥150 minutes/week moderate-intensity or ≥75 minutes/week vigorous-intensity or an
equivalent combination) b
z-score of total min/wk of moderate to vigorous intensity physical activity (inversely coded, i.e. higher z-score indicates less physical activity and
greater dementia risk) b
1
Not fulfilling WHO criteria for physical activity (≥150 minutes/week moderate-intensity or ≥75 minutes/week vigorous-intensity or an
equivalent combination) b
1.1
Not fulfilling WHO criteria for physical activity (≥150 minutes/week moderate-intensity or ≥75 minutes/week vigorous-intensity or an
equivalent combination) b
Diabetes 0 No current diabetes mellitus
c
z-score of current diabetes c,d
35
Risk Factor
CAIDE LIBRA
Original score Z-score version Original score Z-score version Points Definition Definition Points Definition Definition
MAPT PREDIVA HATICE MAPT PREDIVA HATICE MAPTa PREDIVA HATICE MAPT a PREDIVA HATICE
Current renal dysfunction 0 Estimated glomerular filtration rate ≥60 ml/min/1.73 m2 e z-score of estimated glomerular filtration rate e 1.1 Estimated glomerular filtration rate <60 ml/min/1.73 m2 e Coronary heart disease 0 No history of MI or AP c z-score of history MI or AP c,d 1.0 History of MI or AP c Depression 0 GDS-15 <5 z-score of GDS-15 2.1 GDS-15 ≥5
Smoking 0 Not current smoker z-score of current smoking d
1.5 Current smoker
Alcohol
-1 1-14 units/wk for males; 1-7 units/wk for
females
z-score of weekly alcohol units intake (inversely coded, i.e. lower z-score indicates higher alcohol use and lower dementia risk; weekly intakes of
0 were re-coded with a z-score of 1)
0 Other Mediterranean diet 0 Highest 30% of MEDAS score z-score of MEDAS score 1.7 Lowest 70% of MEDAS score Cognitive activity -3.2 Highest 30% of cognitive activity score e z-score of cognitive activity score 0 Lowest 70% of cognitive activity score e TOTAL THEORETICAL SCORE RANGE 4-15
MAPT a: 6-item score: 0 to 8.9 points; 9-item score (intervention group only): -1 to 11.7 points PreDIVA: -1 to 12.7 points
HATICE: -4.2 to 11.6 points
Dark grey shading indicates that the risk factor is not included in the risk score. Light grey shading indicates that the risk factor should be included in the risk score, but that data is not available in the respective trial.
Z-scores were calculated for modifiable risk factors only. Weighted z-scores were calculated using the same risk factor definitions as the unweighted z-scores. a
In MAPT, 3 of the risk factors (diabetes, smoking, alcohol use) were measured in intervention group only, and antihypertensive and cholesterol-lowering medication use were only available in the intervention group. Therefore, a 6-item version of the LIBRA index, in which medication-use was not taken into account, was created for the between-group comparisons; b Measured using Short Minnesota Leisure Time Physical Activity Questionnaire in MAPT, LASA Physical Activity Questionnaire in PREDIVA, and CHAMPS in HATICE; c Self-reported in all studies, and in
36
PREDIVA, additionally cross-checked with electronic health records; d raw data coded 0 for no, 1 for yes; e Estimated from creatinine clearance, as per Levey et al. 2009; f based on hours per week spent using a computer, reading or playing a musical instrument (measured using the CHAMPS questionnaire)
37 Supplementary Table 3. Factors included in the six risk scores identified in the literature review
CAIDE LIBRA ANU-ADRI BDSI DRS FDRS
Socio demographic factors Age ● ● ● ● ● Education ● ● ● Sex ● ● Marital status ●
Local deprivation score ●
Medical factors Blood pressure/hypertension ● ●
Current antihypertensive use ●
Cholesterol ● ● ● (<60y)b
Diabetes ● ● ● ● ●
Current renal dysfunction ●
Coronary heart disease ● ●
Traumatic brain injury ●
Stroke ● ● ●
Cancer ●
Atrial fibrillation ●
Current aspirin use ●
Mood/functional ability
Depression ● ● ● ●
Assistance for money/ medication ●
Lifestyle factors BMIa ● ● ● (<60y)b ● ● ●
Physical activity ● ● ● Smoking ● ● ● Alcohol ● ● ● Mediterranean diet ● (Saturated fat) c (●) Fish intake ● Social engagement ● Cognitive activity ● ●
Other factors Pesticide exposure ●
Calendar year ●
ANU-ADRI: Australian National University AD Risk Index; BDSI: Brief Dementia Screening Indictor; CAIDE: Cardiovascular Risk Factors, Aging and Incidence of Dementia; DRS: Dementia Risk Score; FDRS: Framingham Dementia Risk score; LIBRA: Lifestyle for Brain Health
All risk scores are calculated by categorising risk factors and attributing points to the different categories, except that age and/or BMI are used as continuous variables in the BDSI and DRS.
a
For some scores, high BMI is considered a risk factor, while for others, low BMI is considered a risk factor (usually in older age groups)
b
Only included in the ANU-ADRI score for subjects aged <60 years c
Saturated fat intake is recommended for the LIBRA index, but no relative risk was available to determine a score for this variable
38 Supplementary Table 4. Comparison of baseline characteristics of intervention group subjects included in and excluded from the analyses
MAPT preDIVA HATICE
CAIDE LIBRA CAIDE LIBRA CAIDE LIBRA
Inc. (N=76 7) Exc. (N=70) p Inc. (N=769 ) Exc. (N=68) p Inc. (N= 1880) Exc. (N=1646) P Inc. (N=1664) Exc. (N=1862) p Inc (N=2314) Exc. (N=410) p Inc. (N=2131) Exc. (N=593) p Age, mean (SD) 75.2 (4.3) 75.6 (4.3) 0.455 75.2 (4.3) 75.7 (4.3) 0.349 74.2 (2.4) 74.5 (2.5) 0.001 74.2 (2.4) 74.5 (2.5) <0.001 70.6 (4.5) 71.8 (5.5) <0.001 70.6 (4.6) 71.2(5.0) 0.009 Men, N(%) 272 (35.4) 26 (37.1) 0.779 274 (35.6) 24 (35.3) 0.956 829 (44.1) 778 (47.3) 0.06 742 (44.6) 865 (46.5) 0.28 1214 (52.5) 213 (52.0) 0.89 1122 (52.7) 305 (51.4) 0.63 High education, N(%) 345 (45.0) 19 (30.7) 0.029 342 (44.9) 22 (32.8) 0.057 376 (20.0) 301 (18.7) 0.35 322 (19.5) 355 (19.3) 0.88 1020 (44.1) 100 (24.4) <0.001 952 (44.7) 168 (28.3) <0.001 MMSE, mean (SD) 28.1 (1.6) 27.8 (1.5) 0.065 28.1 (1.6) 27.8 (1.5) 0.042 28.2 (1.7) 28.0 (1.8) <0.001 28.2 (1.7) 28.1 (1.8) 0.03 28.6 (1.4) 28.4 (1.5) 0.08 28.6 (1.4) 28.4 (1.6) 0.001 MMSE: Mini Mental Status Examination
Age and MMSE were non-normally distributed and were therefore compared using non-parametric Mann-Whitney-U tests. Data are nonetheless presented mean (SD) in order to aid interpretation. Categorical variables were compared using chi-squared tests.
39 Supplementary Table 5. Change from baseline in 20-year dementia risk (estimated from CAIDE scores) in the MAPT, preDIVA and HATICE trials
Estimated 20-year dementia risk (%) at baseline
Estimated 20-year dementia risk (%) at follow-up
Change in 20-year dementia
risk (%) Between-group difference in change in risk (%)
Control Intervention Control Intervention Control Intervention
MAPT 2.57 2.55 2.60 2.42 0.03 -0.14 -0.17
preDIVA 3.91 4.22 3.76 3.76 -0.15 -0.46 -0.31
HATICE 5.11 5.31 4.92 4.92 -0.19 -0.39 -0.20
20-year dementia risk was estimated using baseline scores and intervention effects from Table 3, and the following equation (Kivipelto M et al. Lancet Neurol 2006; 5(9): 735-41):