HAL Id: hal-02558609
https://hal.inrae.fr/hal-02558609
Submitted on 4 May 2020
HAL is a multi-disciplinary open access
archive for the deposit and dissemination of
sci-entific research documents, whether they are
pub-lished or not. The documents may come from
teaching and research institutions in France or
abroad, or from public or private research centers.
L’archive ouverte pluridisciplinaire HAL, est
destinée au dépôt et à la diffusion de documents
scientifiques de niveau recherche, publiés ou non,
émanant des établissements d’enseignement et de
recherche français ou étrangers, des laboratoires
publics ou privés.
Distributed under a Creative Commons Attribution - NonCommercial - NoDerivatives| 4.0
International License
population level: a validation and application study in
French adults
Elise Emeville, Camille Lassale, Katia Castetbon, Valérie Deschamps, Benoit
Salanave, Michel Vernay, Dorra Guergour, Patrice Faure, Serge Hercberg,
Pilar Galan, et al.
To cite this version:
Elise Emeville, Camille Lassale, Katia Castetbon, Valérie Deschamps, Benoit Salanave, et al..
Esti-mating sodium intake from spot urine samples at population level: a validation and application study
in French adults. British Journal of Nutrition, Cambridge University Press (CUP), 2019, 122 (2),
pp.186-194. �10.1017/S0007114519000886�. �hal-02558609�
Estimating sodium intake from spot urine samples at population level: a
validation and application study in French adults
Elise Emeville
1, Camille Lassale
2,3, Katia Castetbon
4, Valérie Deschamps
5, Benoît Salanave
5,
Michel Vernay
6, Dorra Guergour
7, Patrice Faure
7,8, Serge Hercberg
5,9,10, Pilar Galan
9,
Emmanuelle Kesse-Guyot
9and Charlotte Verdot
5*
1Observatoire de la Santé de Guadeloupe (ORSaG), Baie-Mahault, France
2Department of Epidemiology and Public Health, University College London, London WC1E 7HB, UK
3Program of Epidemiology and Public Health, Hospital del Mar Medical Research Institute (IMIM), 08024 Barcelona, Spain 4Université libre de Bruxelles, Ecole de Santé Publique, Centre de Recherche en Epidémiologie, Biostatistique, et Recherche
Clinique, B-1070 Bruxelles, Belgium
5Nutrition Surveillance and Epidemiology Team, Santé publique France, University Paris 13, Centre of Research in
Epidemiology and StatisticS (CRESS UMR1153)– University of Paris, Bobigny F-93017, France
6Santé publique France, Regions Division, Saint-Maurice, France
7Platform of Biochemistry, University Hospital of Grenoble, Grenoble F-38700, France 8University Grenoble Alpes, HP2 Laboratory, Grenoble F-38058, France
9Nutritional Epidemiology Research Team, INSERM U1153, INRA U1125, CNAM, University Paris 13, Centre of Research in
Epidemiology and StatisticS (CRESS UMR1153)– University of Paris, Bobigny F-93017, France
10Public Health Department, Avicenne Hospital, University Paris 13, Bobigny F-93017, France
(Submitted 20 November 2018– Final revision received 1 March 2019 – Accepted 5 April 2019; First published online 16 July 2019)
Abstract
The aim of this study was to assess the validity of the predictive INTERSALT equation using spot urine samples to estimate 24-h urinary Na
(24-hUNa) excretion and daily Na intake among the French adult population. Among 193 French adults (‘validation sample’), we assessed
the validity by comparing predicted 24-hUNa excretion from spot urine and measured 24-hUNa excretion from 24-h urine collections.
Spearman correlation coefficients and Bland–Altman plots were used and we calculated calibration coefficients. In a nationally representative
sample of 1720 French adults (‘application sample’), the calibrated predictive equation was then applied to the spot urine Na values to estimate 24-hUNa excretion and daily Na intake. In that sample, predicted Na intake was compared with that estimated from 24-h dietary recalls. Results were adjusted and corrected using calibration coefficients. In the validation sample, the measured 24-hUNa excretion was on average 14 % higher than the predicted 24-hUNa (+13 % for men and +16 % for women). Correlation between measured and predicted 24-hUNa excretion was moderate (Spearman r 0·42), and the Bland–Altman plots showed underestimation at lower excretion level and overestimation at higher
level. In the application study, estimated daily salt intake was 8·0 g/d using dietary recalls, 8·1 g/d using predicted INTERSALT equation and
9·3 g/d after applying calibration coefficients calculated in the validation study. Despite overall underestimation of 24-hUNa excretion by spot urinary Na, the use of predictive INTERSALT equation remains an acceptable alternative in monitoring global Na intake/excreted in the French population but its use is not advised at the individual level.
Key words: Salt intake: Urinary sodium excretion: Spot urine samples: Predictive INTERSALT equation
Na is an essential nutrient, mainly provided by the salt contained in foods and table salt used as condiment. Nevertheless, exces-sive Na consumption has adverse health outcomes, including high blood pressure and an increased risk of CVD and stroke(1–6). The average level of Na consumption has been
estimated to be 3·95 g/d (equivalent to 10 g of salt) in sixty-six countries worldwide(7), which is almost twice as much the
amount recommended by the WHO (<2 g/d of Na)(8).
Therefore, the reduction of population salt intake is a public health priority. However, quantification of discretionary salt (added by individuals) is particularly difficult in diet surveys(9)
and accurate monitoring of salt intake can be challenging. As approximately 90 % of daily Na intake is excreted in the urine throughout the day(10), 24-h urine collection is considered
Abbreviations: 24-hUNa, 24-h urinary Na; ENNS, Etude Nationale Nutrition Santé. * Corresponding author: Dr C. Verdot, emailcharlotte.verdot@univ-paris13.fr
© The Authors 2019
https://www.cambridge.org/core
. Universite Paris Nord 13
, on
20 Aug 2019 at 13:31:20
, subject to the Cambridge Core terms of use, available at
https://www.cambridge.org/core/terms
.
as the‘gold standard’ method for assessing Na consumption(9,11).
However, urine collections over a 24-h period are difficult to obtain, as this method is logistic and cost intensive as well as bur-densome for participants, limiting its use in large-scale surveys and epidemiological studies(12,13). To overcome these
difficul-ties, alternative methods have been proposed, such as the use of spot and timed urine samples, which are easier and cheaper to collect, and better accepted by participants. Thereby, different equations have been developed to predict 24-h urinary Na (24-hUNa) excretion from spot urine samples(14–21). While
most of these studies have been conducted in Asian populations(14,15,21), recent validation studies have shown that
the INTERSALT equation(16)provided the least biased
predic-tions in Western population(18–20). This sex-specific equation
takes into account Na, K and creatinine concentrations from spot urine samples, age, sex, geographical region and BMI of the individuals.
The use of predictive equations from spot urine samples exhibits many advantages and appears promising for monitoring population Na intake, yet this method remains controversial as results differ depending on the studies and populations. Some previous studies concluded, however, that it may be a useful tool for monitoring 24-hUNa excretion at the population level, but predictions perform poorly at the individual level, due to day-to-day within-person and within-day variability of Na excre-tion(13,15,18–25). Therefore, accuracy and suitability of predicting
equations need improvement. Most studies so far have focused on the timing of urine collection and on the benefits of using multiple spot urine samples to produce estimates(16,23,25–29).
Some authors also recommended the use of‘population-specific’ equations or study-specific calibrations against 24-h urine collec-tions to ensure the validity of spot urine samples to predict population Na intake(12,16,22).
Our study has four objectives: (1) validation, whereby predicted 24-hUNa excretion from spot urine obtained by INTERSALT equation is compared with measured 24-hUNa excretion; (2) calibration on French data of the INTERSALT equa-tion; (3) assessment of the original and calibrated INTERSALT equation to assess salt intake of French adults and (4) compari-son of predicted salt intake from spot urine samples with self-reported salt intake from 24-h dietary recalls. Objectives (1) and (2) were conducted in a validation study of 193 healthy volunteers, and objectives (3) and (4) on a nationally represen-tative sample of 1720 French adults.
Methods Validation study
Study population. The study population included volunteers from a randomly selected sample of NutriNet-Santé study partic-ipants, involved in the Dietary Validation Study(30). The
NutriNet-Santé study (ClinicalTrials.gov identifier: NCT03335644) is an ongoing web-based cohort launched in France in 2009, which included volunteers over 18 years old. Details of aims and meth-ods have been described elsewhere(31). The Dietary Validation Study was conducted in 2012–2013 to investigate the validity of a web-based, self-administered dietary record tool against
urinary biomarkers(30). It included a randomly selected sample
of 199 participants of the NutriNet-Santé study, stratified by sex, age (<45 years, >45 years) and educational level (primary and secondary up to some college, university graduate). Participants were excluded if they were pregnant, had a known history of heart failure or diabetes. The sample size was calcu-lated in accordance with the main objective of the Dietary Validation Study, that is 200 participants were needed to detect correlation coefficients greater than or equal to 0·17 at the 5 % significance level and with 80 % power. This sample size was also sufficient to detect a difference of 1 g around a mean of 8 g of salt intake per d compared with an average population of 2000 individuals (at the 5 % significance level and with 80 % power). The protocol of the study was approved by the Consultation Committee for the Protection of Participants in Biomedical Research of Paris Saint-Louis (no. 2011/22) and the French National Information and Citizen Freedom Committee (DR-2012-467). Participants provided written informed consent.
Study design.Data were collected during two visits performed in a clinical centre (Hôtel Dieu Hospital, Paris), both in a fasting state. At the first visit, anthropometric and clinical measurements were taken (height, weight, blood pressure) and participants were given instructions for the 24-h urine collection. Approximately 3 weeks later, a second visit was realised with the same clinical examination. At each of the two visits, a morning fasting spot urine was collected at the clinical centre. Between the two visits, three 24-h dietary records were completed and two 24-h urine samples were collected per participant. More details of material and methods are available elsewhere(30).
24-h urine collection. A written explanation of the 24-h urine collection process was provided to all participants with material necessary for collection. Volunteers were instructed to discard the first urine of the day of collection, and then to collect all urine passed during the next 24 h, including the first urine the following morning. They were given para-aminobenzoic acid pills to take throughout the day to check completeness of the urine collection. Participants had to record the start and finish times of urine collection, the time at which para-aminobenzoic acid pills were taken, any missing void (urine discarded during the collec-tion) and medications taken during the 24-h period. The urine container was kept at room temperature in a dark place. Urine samples were processed less than 12 h after the end of the collec-tion: they were weighed, carefully mixed and aliquoted into 1 ml samples and stored at–80°C. Urinary electrolyte levels in the two 24-h urine collections and in the two spot urine samples were ana-lysed in the laboratory of the biochemistry platform of the University Hospital (CHU) of Grenoble. Na and K concentrations were measured by ion-selective electrodes (Siemens Dimension Vista), and creatinine concentration was measured by alkaline picrate kinetic (Siemens Dimension Vista). The intra-assay CV for all three measures were< 3 %.
Application study
Study sample. The study sample comprised all adults aged 18–74 years included in the French Nutrition and Health
Validation of daily sodium intake estimation 187
https://www.cambridge.org/core
. Universite Paris Nord 13
, on
20 Aug 2019 at 13:31:20
, subject to the Cambridge Core terms of use, available at
https://www.cambridge.org/core/terms
.
Survey (Etude Nationale Nutrition Santé, ENNS). The ENNS is a nationwide survey conducted in 2006–2007 to describe dietary intake, physical activity and nutritional status in a nationally representative sample of adults and children living in France. The protocol was approved by the Ethical Committee (Hôpital Cochin, Paris, no. 2264), the Consultative Committee on Information Treatment of the Ministry of Research and the French Data Protection Authority (authorisation no. 905481). All participants signed informed consents.
Study design.The ENNS is a cross-sectional study using a multi-stage sampling design, already described in detail elsewhere(32).
In brief, data collection included a questionnaire survey, three 24-h dietary recalls and a health examination with clinical and biochemical markers measurements for each participant. Social and demographic characteristics and physical activity were collected at home via face-to-face interview. Clinical (height, weight, blood pressure) and biochemical markers mea-surements were collected at health examination centres of National Health Insurance system, or at home with a nurse (if subjects did not want to go to a health centre). Recruitment was carried out for 1 year to take into account the seasonality of the diet.
Dietary recalls. Dietary intake was assessed using three non-consecutive 24-h dietary recalls, one of them being during the weekend, randomly distributed within a period of 2 weeks. Trained dietitians asked participants to describe everything they ate or drank the day before the interview, from midnight to midnight. Subjects gave information according to a precise and standard methodology detailed elsewhere(32). Information
on discretionary salt (added in cooking or at the table) was spe-cifically collected, that is a summary of all food items consumed was provided, which participants had to review and describe if additional salt was consumed, and if so, in what quantity (house-hold units or g).
Urine samples.On the day of health examination, participants were asked to collect first-morning urine and store it at +4°C. Samples were then carried up to the field laboratories within 4 h after collection in frozen containers and stored at –80°C until their transport to central laboratory at the end of the fieldwork. Na, K and creatinine concentrations were measured in the same laboratory using the same methods and materials as for the validation study. The intra-assay CV for all three measures were < 3 %.
Statistical methods
Covariates. BMI was calculated as weight (kg)/height2(m2).
The reference values used to define BMI classes (underweight <18·5 kg/m2, normal 18·5–24·9 kg/m2, overweight 25·0–29·9
kg/m2and obese≥30·0 kg/m2) were those recommended by
the WHO(33). Tobacco status was categorised as: never smoke,
former smoker and current smoker; alcohol use as abstainers and consumers (even occasional) and educational level as low (up to high school), medium (some college) and high (uni-versity graduate).
Characteristics of participants in the validation study were compared using t tests orχ2tests, as appropriate. Analyses in
the application study (ENNS) were weighted taking into account individual probabilities of inclusion, seasonal period of data collection and calibration based on national census data. Characteristics of participants in the application study were compared using tests for complex survey designs: t tests for continuous variables (adjusted Wald F statistic) andχ2tests for
frequencies (Rao and Scott second-order corrected Pearson statistic).
Validation study. Twenty-four-hour urine collections were determined as valid if collection time was between 22 and 26 h, urine volume was≥ 500 ml, estimated volume missed void was less than 5 % of the total volume and creatinine was>10 mg/kg for women or>15 mg/kg for men.
The mean 24-hUNa excretion (mmol/d) from the two 24-h urine collections and the mean Na, K and creatinine concentra-tions (mmol/l) from the two spot samples were calculated. If only one spot urine sample was collected or only one 24-h urine collection was considered as valid, the only available value was used. Due to the skewed distribution, geometric means (and 95 % CI) were presented.
The INTERSALT formula developed in North American and European populations(16)was used to estimate 24-hUNa
excre-tion from spot urine samples. The following sex-specific equa-tions for Western Europe were used:
For men:
Predicted 24-hUNa excretion (mmol/d) = 17·05 + (0·46 × spot Na (mmol/l))– (2·75 × spot creatinine (mmol/l)) – (0·13 × spot K (mmol/l)) + (4·10 × BMI (kg/m2)) + (0·26 × age (years)).
For women:
Predicted 24-hUNa excretion (mmol/d) = 12·82 + (0·34 × spot Na (mmol/l))– (2·16 × spot creatinine (mmol/l)) – (0·09 × spot K (mmol/l)) + (2·39 × BMI (kg/m2)) + (2·35 × age (years)) – (0·03 ×
age2(years)).
The measured and predicted 24-hUNa excretions were com-pared by the Mann–Whitney U test.
Spearman correlation coefficients were calculated to exam-ine their relationship for the total sample and separately for men and women.
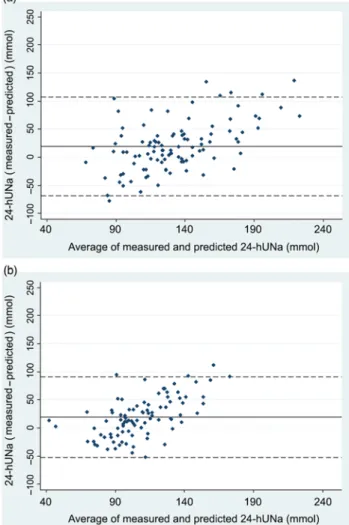
Bland–Altman plots(34)were used to validate the agreement
between measured and predicted 24-hUNa excretion. The degree of bias (i.e. mean difference between measured and pre-dicted 24-hUNa excretion) and 95 % limits of agreement were estimated.
The percentage error(35)was calculated as: 1·96 × (SDof the
difference between measured and predicted 24-hUNa excre-tion)/(mean of measured 24-hUNa excretion)× 100.
Finally, the ratio of the geometric means of measured to pre-dicted 24-hUNa excretions was used to quantify the difference between measure and prediction: a ratio of 1 representing no dif-ference between measured and predicted 24-hUNa excretion; a ratio<1 reporting an overestimation of the prediction and a ratio >1 an underestimation. This ratio, expressed as a percentage, was then used to calibrate the predictive INTERSALT equation on the French adult population and thus provides a corrected equation.
https://www.cambridge.org/core
. Universite Paris Nord 13
, on
20 Aug 2019 at 13:31:20
, subject to the Cambridge Core terms of use, available at
https://www.cambridge.org/core/terms
.
Application study. A first estimation of daily Na intake was realised from the 24-h dietary recalls. To get the salt equivalent, Na intake was multiplied by 2·54.
A second estimation of daily Na intake was realised from urinary spot samples: 24-hUNa excretion was estimated from predictive INTERSALT equation, and, assuming that approxi-mately 93 % of Na intake is urinary excreted in 24 h(10), predicted
daily Na intake was then calculated as follows:
Predicted Naintake (mg/d) = 24-hUNaexcreted(mmol/d) × 23 (conversion factor from mmol of Na to mg)/0·93.
The two Na intake estimations (from dietary recalls and from INTERSALT equation) were compared by t tests and the differ-ence was quantified by the ratio of the two values and expressed as a percentage.
Finally, all predicted values (24-hUNa excretion, predicted Na intake and salt equivalent) were recalculated by applying the calibration coefficients obtained in the validation study.
All analyses were carried out with Stata®software version 14 (StataCorp). All tests were two-tailed, and P values<0·05 were considered statistically significant. Survey data analyses (in the application study) were realised using the ‘svyset’ function (for the declaration of the complex sampling scheme) and ‘svy:’ option.
Results
Validation study
Both 24-h urine collections were invalid for four women and two men, hence six participants were excluded from the analysis.
The validation sample was then composed of 102 men (52·8 %) and 91 women (47·2 %;Table 1). Mean age was 50·1 (SD16·5) years and mean BMI was 23·9 (SD3·5) kg/m2. Spot urine samples concentration of electrolytes and measured and pre-dicted 24-hUNa excretions are presented inTable 2. The geo-metric mean Na concentration was 72·4 mmol/l for men and 63·5 mmol/l for women. A statistically significant difference was observed between men and women for creatinine urinary concentration but not for Na and K. The geometric mean of mea-sured 24-hUNa excretion was 123·3 mmol/d (2836 mg/d) and the one predicted was 108·0 mmol/d (2484 mg/d). The predicted 24-hUNa excretion was significantly different from the measured 24-hUNa (P< 0·001). Urinary Na excretion was significantly higher in men than in women (P< 0·001) for both 24-hUNa excretions derived from direct measurement and prediction. Correlation between measured and predicted 24-hUNa excre-tions was moderate in men (r 0·43; P < 0·001) and weak, albeit statistically significant (r 0·34; P < 0·001) in women (Table 3).
The agreement between the measured 24-hUNa excretion and the prediction from spot urine samples by the INTERSALT equation was analysed by Bland–Altman plots (Fig. 1). The plots showed an underestimation at lower excretion level and over-estimation at higher level. The degree of bias at the group level was 19·2 mmol/d (442 mg/d) and the agreement limits are from – 61·4 to 99·7 mmol/d (–1412 to 2293 mg/d) (Table 3). The ratio of geometric means indicates that the measured 24-hUNa excretion was on average 14 % higher than the predicted (13 % in men and 16 % in women;Table 3), therefore that the equation underesti-mated the Na excretion. Furthermore, the percentage error was 60·4 % (equivalent for men and women).
Table 1. Baseline characteristics of participants in the validation study (n 193) (Mean values and standard deviations; percentages and 95 % confidence intervals)
All (n 193) Men (n 102) Women (n 91)
% 95 % CI % 95 % CI % 95 % CI P* Age (years) 0·92 Mean 50·1 50·0 50·3 SD 16·5 16·2 16·9 Weight (kg) <0·001 Mean 69·0 74·8 62·4 SD 12·4 10·8 10·7 Height (cm) <0·001 Mean 169·7 176·1 162·5 SD 9·5 7·1 6·1 BMI (kg/m2) 0·39 Mean 23·9 24·1 23·7 SD 3·5 2·9 4·1 BMI (kg/m2) Underweight (<18·5) 4·2 2·1, 8·1 1·0 0·1, 6·8 7·7 3·7, 15·5 Normal (18·5–24·9) 62·7 55·6, 69·3 60·8 50·8, 69·9 64·8 54·3, 74·1 0·001 Overweight (25–29·9) 26·4 20·6, 33·2 35·3 26·5, 45·2 16·5 10·1, 25·8 Obese (≥30) 6·7 3·9, 11·3 2·9 0·9, 8·9 11·0 5·9, 19·4 Tobacco smoking Never 53·1 46·0, 60·1 52·5 42·6, 62·2 53·8 43·4, 64·0 Former 32·8 26·5, 39·8 36·6 27·7, 46·6 28·6 20·1, 38·9 0·29 Current 14·1 9·8, 19·8 10·9 6·1, 18·8 17·6 11·0, 27·0 Education Up to high school 19·7 14·6, 26·0 18·6 12·1, 27·5 20·9 13·6, 30·6 High school 30·0 24·0, 37·0 31·4 23·0, 41·2 28·6 20·1, 38·9 0·88 University graduate 50·3 43·2, 57·3 50·0 40·3, 59·7 50·5 40·2, 60·8
*P value for the difference between men and women was calculated by t test or χ2test as appropriate.
Validation of daily sodium intake estimation 189
https://www.cambridge.org/core
. Universite Paris Nord 13
, on
20 Aug 2019 at 13:31:20
, subject to the Cambridge Core terms of use, available at
https://www.cambridge.org/core/terms
.
Application study
Among the 2102 adults included in the ENNS study who partici-pated in the biochemical part, 1720 (81·8 %) had complete spot urine samples (a specific weighting strategy based on census data has been realised for this subpopulation). Women repre-sented 50·3 % of the weighted population. The weighted mean age was 45·2 years for total population, with women older than men (46·0 v. 44·5 years;Table 4).
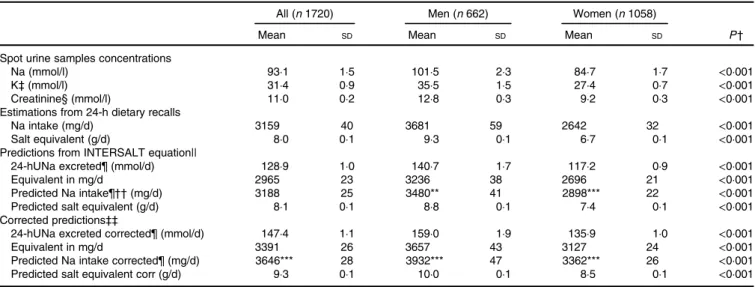
The weighted mean of Na, K and creatinine were 93·1 mmol/l, 31·4 mmol/l and 11·0 mmol/l, respectively (Table 5). Concentrations were higher in men than in women. The mean Na intake measured from the 24-h dietary recalls was 3159 mg/ d (3681 mg/d for men and 2642 mg/d for women), whereas the mean predicted Na intake by the INTERSALT equation was 3188 mg/d (3480 mg/d for men and 2898 mg/d for women). Na intake reported in the 24-h dietary recalls was greater than that estimated by the INTERSALT equation by +5·5 % in men (P<0·01), but lower in women (–9·7 %; P<0·001).
When the INTERSALT calculated values were corrected using sex-specific calibration coefficients calculated in the validation study (+13 % for men and +16 % for women), the predicted Na intake was 3646 mg/d (3932 mg/d for men and 3362 mg/d for women), equivalent to 9·3 g of salt consumed daily (10·0 g for men and 8·5 g for women). Therefore, compared with the calibrated predicted values, Na intake calculated from dietary recalls was underestimated by 15·4 % (6·8 % among men and 27·2 % among women).
Discussion
This study assessed the validity of the predictive INTERSALT equation to estimate the 24-hUNa excretion from spot urine sam-ples and produced calibration coefficients for the French adult population.
Table 2. Spot urine samples concentration of electrolytes and 24-h urinary sodium (24-hUNa) excretion (measured and predicted) in the validation study (n 193)
(Geometric means and 95 % confidence intervals)
All (n 193) Men (n 102) Women (n 91)
P†
Geometric mean 95 % CI Geometric mean 95 % CI Geometric mean 95 % CI
Spot urine samples concentration
Na (mmol/l) 68·1 63·1, 73·3 72·4 65·7, 79·8 63·5 56·5, 71·2 0·07 K (mmol/l) 54·5 50·9, 58·3 53·7 49·1, 58·7 55·3 49·8, 61·4 0·52 Creatinine (mmol/l) 9·8 9·0, 10·8 10·9 9·7, 12·3 8·7 7·6, 10·0 0·02 24-hUNa excretion Measured (mmol/d) 123·3 117·3, 129·6 134·2 125·3, 143·7 112·1 104·6, 120·1 <0·001 Predicted (mmol/d) 108·0*** 104·0, 112·2 119·2*** 113·3, 125·5 96·8*** 92·2, 101·6 <0·001
*** Mean value was significantly different from that for 24-hUNa measured (P < 0·001; Mann–Whitney U test). † P value for the difference between men and women was calculated by the Mann–Whitney U test. Table 3. Agreement between measured and predicted 24-h urinary
sodium excretion in the validation study (n 193)
(Spearman correlation coefficients; mean values and standard deviations; 95 % limits of agreement)
All
(n 193) (n 102)Men Women(n 91) Spearman correlation coefficient 0·42*** 0·43*** 0·34*** Difference (measured– predicted) (mmol/d)
Mean SD
19·2
40·3 1944·0·3 1936·0·0 95% limits of agreement (mmol/d) –61·4,
99·7 –68·6,107·2 –52·9,90·9 Ratio (measured/predicted) Mean SD 1·14 0·45 1·130·48 1·160·41 ***P value for the Spearman correlation test was statistically significant (P<0·001).
Fig. 1. Bland–Altman plots for agreement between measured 24-h urinary sodium (24-hUNa) excretion and predicted 24-hUNa excretion from spot urine samples and INTERSALT equation in the validation study in 102 men (a) and 91 women (b). The solid line represents the mean of paired difference and the dashed lines represent the 95 % limits of agreement (mean±2SD).
https://www.cambridge.org/core
. Universite Paris Nord 13
, on
20 Aug 2019 at 13:31:20
, subject to the Cambridge Core terms of use, available at
https://www.cambridge.org/core/terms
.
Table 4. Baseline characteristics of participants in the application study (n 1720) (Mean values and standard deviations; percentages and 95 % confidence intervals)
All (n 1720) Men (n 662) Women (n 1058)
P* % 95 % CI % 95 % CI % 95 % CI Age (years) 0·21 Mean 45·2 44·5 46·0 SD 0·6 0·9 0·7 Weight (kg) <0·001 Mean 71·8 78·1 65·6 SD 0·5 0·7 0·6 Height (cm) <0·001 Mean 168·2 174·6 161·8 SD 0·3 0·4 0·3 BMI (kg/m2) 0·08 Mean 25·4 25·6 25·1 SD 0·2 0·2 0·2 BMI (kg/m2) Underweight (<18·5) 2·6 1·8, 3·8 0·6 0·2, 1·8 4·6 3·1, 6·9 <0·001 Normal (18·5–24·9) 49·9 46·5, 53·4 45·5 40·1, 51·0 54·4 50·2, 58·5 Overweight (25–29·9) 33·3 30·1, 36·6 42·7 37·4, 48·1 24·0 20·7, 27·6 Obese (≥30) 14·1 12·1, 16·4 11·2 8·6, 14·6 17·0 14·2, 20·3 Tobacco smoking Never 45·6 42·2, 49·1 34·1 29·0, 39·5 57·1 52·9, 61·1 <0·001 Current 27·9 24·9, 31·2 31·6 26·7, 37·0 24·3 20·8, 28.2 Former 26·5 23·7, 29·4 34·3 29.6, 39·4 18·6 15·9, 21·7 Education Up to high school 63·0 59·9, 66·0 63·2 58·2, 67·9 62·9 59·0, 66·6 0·98 High school 16·1 13·8, 18·7 15·8 12·4, 20·0 16·3 13·4, 19·7 University graduate 20·9 18·8, 23·2 21·0 17·7, 24·7 20.9 18·2, 23·8 Alcohol use No 18·3 16·0, 20·9 9·4 7·0, 12·5 27·2 23·6, 31·2 <0·001 Yes 81·7 79·1, 84·0 90·6 87·5, 93·0 72·8 68·8, 76·5
*P values were calculated by design-based t tests or χ2tests as appropriate.
Table 5. Urine spot samples electrolyte concentrations and estimations of daily sodium intake and excreted in the application study (n 1720) (Mean values and standard deviations)
All (n 1720) Men (n 662) Women (n 1058)
P†
Mean SD Mean SD Mean SD
Spot urine samples concentrations
Na (mmol/l) 93·1 1·5 101·5 2·3 84·7 1·7 <0·001
K‡ (mmol/l) 31·4 0·9 35·5 1·5 27·4 0·7 <0·001
Creatinine§ (mmol/l) 11·0 0·2 12·8 0·3 9·2 0·3 <0·001
Estimations from 24-h dietary recalls
Na intake (mg/d) 3159 40 3681 59 2642 32 <0·001
Salt equivalent (g/d) 8·0 0·1 9·3 0·1 6·7 0·1 <0·001
Predictions from INTERSALT equation||
24-hUNa excreted¶ (mmol/d) 128·9 1·0 140·7 1·7 117·2 0·9 <0·001
Equivalent in mg/d 2965 23 3236 38 2696 21 <0·001
Predicted Na intake¶†† (mg/d) 3188 25 3480** 41 2898*** 22 <0·001
Predicted salt equivalent (g/d) 8·1 0·1 8·8 0·1 7·4 0·1 <0·001
Corrected predictions‡‡
24-hUNa excreted corrected¶ (mmol/d) 147·4 1·1 159·0 1·9 135·9 1·0 <0·001
Equivalent in mg/d 3391 26 3657 43 3127 24 <0·001
Predicted Na intake corrected¶ (mg/d) 3646*** 28 3932*** 47 3362*** 26 <0·001
Predicted salt equivalent corr (g/d) 9·3 0·1 10·0 0·1 8·5 0·1 <0·001
24-hUNa, 24-h urinary sodium.
Difference between sodium intake estimated from 24-h dietary recalls and sodium intake predicted from INTERSALT equation (with and without calibration) was statistically significant: **P<0·01, *** P<0·001 (t test).
† P values were calculated by design-based t tests or χ2tests as appropriate.
‡ n 1718 (662 men/1056 women). §n 1719 (662 men/1057 women).
|| Predictions from INTERSALT equation using spot urine samples. ¶n 1717 (662 men/1055 women).
†† Predicted sodium intake was calculated using the following formula: 100 × 24-hUNa excreted/93; 93 % is the percentage of sodium which is excreted in 24 h compared with sodium intake.
‡‡ Corrected using calibration coefficient calculated in the validation study (13 % for men and 16 % for women).
Validation of daily sodium intake estimation 191
https://www.cambridge.org/core
. Universite Paris Nord 13
, on
20 Aug 2019 at 13:31:20
, subject to the Cambridge Core terms of use, available at
https://www.cambridge.org/core/terms
.
In the present validation study, while being significantly correlated (r 0·42; P<0·001), prediction was underestimated by 14 % compared with measured 24-hUNa excretion. Results of previous studies using the INTERSALT equation showed fluctuations in the accuracy of predictions(16,18,36,37), and
some previous works also observed such an underestima-tion(19,20,35,38). To complement correlation coefficients, it is
rec-ommended to use a Bland–Altman analysis(9,34) in validations
studies. In our study, the mean bias (between measured and pre-dicted 24-hUNa excretion) in Bland–Altman analysis was mod-erate (19·2 mmol/d) and comparable with that reported by Kelly et al.(19)for INTERSALT predictions based on morning urinary spots (15 mmol/d). Those results (significant correlation and moderate bias) show the possible use of the INTERSALT equa-tion to predict 24-hUNa excreequa-tion from spot urine samples at a population level. They also provide calibration coefficients for the French population. However, similar to the results of Rhee et al.(35), the limits of agreement (from–61·4 to 99·7 mmol/d)
and the percentage error (greater than 60 %) show important variability around the mean difference and limit the use of this method at an individual level. So, our findings are consistent with the general consensus that spot urinary Na could be a useful alternative to 24-h urine collection in populations but a poor predictor of 24-hUNa excretion in individuals(13,18,20–22,25,39). This method may be useful to estimate global Na intake in the French population, but given the underestimation and the impor-tant variability, caution remains when using it for public health purposes. It can be used to estimate population-level salt intake in cross-sectional studies such as nationwide survey, and to adapt public health recommendations and actions, but its usefulness to evaluate actions may be limited by the relatively small changes in population salt intake that can be seen in response to population-level interventions over time(40).
In the present validation study, correlations between pre-dicted and measured 24-hUNa excretions (r 0·43 for men and r 0·34 for women) were below than those previously pub-lished(16,18,20). It can be explained by the difference in the urine
collection times between our study (including only morning spots) and the others (with urinary spot samples collected at different times). Indeed, metabolic studies indicate that urinary Na excretion displays circadian variations, and that Na would be more excreted in the afternoon and evening(29,41,42). Mann
& Gerber(27) showed that mean predicted 24-hUNa excretion
from spot based on samples collected in the afternoon and evening was a more relevant approximation of real mean of 24-hUNa excretion compared with samples collected in the morning or overnight. In our study, although having two spots per participant in the validation study, all spot urine samples were collected in the morning due to protocol constraints. As mentioned in previous studies, the use of multiple spots, col-lected at different times of the day, would be a better indicator for predictions(16,25,27,28).
In the application study, we found an average intake of 3159 mg/d (equivalent to ~8 g/d of salt) using dietary recalls, which overestimates by 5·5 % in men and underestimates by 9·7 % in women compared with the INTERSALT predicted Na intake. The result obtained in women is consistent with another study which reported that Na intake measured from dietary recalls
was subject to underestimation (about 10 % for women and 7 % for men in comparison with the Na biomarkers)(43). This is not
found in men in the present study. This could be explained by a better estimate of Na intake in dietary recalls in men compared with women, or by other factors that could lead to further Na losses. Indeed, different factors have been reported to affect esti-mates of Na excretion such as health status, circadian variations, hydration status or excessive sweating, and some behaviours such as vigorous physical activity or short-term exposure to high tem-perature were not measured in this study. Our results show, how-ever, that the estimation of Na intake by dietary recalls is fairly accurate in men, but that it requires some improvements in women for whom Na intake is largely underestimated (by almost 10 % in comparison with original INTERSALT prediction and by more than 27 % when applying calibration coefficients).
A strength of this study was the use of two 24-h urine collec-tions and two spot urine samples to carry out the validation study. Wang et al.(29)reported important within-person variance
in 24-h urines and timed spot urine samples (ranging from 16 to 29 % and 21 to 41 %, respectively) of mean excretion, concluding that repeated measurements are necessary to overcome within-person variation(28,44–46). Another strength of this study was the
use of three 24-h dietary recalls to estimate Na intake in general adult French population. Three 24-h dietary recalls have been reported to be optimal for estimating individual energy intake(47).
In general, the method used in the present study meets the major-ity of the recommendations for validation studies reported by McLean et al.(9)regarding the 24-h dietary recalls (multiple
non-consecutive days, inclusion of an estimate of discretionary salt used), the 24-h urine collections (multiple non-consecutive collec-tions per participant, undertaken over the same period of assess-ment as the dietary assessassess-ment, with the use of a suitable method to measure completeness) and the statistical analysis (multiple methods used, including correlation and Bland–Altman methods and with a sample size carefully calculated). Finally, the NutriNet-Santé and ENNS studies used for the present analysis are compa-rable, since these two studies employed the same methodology to assess dietary intake (the same 24-h dietary assessment instrument and a unique food composition table) and carried out their biologi-cal assays in the same laboratory.
However, some limitations should be noted. First, the timing of spot urine samples differed between the validation and appli-cation studies. In the validation study, morning spot urine sam-ples were collected (likely not the first-morning urine as it was collected during the visit), while it was a first-morning urine spot sample (corresponding to overnight urine, collected at home) in the application study. Wang et al.(29) showed that overnight
specimens had lower Na concentrations compared with morn-ing specimens; therefore, this difference of protocol may have contributed to underestimate the 24-hUNa predictions made in the application sample. However, the morning sample in the val-idation study was done in a fasting state and may not differ that much from an overnight sample. Second, only healthy volun-teers were included in the validation study. Previous work has studied the non-representative nature of the overall sample of NutriNet-Santé study where women and well-educated individ-uals are over-represented compared with national data(48). This
volunteer bias was partly limited by the sampling strategy of
https://www.cambridge.org/core
. Universite Paris Nord 13
, on
20 Aug 2019 at 13:31:20
, subject to the Cambridge Core terms of use, available at
https://www.cambridge.org/core/terms
.
the Dietary Validation Study. In addition, the ENNS showed that salt intake of French adults differed according to sex but not according to age or education level(49). Third, the INTERSALT
equation has been developed and validated in a relatively young population of adults (20–59 years)(16)and recent work showed
that this equation was not consistently valid for older adults(23).
However, the mean age was 50 years in the present validation study (age range 23–83 years), so caution is advised when extrapolating from the results of underestimation of the mean Na intake.
In summary, we found that dietary salt intake in French adults is high and above the WHO recommendations and that the use of a spot urine collection remains an acceptable alternative in monitor-ing and evaluatmonitor-ing the Na level of the population by applymonitor-ing pop-ulation-specific correction coefficients that we provide. However, spot urine samples are insufficient to estimate individual salt intake, and the 24-h urine collection remains the gold standard for Na intake assessment. Further research is needed to find more reliable methods of dietary assessment of salt intake.
Acknowledgements
The authors thank all the staff involved in this study: the dieti-tians, the nurses and physicians from the health examination centres of the French National Health Insurance System and the Cetaf (Centre Technique d’Appui et de Formation des Centres d’Examens de Santé).
The NutriNet-Santé Study was supported by the French Ministry of Health, Santé publique France (former Institut de Veille Sanitaire and Institut National de la Prévention et de l’Education pour la Santé), the Fondation pour la Recherche Médicale (FRM), the Institut National de la Santé et de la Recherche Médicale (INSERM), the Institut National de la Recherche Agronomique (INRA), the Conservatoire National des Arts et Métiers (CNAM) and the University of Paris 13. The Dietary Validation Study was funded by Santé publique France (former Institut de Veille Sanitaire) and supported by grants from the Région Ile de France (CORDDIM). The Etude Nationale Nutrition Santé (ENNS survey) was supported by Santé publique France (former Institut de Veille Sanitaire), the University of Paris 13 and the Caisse nationale d’Assurance maladie des Travailleurs salaries (CnamTS).
C. L., K. C., V. D., M. V., S. H., P. G. and E. K. G. designed the research; D. G. and P. F. carried out the biomarker analyses; E. E., B. S. and C. V. analysed the data and performed the statistical analysis; E. E. and C. V. wrote the initial draft; C. L., K. C., V. D., B. S., M. V., D. G., P. F., S. H., P. G. and E. K. G. modified and completed the manuscript. All authors read and approved the final manuscript.
The authors declare that there is no conflict of interest.
References
1. Aburto N, Ziolkovska A, Hooper L, et al. (2013) Effect of lower sodium intake on health: systematic review and meta-analyses. BMJ 346, f1326.
2. Chobanian A, Bakris G, Black H, et al. (2003) Seventh report of the Joint National Committee on prevention, detection,
evaluation, and treatment of high blood pressure.
Hypertension 42, 1206–1252.
3. He F, Li J & Macgregor G (2013) Effect of longer term modest salt reduction on blood pressure: Cochrane systematic review and meta-analysis of randomised trials. BMJ 346, f1325. 4. Koliaki C & Katsilambros N (2013) Dietary sodium, potassium,
and alcohol: key players in the pathophysiology, prevention, and treatment of human hypertension. Nutr Rev 71, 402–411. 5. Mente A, O’Donnell M, Rangarajan S, et al. (2014) Association of urinary sodium and potassium excretion with blood pres-sure. N Engl J Med 371, 601–611.
6. Strazzullo P, D’Elia L, Kandala N, et al. (2009) Salt intake, stroke, and cardiovascular disease: meta-analysis of prospective stud-ies. BMJ 339, b4567.
7. Mozaffarian D, Fahimi S, Singh G, et al. (2014) Global sodium consumption and death from cardiovascular causes. N Engl J Med 371, 624–634.
8. World Health Organization (2007) Prevention of
Cardiovascular Disease: Guidelines for Assessment and Management of Cardiovascular Risk. Geneva: WHO. 9. McLean RM, Farmer VL, Nettleton A, et al. (2018)
Twenty-four-hour diet recall and diet records compared with 24-Twenty-four-hour urinary excretion to predict an individual’s sodium consumption: a sys-tematic review. J Clin Hypertens 20, 1360–1376.
10. Lucko A, Doktorchik C, Woodward M, et al. (2018) Percentage of ingested sodium excreted in 24-hour urine collections: A system-atic review and meta-analysis. J Clin Hypertens 20, 1220–1229. 11. Elliott P & Brown I (2007) Sodium intakes around the world.
Background document prepared for the Forum and
Technical meeting on Reducing Salt Intake in Populations
(Paris 5–7th October 2006). Geneva: WHO. http://www.
who.int/dietphysicalactivity/Elliot-brown-2007.pdf (accessed October 2018).
12. Cogswell ME, Maalouf J, Elliott P, et al. (2015) Use of urine bio-markers to assess sodium intake: challenges and opportunities. Annu Rev Nutr 35, 349–387.
13. McLean RM (2014) Measuring population sodium intake: a review of methods. Nutrients 6, 4651–4662.
14. Kawasaki T, Itoh K, Uezono K, et al. (1993) A simple method for estimating 24 h urinary sodium and potassium excretion from second morning voiding urine specimen in adults. Clin Exp Pharmacol Physiol 20, 7–14.
15. Tanaka T, Okamura T, Miura K, et al. (2002) A simple method to estimate populational 24-h urinary sodium and potassium excretion using a casual urine specimen. J Hum Hypertens 16, 97–103.
16. Brown IJ, Dyer AR, Chan Q, et al. (2013) Estimating 24-hour uri-nary sodium excretion from casual uriuri-nary sodium concentra-tions in Western populaconcentra-tions: the INTERSALT study. Am J Epidemiol 177, 1180–1192.
17. WHO/PAHO Regional Expert Group for Cardiovascular Disease Prevention through Population-wide Dietary Salt Reduction (2010) Protocol for population level sodium
determi-nation in 24-hour urine samples.https://www.paho.org/hq/
dmdocuments/2013/24h-urine-Protocol-eng.pdf (accessed October 2018).
18. Cogswell ME, Wang CY, Chen TC, et al. (2013) Validity of pre-dictive equations for 24-h urinary sodium excretion in adults aged 18-39 y. Am J Clin Nutr 98, 1502–1513.
19. Kelly C, Geaney F, Fitzgerald AP, et al. (2015) Validation of diet and urinary excretion derived estimates of sodium excretion against 24-h urine excretion in a worksite sample. Nutr Metab Cardiovasc Dis 25, 771–779.
20. McLean R, Williams S & Mann J (2014) Monitoring population sodium intake using spot urine samples: validation in a New Zealand population. J Hum Hypertens 28, 657–662.
Validation of daily sodium intake estimation 193
https://www.cambridge.org/core
. Universite Paris Nord 13
, on
20 Aug 2019 at 13:31:20
, subject to the Cambridge Core terms of use, available at
https://www.cambridge.org/core/terms
.
21. Zhou L, Tian Y, Fu JJ, et al. (2017) Validation of spot urine in predicting 24-h sodium excretion at the individual level. Am J Clin Nutr 105, 1291–1296.
22. World Health Organization (2011) Strategies to monitor and evaluate population sodium consumption and sources of sodium in the diet: report of a joint technical meeting convened by WHO and the Government of Canada. Geneva: WHO. 23. Allen NB, Zhao L, Loria CM, et al. (2017) The validity of
predictive equations to estimate 24-hour sodium excretion: the MESA and CARDIA Urinary Sodium Study. Am J Epidemiol 186, 149–159.
24. Hooft van Huysduynen EJ, Hulshof PJ, van Lee L, et al. (2014) Evaluation of using spot urine to replace 24 h urine sodium and potassium excretions. Public Health Nutr 17, 2505–2511. 25. Ji C, Sykes L, Paul C, et al. (2012) Systematic review of studies
comparing 24-hour and spot urine collections for estimating population salt intake. Rev Panam Salud Publica 32, 307–315. 26. Doenyas-Barak K, Beberashvili I, Bar-Chaim A, et al. (2015) Daily sodium and potassium excretion can be estimated by scheduled spot urine collections. Nephron 130, 35–40. 27. Mann SJ & Gerber LM (2010) Estimation of 24-hour sodium
excretion from spot urine samples. J Clin Hypertens 12, 174–180.
28. Uechi K, Asakura K, Ri Y, et al. (2016) Advantage of multiple spot urine collections for estimating daily sodium excretion: comparison with two 24-h urine collections as reference. J Hypertens 34, 204–214.
29. Wang CY, Cogswell ME, Loria CM, et al. (2013) Urinary excre-tion of sodium, potassium, and chloride, but not iodine, varies by timing of collection in a 24-hour calibration study. J Nutr 143, 1276–1282.
30. Lassale C, Castetbon K, Laporte F, et al. (2015) Validation of a web-based, self-administered, non-consecutive-day dietary record tool against urinary biomarkers. Br J Nutr 113, 953–962. 31. Hercberg S, Castetbon K, Czernichow S, et al. (2010) The Nutrinet-Santé Study: a web-based prospective study on the relationship between nutrition and health and determinants of dietary patterns and nutritional status. BMC Public Health 10, 242.
32. Castetbon K, Vernay M, Malon A, et al. (2009) Dietary intake, physical activity and nutritional status in adults: the French nutrition and health survey (ENNS, 2006–2007). Br J Nutr 102, 733–743.
33. World Health Organization (1995) Physical status: the use and interpretation of anthropometry. Report of a WHO Expert Committee. WHO Technical Report Series, 8(54). Geneva: WHO.
34. Bland JM & Altman DG (1986) Statistical methods for assessing agreement between two methods of clinical measurement. Lancet I, 307–310.
35. Rhee MY, Kim JH, Shin SJ, et al. (2014) Estimation of 24-hour urinary sodium excretion using spot urine samples. Nutrients 6, 2360–2375.
36. Mente A, O’Donnell MJ, Dagenais G, et al. (2014) Validation and comparison of three formulae to estimate sodium and potassium excretion from a single morning fasting urine com-pared to 24-h measures in 11 countries. J Hypertens 32, 1005–1014.
37. Polonia J, Lobo MF, Martins L, et al. (2017) Estimation of pop-ulational 24-h urinary sodium and potassium excretion from spot urine samples: evaluation of four formulas in a large national representative population. J Hypertens 35, 477–486. 38. Pfeiffer CM, Hughes JP, Cogswell ME, et al. (2014) Urine
sodium excretion increased slightly among U.S. adults between 1988 and 2010. J Nutr 144, 698–705.
39. Conkle J & van der Haar F (2016) The use and interpretation of sodium concentrations in casual (spot) urine collections for population surveillance and partitioning of dietary iodine intake sources. Nutrients 9, 1.
40. Cappuccio F & D’Elia L (2018) Evaluating population salt reduc-tion programmes worldwide: the risk of cutting corners! Public Health Nutr 21, 2161–2163.
41. Dyer AR, Martin GJ, Burton WN, et al. (1998) Blood pressure and diurnal variation in sodium, potassium, and water excre-tion. J Hum Hypertens 12, 363–371.
42. Stow LR & Gumz ML (2011) The circadian clock in the kidney. J Am Soc Nephrol 22, 598–604.
43. Rhodes DG, Murayi T, Clemens JC, et al. (2013) The USDA Automated Multiple-Pass Method accurately assesses popula-tion sodium intakes. Am J Clin Nutr 97, 958–964.
44. Iwahori T, Ueshima H, Miyagawa N, et al. (2014) Six random specimens of daytime casual urine on different days are sufficient to estimate daily sodium/potassium ratio in com-parison to 7-day 24-h urine collections. Hypertens Res 37, 765–771.
45. Knuiman JT, Hautvast JG, van der Heijden L, et al. (1986) A multi-centre study on within-person variability in the urinary excretion of sodium, potassium, calcium, magnesium and cre-atinine in 8 European centres. Hum Nutr Clin Nutr 40, 343–8. 46. Liu K, Dyer AR, Cooper RS, et al. (1979) Can overnight urine replace 24-hour urine collection to asses salt intake? Hypertension 1, 529–536.
47. Ma Y, Olendzki BC, Pagoto SL, et al. (2009) Number of 24-hour diet recalls needed to estimate energy intake. Ann Epidemiol 19, 553–559.
48. Andreeva VA, Salanave B, Castetbon K, et al. (2015) Comparison of the sociodemographic characteristics of the large NutriNet-Santé e-cohort with French Census data: the issue of volunteer bias revisited. J Epidemiol Community Health 69, 893–898.
49. Unité de surveillance et d’épidémiologie nutritionnelle (2007) Etude nationale nutrition santé (ENNS, 2006). Situation nutri-tionnelle en France en 2006 selon les indicateurs d’objectif et les repères du Programme national nutrition santé (PNNS).
Saint-Maurice: Institut de veille sanitaire.http://opac.invs.sante.
fr/doc_num.php?explnum_id=3481(accessed October 2018).
https://www.cambridge.org/core
. Universite Paris Nord 13
, on
20 Aug 2019 at 13:31:20
, subject to the Cambridge Core terms of use, available at
https://www.cambridge.org/core/terms
.