fondation pour les études et recherches sur le développement international
LA FERDI EST UNE FOND
A TION REC ONNUE D ’UTILITÉ PUBLIQUE . ELLE ME T EN ŒUVRE A VEC L ’IDDRI L ’INITIA TIVE POUR LE DÉ VEL OPPEMENT E
T LA GOUVERNANCE MONDIALE (IDGM).
ELLE C
OORDONNE LE LABEX IDGM+ QUI L
’ASSOCIE A U CERDI E T À L ’IDDRI. CE T TE PUBLIC A TION A BÉNÉFICIÉ D ’UNE AIDE DE L ’É TA T FR ANÇ AIS GÉRÉE P AR L ’ANR A U TITRE DU PROGR A MME «INVESTISSEMENT S D ’A VENIR» POR
TANT LA RÉFÉRENCE «ANR-10-LABX
-14-01».
Reported Corruption vs.
Experience of Corruption in
Public Procurement Contracts*
Bernard Gauthier | Frédéric Lesné
Bernard Gauthier, Department of Applied Economics HEC Montreal, Canada.
Email: [email protected]
Frédéric Lesné, Centre d’Etudes et de Recherches sur le Developpement International (CERDI), Clermont-Auvergne University, France. Corresponding author. Email: [email protected]
Abstract
This paper examines the accuracy of estimates of corruption reported in business
surveys by comparing reported experience of corruption in public procurement
from Malagasy firms having won public contracts with a more objective measure
of corruption in the sector using a red flag indicator of corruption risk. This red flag
indicator of corruption identifies contracts that failed to comply (or circumvented)
public procurement regulations. We find that about 68 percent of public contracts
in Madagascar in 2013 and 2014 were awarded with a method not complying with
the Public Procurement Code and classified according to our methodology at risk of
corruption, with 85% of contracting firms having won at least one corruption-prone
contract. Matching public procurement data in Madagascar with a firm-level survey
in 2015 among firms awarded public contracts in 2013-2014, we find that experience
of corruption has no influence on firms’ survey participation or propensity to answer
questions about corruption.
… /…
JEL Classification : D21, C42, D73
Keywords : indicators, corruption, surveys, firms
Dev
elopment Po
lic
ie
s
Wo
rkin
242
g Paper
December2018“Sur quoi la fondera-t-il l’économie du monde qu’il veut gouverner?
Sera-ce sur le caprice de chaque particulier? Quelle confusion! Sera-ce
sur la justice? Il l’ignore.”
Abstract
This paper examines the accuracy of estimates of corruption re-ported in business surveys by comparing reported experience of cor-ruption in public procurement from Malagasy firms having won public contracts with a more objective measure of corruption in the sector using a red flag indicator of corruption risk. This red flag indicator of corruption identifies contracts that failed to comply (or circumvented) public procurement regulations. We find that about 68 percent of public contracts in Madagascar in 2013 and 2014 were awarded with a method not complying with the Public Procurement Code and classi-fied according to our methodology at risk of corruption, with 85% of contracting firms having won at least one corruption-prone contract. Matching public procurement data in Madagascar with a firm-level survey in 2015 among firms awarded public contracts in 2013-2014, we find that experience of corruption has no influence on firms’ sur-vey participation or propensity to answer questions about corruption. However, firms experiencing more risks of corruption have a signifi-cantly greater likelihood of denying the existence of corruption in pub-lic procurement. One additional public contract identified at risk of corruption awarded to a firm as measured by our red flag indicator increases its likelihood of estimating a zero magnitude of bribery in public procurement by 0.88 percentage points. This is a sizable ef-fect. One standard deviation increase in red flag contracts (about 10 additional contracts) secured by a firm increases its probability of pro-viding a zero estimate of bribery from 15.7% to 24.1%. Ultimately, our corruption-risk indicator indicates that corruption is much more severe than what business surveys suggest, with only 45% of surveyed firms in Madagascar reporting the presence of bribery in the procurement sector. Our findings illustrate the limitations of business survey data on corruption for conducting empirical research and the importance of collecting more objectives measures of corruption.
1
Introduction
Survey estimates of bribe-payer experience have been seen as the most di-rect, easily replicable and consistent way of measuring corruption activities across countries and over time (Olken and Pande, 2012). Asking firms or households about their bribe payment experience represent clear improve-ment in comparison to first generation corruption estimates based on surveys of perception of citizens and experts which have been shown as affected by various biases and limitations1.
Bribe-payer experience surveys also have the advantage of allowing the examination of individual or firm-level characteristics influencing corruption activities, something country-level perception indices are not suited for2.
With regard to firms, Svensson (2003) surveyed enterprises in Uganda and examined how much they paid in bribes, observing that the frequency of interactions with public officials affects the probability of bribe payment while firm’s profitability and capacity to avoid red tape affects bribe levels. Using comparable questions across countries, the World Bank Enter-prise Surveys (WBES) ask representative samples of firms about informal payments for government services (water, electricity, telephone, licenses, etc.) and interactions with tax officials, in particular whether any gov-ernment officials in their country asked or expected them to pay a bribe during the previous year3.
1A weak correlation has been found for instance between citizens’ perceptions of corrup-tion and actual corrupcorrup-tion in a road construccorrup-tion project in Indonesia; citizen’s percepcorrup-tion reflecting more easily perceivable aspects of corruption such as marked up prices rather than inflated quantities, the latter being the most important channel of corruption in the construction project examined in Indonesia. Citizen’s perceptions may be influenced by individual characteristics, introducing systematic biases (Olken, 2009). Expert percep-tions of corruption may also be biased, being influenced by factors not directly associated to corruption, such as a country’s level of inequality, its political regime or state of press freedom (Treisman 2007; Knack, 2006). Despite these challenges, these subjective mea-sures of corruption are still used in most country-level corruption indices, such as the PRS Group’s International Country Risk Guide (ICRG), Transparency International’s Corruption Perception Index and the World Bank’s Control of corruption index.
2Among the main other approaches to measure corruption are, in particular, direct observation at the source of the transaction. For instance, Olken and Barron (2009) ob-served bribe payment in the trucking industry in a province of Indonesia while Sequeira and Djankov (2010) observed bribe payment in the customs in Mozambique and South Africa ports. Other measures include subtraction methods, which compare two differ-ent measures of the same quantity, one before corruption takes place and the other after corruption occurs. For instance, the Public Expenditure Tracking Surveys (PETS) com-pares intended budget allocation to observed transfers in order to assess direct or indirect leakages (Reinikka and Svensson, 2004; Gauthier and Wane, 2008.)
3Household survey of bribe-payer experience include for instance the Transparency In-ternational Global Corruption Barometer which asks individuals whether any government officials in their country has asked them or expected them to pay a bribe during the
Despite these clear advantages, bribe-payer experience surveys present serious drawbacks, given especially the limited incentives for truthful report-ing and participation of respondents (Kaufmann and Kraay, 2008; Svensson, 2005). Indeed, with regard to firm-level surveys, firm owners and managers can be reluctant to participate in surveys about their professional activi-ties because they do not want to disclose private information of relevance for their business to the interviewer. This reluctance is exacerbated when surveys deal with a sensitive issue like corruption (Baldauf et al., 1999). The desire to avoid mentioning personal involvement in illegal and immoral activities may lead some firm owners and managers to decline participating in surveys about corruption if they are aware of their purpose. Also, those who have been involved in acts of corruption but agree to take part in a corruption survey may be more inclined than others to decline to answer questions about corruption, or to deny any participation in such acts.
Such reticent or non-candid answers could affect the measurement of corruption activities obtained with surveys (Azfar and Murrell, 2009; Clausen et al., 2011). Various approaches have been proposed to correct for these potential biases. One frequently used approach in surveys on sensitive top-ics such as corruption is to ask questions indirectly to respondents. Instead of asking about the firm’s own experience, most surveys on corruption ask how much the respondent think other firms like their own pay in informal payments or gifts to public officials. The belief is that indirect questioning will help decrease under-reporting by allowing managers to admit paying bribes without incriminating themselves4.
However, it is possible that respondents who are reticent to report how much bribes they pay are also reticent estimating what other firms pay in bribes, suggesting that asking about others does not necessarily decrease reticence (Clarke et al. 2015)5.
previous year to access public services. 4
A number of questions about corruption in the World Bank Enterprise Surveys are formulated indirectly. For instance, question J7 reads as follows: “We’ve heard that es-tablishments are sometimes required to make gifts or informal payments to public officials to get things done with regard to customs, taxes, licenses, regulations, services etc. On average, what percentage of total annual sales, or estimated annual value, do establish-ments like this one pay in informal payestablish-ments/gifts to public officials for this purpose?” (The World Bank, 2016).
5
Azfar and Murrell (2009) have proposed another method for identifying reticent re-spondents and correcting bribery measures using the randomized response questioning (RRQ) method. The RRQ method adds a random component to survey answers, allowing respondents to answer honestly while keeping hidden their true behavior. In its most basic form, this strategy involves asking respondents to toss a coin heads-or-tails. Whenever the outcome of the toss is a tail, respondents are instructed to systematically answer in the affirmative. They are requested to answer the question sincerely if the toss gives a head. Since nobody, except the respondent, knows the outcome of the toss, it is impossible to infer from an affirmative answer that the respondent is admitting guilt over the sensitive
This paper proposes an approach to identify reticent respondents and correct biases in firm-level surveys using a more objective measure of cor-ruption based on respondents’ actual experience of corcor-ruption. The iden-tification strategy uses observed breach and circumvention of rules in the allocation of public procurement contracts. This red flag indicator of cor-ruption risk is computed at firm-level using public procurement data in Madagascar matched with a survey among firms awarded public contracts, and is used to identify how experience of corruption influences firms’ deci-sions to participate in a corruption survey and to answer a sensitive survey question about their perceived magnitude of bribery in public procurement. We find that while firms more at risk of corruption have the same be-havior, on average, than other firms with regard to survey participation and response rates to sensitive questions, these firms deny significantly more frequently than the others the existence of corruption in public contract-ing. More specifically, firms which have won more public contracts through breach or circumvention of procurement rules are more likely to deny that firms similar to their own have to offer gifts or make illegal payments to pub-lic officials to secure pubpub-lic contracts. In terms of magnitude of the effect, one additional public contract suspected of corruption awarded to a firm increases its probability of estimating a zero magnitude of bribery in public procurement by 0.84 percentage point, with a proportion of zero estimates in the survey sample of 15.7 percent. These results suggest that bribery in-dicators using business survey data are largely underestimating corruption due to such strategic behavior by corrupt firms. The more corrupt firms in the survey sample, the larger the downward bias. This result is particularly problematic for the reliability of cross-country indicators of bribery which compare countries with different proportions of bribe-paying firms.
The remainder of the paper is organized as follows: Section 2 discusses corruption in public procurement in Madagascar. Section 3 introduces the red flag indicator of corruption risk in procurement. Section 4 describes the firm survey. Section 5 shows how experience of corruption as measured by our red flag indicator affects the answering behavior of firms owners and
behavior. Azfar and Murrell (2009) use this technique not for reducing reticence as origi-nally proposed by Warner (1965) but to identify and eliminate reticent respondents from the estimation of bribery indicators. A variant of this approach was proposed by Kraay and Murrell (2016) who identify reticent respondents based on a statistical model of re-sponse behavior using a combination of RRQ and conventional survey questions. Those methods have several important drawbacks. One of them is that they generally use ques-tions about sensitive behaviors other than corruption such as tax evasion (Clausen et al., 2011). The assumption is that it is not the subject of corruption that generates reticence, but that some respondents are intrinsically reticent to answer sensitive questions, while others are not. However, it may be that reticence is specific to the subject at hand: busi-ness owners and managers may be reticent to discuss corruption but not tax evasion if they are only guilty of the former.
managers in a business survey about public procurement. Section 6 provides robustness checks and Section 7 concludes.
2
Corruption in Public Procurement and
Back-ground on Madagascar
Public procurement - the process by which a public entity purchases goods and services - is widely recognized as a process highly vulnerable to corrup-tion, in both industrialized and developing countries (Søreide, 2002). Fur-thermore, concerns over allocation of public contracts is relevant given that in many countries, for expenditures other than salaries, public procurement is the most important channel for public fund allocation.
Corrupt practices in public procurement have been documented in different settings (Heggstad et al., 2010). Corruption in public procure-ment is a serious risk especially when public officials involved in public procurement have discretion in selecting contract recipients and when ac-countability mechanisms are either ineffective or non-existent. Institutional arrangements limiting public officials’ decision-making power in awarding contracts can reduce corruption opportunities. Also, administrative and criminal penalties for failure to comply with legal procurement procedures, together with effective complaint mechanisms, can deter temptations from public officials to break the rules (K¨uhn and Sherman, 2014).
2.1 Assessing the scope of the problem in Madagascar
Madagascar is a low-income developing country off the southeast coast of Africa with a population of 25 million and a GDP per capita of USD 400 (World Bank Indicators, 2018). It ranks 155 out of 180 countries in Trans-parency International’s 2017 Corruption Perception Index. In 2016, Mada-gascar allocated USD 193 million of government budget through public con-tracting, representing 1.9% of GDP or 11.6% of Madagascar’s national bud-get. Evidence indicate that public procurement in Madagascar is severely affected by corruption. According to the World Bank’s Enterprise Survey carried out in Madagascar in 2013, 43 percent of managers who secured or intended to secure a public contract in the year preceding the survey reported that firms similar to theirs must make illegal payments to public officials in order to secure contracts.
Furthermore, 2/3 of firms surveyed in the 2014 Transparency Interna-tional Corruption in Antananarivo’s Public Services (CAPS) survey6 who participated in at least one public tender during the two years prior to the
6
This survey was carried out in November 2014 among 436 firm owners and managers in the Malagasy capital.
survey reported that public procurement process in their business sector is unfair (Lesn´e and Rakotomamonjy, 2015).
2.2 Institutional arrangements in Madagascar
Such evidence of pervasive corruption in public procurement is observed de-spite the existence of a relatively stringent Public Procurement Code (PPC) in Madagascar. The PPC contains multiple provisions aimed at ensuring compliance with the principles of free access to public procurement, equal treatment for bidders and transparent procedures. It also includes rules limiting the value of contracts for each combination of category of contracts and contracting methods (Lesn´e and Hanitra, 2016).
Table 1 lists the characteristics of the three standard public contract-ing methods in Madagascar in increascontract-ing order of publicity requirements and other procurement rules stringency: direct purchase, consultation and open tender. In addition to these normal procedures, contracting authori-ties are allowed, in certain circumstances defined by the PPC, to bypass the usual rules of publicity and competition, and make use of two exceptional contracting methods: limited tenders and “over-the-counter” contracts.
Table 1 also shows the contract value thresholds determining which procurement methods can be used by contracting authorities to allocate public contracts. The less stringent normal procedure, direct purchase of goods or services, consists of awarding a contract by simply issuing an order form without requiring a minimum number of bidders. Direct purchase is allowed for small purchases below 1 to 7 million Ariary (USD 450-3,200) depending on the category of the good or service7. A more stringent pro-cedure, consultation, consists of awarding the contract at the lowest price among at least three different bidders. Furthermore, a minimum of 10 days of publicly visible publication is required before the date of proposal sub-missions. Consultation is allowed for contract value between 25 and 1,000 million Ariary (USD 11,400-455,500) depending on their category.
Above these value threshold, an open tender procedure is compulsory. In an open tender, the contracting authority is required to choose the lowest-priced bid among all those submitted (except for bids eliminated for being technically unsatisfactory), without negotiations and based on objective cri-teria previously communicated to bidders. More rigid publicity requirements are also compulsory with a public invitation to tender to be published in the Public Procurement Journal and in at least one approved national daily newspaper, at least 30 days before the final date for submitting bids.
7
Public contracts in Madagascar pertain to one of those four categories: Works, Sup-plies, Services and Intellectual services. Different thresholds apply within the Works category between “Road building and repair”, “Usual/recurring road maintenance” and “Other works”.
T able 1: Con tracting metho ds’ legal rules for publicit y , a w ards, maxim um con tract v alue (in Ariary) Con tracting Publicit y Aw ard Maxim um Metho d thresholds regularpro cedure Publishing a notice of Without negotiating and based public in vitation to tender on ob jectiv e criteria previously All con trac ts exceeding in the Journal des mar ch ´es comm unicated to bidders, the con tracting the maxim um amoun t Op en tender publics and in at least one authorit y cho ose s the lo w est-priced bid authorized for a appro v ed national daily newspap er among those submitted, except for bids consultation m ust at least thirt y da ys b efore eliminated for b eing tec hnically b e op en tenders. the final date for submitting bids. unsatisfactory . Road building 1 billion Publication b y p osting in a The order is a w arded to the bidder W orks Road main te n ance 500 million Consultation visible, publicly ac cessible place offering the lo w est p rice . T o b e v al id, Other w ork s 140 million at least ten da ys b efore the the consultation m ust compare Supplies 80 mill ion date for submittin g prop os als. prop osals from at least three bidders. Services 25 million In tellectual services 25 million The con tracting authorit y a w ards Road building 7 million the con tract to the service W orks Road main te n ance 7 million Direct purc hase No publicit y formalit y . pro vider or supplier of its cho osing Other w ork s 5 million b y simply issuing an order Supplies 1 mill ion form without requi ring a minim um Services 1 million n um b er of bidders. In tellectual services 1 million exceptionalpro cedure Limited tender Direct in vi tations to tender from a list of candidates The n um b er of pre-selected Limited tenders can b e of an y previously established b y the bidders m u st b e at least three. amoun t / ha v e no threshold. con tracting au thorit y. “Ov er-the No publicit y formalit y . The con tract is a w arded on the “Ov er-the-coun ter” con tracts -coun ter” basis of a direct and exclusiv e negotiation can b e of an y amoun t con tracts with the selected recipien t. / ha v e no threshold. Sour ce : L esn ´e and Hanitr a (2016) fr om PPC
While more stringent rules to allocate contracts make procedures more cumbersome for the contracting authority, those rules seek to ensure a level of competition compatible with sound management of public funds. Con-tracting authorities not complying with these legal rules are liable to sanc-tions. However, the relatively comprehensive legal framework in Madagascar is undermined by poor performance in the application of the law. Sanctions are rarely applied in practice, as in other weak governance environments.
The red flag corruption risk indicator presented in Section 3 identifies corruption prone contracts as those violating these various PPC rules.
2.3 Public procurement data
We use data from the Public Procurement Regulatory Authority (Autorit´e de R´egulation des March´es Publics - ARMP), the public body responsible for regulating and monitoring public procurement in Madagascar, to analyze compliance with PPC rules during the years 2013 and 2014. ARMP requires all public contracting authorities in the country to disclose every contract they award in order for the Treasury to disburse funds to pay for the goods or services. The list of all public contracts awarded the previous year is posted on ARMP’s website at the beginning of each year.
According to ARMP’s data set, 34,930 public contracts were awarded in 2013 and 2014 to 3,378 private enterprises by contracting authorities in Madagascar, totaling 639 billion Ariary (about USD 290 million). In terms of contract category, 77 percent of these public contracts were allocated for goods and supplies, 14 percent for services, 6 percent for public works and 3 percent for intellectual services.
As observed in Table 2, direct purchase is by far the most common contracting method for all categories of contracts. Consultations and open tenders are relatively more common for public works than for the other categories of contracts. Exceptional contracting methods - limited invitation to tender and “over-the-counter” contracts - only make up 0.4 percent of all contracts awarded in 2013-2014.
The average value of public contracts is about 18 million Ariary (USD 8,200), with a wide variance. Half of the contracts are worth under 2 million Ariary (USD 900), while the average value of the 3,500 most expensive con-tracts, the tenth decile of the distribution of contract values, is 155 million Ariary (USD 70,500).
T able 2: Distribution of the n um b er of con tracts a w arded in 2013-2014 b y category and con tracting me th o ds Go o ds and Services In tellectual Public T otal Share in supplies services w orks (in %) con tract v alue Op en tender 0.86 0.04 0.06 0.33 1.30 37.26 Consultation 6.42 0.58 0.55 2.49 10.05 18.47 Direct purc hase 70.00 12.99 1.88 3.38 88.24 23.95 Limited tender 0.11 0.02 0.01 0.16 0.30 13.22 Ov er-the-coun ter 0.03 0.01 0.01 0.06 0.11 7.08 T otal (in %) 77.43 13.64 2.51 6.42 100.00 100.00 Sour ce: A uthors
3
A red flag indicator of corruption risk in public
procurement
In this section, we develop a red flag indicator of public procurement cor-ruption risk that assesses compliance with PPC rules in contract awards.
3.1 A red flag indicator of corruption risk
Corruption risk in procurement has been associated with recurring observ-able patterns of irregularities for which indicators, sometimes called red flags, can be identified8. Among potential red flag indicators are for instance, the presence of a low number of bidders by contract, a very short time period for submitting bids, or multiple contracts awarded to the same firm by the same contracting authority over a short period of time (Wensink and Maarten de Vet, 2013 ; OECD, 2016 ; Fazekas et al., 2016).
Studies examining procurement risk indicators have so far focused pre-dominantly on assessing their validity as a measure of corruption risk, but few have been applied or tested (Ferwerda et al., 2017 ; Kenny and Musatova, 2010). A notable exception is Auriol et al. (2016), who tested a model of en-trepreneurial choices in a corrupt environment using procurement data from Paraguay, classifying as corruption-prone public contracts awarded through emergency procedures which significantly reduce corruption safeguards.
In the absence of perfect information or more direct corruption mea-surement tools, red flags can be used as proxies to measure corruption risk. The red flag indicator we propose in this paper relates to compliance by contracting authorities with legal bidding rules, in particular the use of an appropriate contracting method based on the contract value and category.
Public procurement officers may be tempted to deviate from prescribed procurement methods and make use for instance of consultations or direct purchases instead of open tenders to award public contracts to firms from which they receive bribes. Open tender contracts are harder to manipulate given that they have strict publicity rules and require convening a commit-tee at the level of the contracting authority which collectively decides on the bid to be selected. On the other hand, in a consultation, publicity is less restrictive and selection of the winner is left to the one public official responsible for awarding the contract. Direct purchasing is even less con-straining with no publicity requirements, leaving contracting officials free to deal directly with the firm of their choice.
Public procurement contracts allocation that violates the threshold ceil-ings values allowed by the law can be viewed as symptomatic of corrupt practices, which is what our red flag indicator intends to capture.
More specifically, our proposed red flag indicator is defined at the con-tract level as follows: the public procurement corruption indicator takes the value 1 if the public contract value is above the limits set by the law for its contract category (in this case: works, supplies, services or intel-lectual services) and contracting method (direct purchasing, consultation, open tender) chosen by the contracting authority; the indicator for the pub-lic contract takes the value 0 otherwise9.
More formally, a red flag contract is defined as: red flag =
(
1 if ContractV alue > T hresholdC,M 0 if ContractV alue ≤ T hresholdC,M
(1) Where C = categories and M = methods.
While failure to comply with legal bidding procedures is a proven driver of corruption in public procurement (K¨uhn and Sherman, 2014), it is nonetheless important to stress that this red flag indicator does not measure corruption per se but the risk of corruption. Indeed, using a less restrictive contracting method than the one required by the law may have other causes than corruption, including willingness from contracting authorities to speed up the award process, or ignorance of the legislation on the part of public officials responsible for awarding the contracts.
3.2 Computing the red flag indicator for Madagascar
Table 3 presents the proportion of 2013-2014 public procurement contracts in Madagascar that were awarded above the prescribed threshold value for their category and contracting method. We observe that 58.9 percent of public contracts during the period violated PPC rules, being consequently classified as red flag contracts. The use of an inadequate contracting method is much more common for direct purchasing - 66.4 percent of contracts allocated with this method are valued more than the threshold defined by the law for their category - than it is for consultations, as only 2.7 percent of those contracts do not comply with PPC requirements. One explanation is that direct purchasing being even less constraining than consultations (see Table 1), corrupt public officials may favor this contracting method as a more efficient option to allocate the contract to the bribe-paying firm.
Non-compliant contracts are relatively more common for intellectual services (77 percent) and services (67 percent) than for works (42 percent) and supplies (59 percent).
Contracting firms tend to receive multiple public contracts over the period considered, with an average of 10.1 contracts secured. The proportion
9
In Section 6, red flag criteria are extended to account for strategic behavior of public procurement officials circumventing the law rather than directly breaching legal rules.
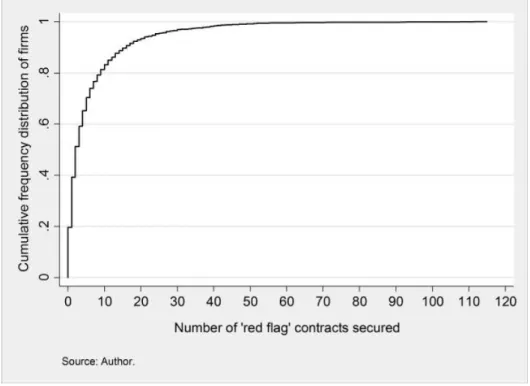
of firms which secured at least one red flag contract is 80.3 percent. Six red flag contracts were awarded to contracting firms on average in 2013-2014 (See Appendix A2). While about 2 out of 5 firms (39 percent) were awarded less than two red flag contracts, 1 in 5 (19 percent) secured 10 or more red flag contracts during the same period. Figure 1 presents the cumulative distribution of red flag contracts awarded per firm (see also Table 4, first 2 columns). We note that the number of red flag contracts awarded to a firm is significantly negatively correlated with its size and age, and positively associated with the firm operating in the trade sector (See Table 4).
A large majority of public contracts awarded in 2013-2104 violated government PPC rules. Firms repeatedly received contracts bypassing pro-curement rules. The total value of these non-compliant contracts were USD 48 million or 24.2 percent of the total value of public contracts during the period. This lack of compliance with PPC requirements points toward the lack of monitoring in Madagascar and near absence of effective sanctions whenever a breach in the procurement procedure is noticed. In a context of weak enforcement of the law, public officials face little constraints to bypass legal rules to their benefit.
In the next section, we turn to the question of determining if firm-level surveys allow grasping the problem of corruption accurately in the public procurement sector. We will then link the firm-level survey answers among public contract recipients with our red flag indicator to assess the answering behavior of respondents, especially for firms identified at risk of corruption.
4
Public Procurement and Corruption Survey
Given the extent of corruption risk in public procurement as measured by the red flag indicator, it is interesting to examine how conventional ways of obtaining information on corruption through firm-level surveys allow deci-phering properly corruption risks. How accurate are these voluntary reports of corruption through surveys of firms? In particular, how do firms more at risk of corruption behave compared to firms not at risk? In this section, we present the results of a firm level survey conducted among the recipients of public procurement contracts in 2013 and 2014 in Madagascar. Responses are linked with our red flag indicator computed at firm level. This survey will allow us to infer how experience of corruption affects firm’s behavior when asked to take part in a survey about public procurement and answer sensitive questions about corruption. We examine more specifically three elements, (i) are firms more at risk of corruption accept to participate to business surveys? (ii) do they use a strategy of non-response to specific ques-tions about corruption? and (iii) what are their assessment of corruption in the sector compared to compare to firms less at risk of corruption?
T able 3: R ed flag con tracts, b y con tracting metho ds and categories, in p ercen tage of con trac t n um b er (and v alue) Go o ds and Services In tellectual Public T otal in % T otal in % supplies services w orks of con tract n um b er of con tract v alue Consultation 2.41 16.26 2.07 0.46 2.71 1.31 Direct purc hase 64.69 69.66 99.08 71.78 66.42 23.00 T otal (in %) of con tract n um b er 58.69 67.02 74.37 37.96 58.89 24.26 Sour ce: A uthors T able 4: De scrip tiv e statistics of the firms surv ey ed, p er n um b er of re d flag con tracts secured Num b er of re d flag Distribution Av erage Prop ortion of firms with Prop ortion of firms con tracts secured of firms firm age few er than 5 emplo y ees in the trade sector 0 19.66% 12.45 78.52% 21.57% 1 19.59% 10.53 89.44% 28.62% 2 to 4 25.91% 10.19 93.34% 37.52% 5 to 9 16.16% 9.93 92.22% 31.77% 10 to 19 11.53% 10.39 91.93% 37.58% 20 or more 7.14% 9.39 95.38% 45.03% T otal 100.00% 10.58 89.68% 32.59% R 2 of the OLS regression of the n um b er of re d flag 0.0028 0.0067 0.0088 con tracts on the v ariable Prob > F = 0.0051 Prob > F = 0.0000 Prob > F = 0.0000 Sour ce: A uthors
Figure 1: Cumulative frequency distribution of firms, by number of red flag contracts secured
4.1 Survey background and methodology
A firm-level survey was conducted in Madagascar focusing on public pro-curement and corruption among firms awarded public contracts10 for which we drafted the survey instruments, organized the field work and monitored data collection carried out by the NGO Transparency International.
The sample is composed of 434 owners and managers of Madagascar-based firms. The survey was administered online (self-administered) and by phone between September and November 201511. The self-administered online questionnaire and the questionnaire administered by interviewers over the phone were identical12.
Steps used to create the survey sample are described in Figure 2. The sample population is based on the ARMP list of public contractors in 2013 and 2014. The population is constituted of 3,378 private firms which secured at least one contract among the 34,930 public contracts awarded in 2013 and 201413. Given the absence of information on firms other than their names in the ARMP database, information on firm characteristics, including contact information, legal form, staff size and business sector were obtained through matching with the Madagascar National Statistics Institute (INSTAT) busi-ness listing.
Matching was successful for 2,433 firms, a 72 percent matching rate14. Among them, 1,146 firm owners and managers from 1,204 firms15 were
suc-10
Surveyed firms were informed of the general purpose of the survey, but not of the fact that the questionnaire would ask them about their experience and perception of corruption. However, in view of the reputation of Transparency International in the field of anti-corruption, it is likely that a number of firm owners and managers interviewed anticipated that the survey would deal with this topic.
11
By default, the survey was administered online, using the software tool Esurvey (www.esurveycreator.com). When surveyees claimed not having an email address which their unique web link to the online survey could be sent to during their first phone contact with Transparency International, they were given the option of being surveyed by phone. 12Answering options “I don’t know” or “I don’t want to answer” were not proposed in the online questionnaire, but a mention appearing at the beginning of the survey invited respondents to skip to the next question if they could not or did not wish to answer a specific question. Interviewers administering the phone survey were instructed not to offer these non-response options, but to accept them if the respondent spontaneously brought up either one of them.
13Ten state-owned firms listed among the entities having secured public contracts in 2013 and 2014 were omitted from the study.
14
Incorrect transcription of the names of contractors in the ARMP list likely explain some mismatches between the two databases, together with some firms not being registered in the INSTAT database.
15Respondents owning or managing several firms which secured at least one public contract in 2013 or 2014 answered the survey questions only once based on their experience obtained from all their firms. Two firms were identified as belonging to the same individual when they shared the same telephone number in the INSTAT database (47 cases), or when the same email address was supplied when these firms were first contacted (18 cases).
cessfully contacted16using INSTAT phone information17. Among those, 215 completed the online survey18. In addition, 219 firms without internet or an email address completed the phone survey, for a total of 434 respondents19.
4.2 Survey results on reported bribery
The survey questionnaire was composed of 12 questions and focused on is-sues relating to public procurement, such as the performance of the public authorities with respect to paying for the services according to the agreed time line. Only one question dealt explicitly with corruption and was asked at the end of the survey, in order to reduce potential reticence from re-spondents20. The corruption question asked respondents to estimate the percentage of the overall value of a public contract that firms similar to theirs have to spend, on average, in informal payments and other gifts to public officials to secure it21. Indirect questioning seeks at reducing reticence and corresponds to the most standard approach used in firm level surveys asking corruption questions such as the WBES, as discussed above.
For the remainder of this paper, the unit of analysis is the firm. There-fore, the red flag indicator is aggregated at firm-level, being now defined as the number of contracts secured by firms that were allocated with a con-tracting method disallowed by the PPC22. Appendix A provides descriptive statistics on public contracts awarded to contracting and surveyed firms.
16Interviewers asked to reach the person most able to answer procurement-related ques-tions within the firm, usually its owner or manager.
17
A telephone number was mentioned for 1,545 contracting firms in the INSTAT database. However, a significant proportion of these telephone numbers were found to be out of order or erroneous.
18This represents 39 percent of firms which provided a valid email address enabling them to receive a unique, personal link to the survey. Two reminder emails, with follow-up calls, were sent to firms which had not yet completed the survey, seven and fourteen days respectively after a first email was sent with their link to the web questionnaire. Surveyees who did not complete the online survey despite both reminders were not given the option of completing the survey by phone, unlike those who said they did not have access to an email address when they were first contacted.
19Potential biases associated with selection at the participation level are examined in Section 6.
20The decision to include only one question on corruption in the survey questionnaire was also made to encourage candor, by avoiding too much focus on corruption in the survey so as not to create suspicion among respondents regarding the motive for the study.
21
The exact wording of the question was the following : “In your opinion, what per-centage of the total value of a public contracts firms similar to yours have to spend, on average, in informal payments and other gifts, in order to secure it?”
22
For respondents owning or managing more than one firm, the survey referred to all those firms simultaneously. To correct for the redundancy of those observations in firm-level analysis, weights inversely proportional to the number of firms belonging to each respondent are applied in all subsequent analyses.
ARMP database 34,930 public con tracts a w arded in 2013 and 2014 3,378 con tracting firms (ARMP) INST A T datase 2,433 firms 1,204 firms 1,146 p eople In ternet sur v ey 215 resp onden ts Phone surv ey 219 resp onden ts T otal 434 resp onden ts R ec onciliation Contact Figure 2: Steps in creating the surv ey sample
5
Using the red flag indicator to identify reticent
respondents
To which extent firms with more personal experience of corruption behave differently from firm without such experience in providing information about corruption in a business survey? We investigate this question using the number of red flag public contracts awarded to a given firm as a proxy for the intensity of its experience with corruption.
Indicators for the magnitude of bribery generated from business survey data can be very sensitive to the way survey questions are phrased. Following Clarke et al. (2015), Azfar and Murrell (2009), we focus on bribe frequency, that is whether respondents reported a positive bribe, rather than on the amount of bribes reported, which has been shown to be less sensitive to question wording. We proxy the experience of corruption by the number of red flag contracts awarded to the firm, as described in Section 3.
We make use of a binary response model, most specifically a probit model, given that agreeing or refusing to take part in the survey, responding or not to a question about corruption, or estimating a positive versus a zero magnitude of bribery, are all events offering only two options.
We estimate a probit model of the following form:
P rob(yi= 1) = Φ(δ0Zi) (2)
Where binary outcomes evaluated at firm-level i are noted yi, with Zi a set of independent variables which is the number of red flag contracts obtained by the firm, the number of contracts complying with public pro-curement regulations (called white flags) also awarded to the firm23, as well the square terms and the linear interaction of these two variables24, δ is the vector of associated coefficients and Φ the standard normal distribution function.
We refer to this specification as the basic model in the rest of the paper. An alternative specification, called the extended model, includes in addition a series of variables controlling for firm characteristics, in particular the
23
Adding to the model the number of contracts awarded to the firm complying with public procurement regulations allow to account for the size effect associated with the overall number of contracts obtained by the firm. The variable for the number of contracts compliant with legal rules was preferred to the total number of contracts secured by the firm to avoid multicollinearity with the number of red flag contracts. The Pearson correlation coefficient between the red flag and white flag variables is 0.68 for an average Variance Inflation Factors (VIF) of 1.87.
24
Squared terms of both the number of red flag and white flag contracts and their linear interaction are added to the model in order to capture non-linearities in the effect of the number of corruption-prone and corruption-free contracts on the outcome variables.
firm’s age (in years), number of employees25 and main line of business26. In addition, dummy variables are introduced for survey administration meth-ods (online vs. phone) and interviewers carrying out the questionnaire when the survey was administered by phone27.
The extended version of the probit model can be expressed as follows: P rob(yi= 1) = Φ(α + β1 redf lagi+ β2 whitef lagi+ β3 (redf lagi2)+
β4 (whitef lag2i) + β5 (redf lagi∗ whitef lagi) + γ0Xi) (3) With redf lagi and whitef lagi the number of contracts secured by firm i that respectively breach and comply with legal contracting rules and γ0Xi the vector of additional control variables and associated coefficients. The re-gression model is estimated with maximum likelihood. Results are presented in Table 5.
5.1 Survey participation
Let’s first examine the effect of the experience of corruption on survey par-ticipation. As mentioned above, the number of firm owners and managers who agreed to take part in the survey was 434 out of a total of 1,146 initially contacted, a proportion slightly above one-third (38 percent).
Among those, 83.1 percent were firms with a positive number of red flag contracts, compared to the 80.3 percent of firms in the whole population that have secured at least one such red flag contract in 2013 or 2014 (see Section 3). Controlling for firms’ characteristics, we observe in Table 5 columns (1) and (2) that the number of red flag contracts secured by firms does not significantly influence their likelihood of taking part in the survey, with or without the additional control variables of the extended model.
Hence, if the number of red flag contracts obtained by a firm is a good proxy of its personal experience of corruption in public procurement,
25The variable classifies the number of employees into four groups: 0 employees, 1 to 4 employees, 5 to 9 employees and 10 or more employees. These categories are taken from the INSTAT database, except for the last one originally broken down into six subcategories whose frequency did not exceed 2 percent of the sample and which were grouped together for better statistical power.
26The main line of business is classified into five groups: business services (34.2 percent), wholesale trade (20.0 percent), construction and public works (14.2 percent), retail trade (12.6 percent) and transport (6.5 percent), to which is added an “other” category that includes another 12.6 percent of firms.
27Regressions combine phone and internet data. Chow tests applied to the basic and extended models conclude that the coefficients of the variables of interest from regressions carried out separately for each administration method are not statistically different at conventional levels. P-values of the tests are 13.4% (basic model) and 8.0% (extended model) for the participation regression, 68.3% (basic) and 73.8% (extended) for the non-response regression and 29.5% (basic) and 36.6% (extended) for the zero regression.
such experience does not appear to be a significant criterion for firms to agree or decline to take part in a survey about public procurement28. This result is consistent for instance with Tourangeau and Yan (2007) who noted that while many researchers consider that topic sensitivity poses a threat to achieving high unit response rate, evidence in support of this belief is scarce.
5.2 Corruption question non-response
While firms with more direct experience of corruption may be as inclined as others to participate in business surveys, they may choose not to answer questions on sensitive topics such as corruption.
Non-response is of concern for the bribery question. The response rate to all survey questions is above 90 percent, with the exception of the question asking respondents about their perception of corruption29. The response rate to this question is only about 60 percent (see Appendix B)30. In addition to the sensitive nature of the question, this low response rate may also be explained by its more complex wording and the fact that the question is asked indirectly. Indeed, the corruption question is the only one asking respondents to assess the behavior of businesses similar to theirs rather than their own firm31.
Let’s now examine the relationship between corruption experience and the probability to answer a question about corruption. More specifically, we examine the relationship between the number of red flag corruption-prone contracts secured by a firm and the probability of a firm’s owner or manager not answering a survey question asking them to estimate the magnitude of bribery in public procurement. Among firms awarded at least one red flag
28
It is worth noting that the role of the surveyor on the participation decision is not negligible. The participation rate is significantly lower for one of the two interviewers who administered the survey by phone (30 percent), compared to the other surveyor (43 percent) and the online participation rate (39 percent).
29
This is question 10 in the survey questionnaire. See Table 6.
30It is worth noting that the response rate to the corruption question is significantly lower for the phone survey (44.8 percent) than for the online survey (76.7 percent). The response rate to the two administration methods is similar for the other eleven ques-tions. This result is consistent with the literature on social desirability bias (Tourangeau and Yan, 2007), which predicts that answering sensitive questions is not as easy in direct contact with an interviewer, even by phone, as via a self-administered questionnaire. Cau-tion is nonetheless required when comparing response rates to the internet and telephone components of the survey as the method of administering the questionnaire is possibly en-dogenous to the perception and experience of corruption. Only firm owners and managers who claimed they did not have an email address during their first phone contact with Transparency International were given the option of completing the survey by phone.
31
For the sake of comparability, this question was purposely phrased similarly as the corresponding question asking about the magnitude of bribery in public contracts in the World Bank Enterprise Survey standard questionnaire.
contract, 57.3 percent have provided an answer to the corruption question while the proportion of answers from firms which only obtained white flag contracts is 76.8 percent.
Looking first at the basic probit model, which includes as explanatory variables only the number of red flag and white flag contracts secured by the firm as well as the square of these variables and their interaction (Table 5, column 3), we observe a positive and significant relationship at 5 percent level between the probability of item non-response and the number of con-tracts at risk of corruption awarded to a firm. However, using the extended model, we observe that this relationship is not robust to the inclusion of the additional control variables, in particular the dummy variables for the survey administration methods and surveyors (Table 5, column 4).
It therefore appears that experience of corruption, as measured by the number of public contracts at risk of corruption obtained by a firm, has no significant effect on the likelihood of that firm’s owner or manager agreeing to answer a survey question about corruption in public procurement.
These findings reject the hypothesis that respondents with greater ex-perience of corruption are more inclined to refuse addressing corruption in business surveys (Jensen et al., 2010) as well as its opposite proposition that corrupt firm owners and managers are more likely than others to respond to corruption questions, so as not to “appear guilty” (Clarke et al., 2015).
5.3 Estimates of bribery
Declining to take part in a survey or not answering sensitive questions about corruption do not seem to be strategies used by firms to conceal their expe-rience of corruption, at least in the context of Madagascar’s public procure-ment sector. Still, survey respondents may not always honestly disclose their true experience of corruption when providing an answer to those questions. Table 6 presents a tabulation of the responses to the corruption ques-tion. Appendix B summarizes survey results for all survey questions for the overall sample, as well as for each survey administration method separately. As observed, 44.9 percent of respondents report positive bribes associated with public contracts. It is interesting to note that this result is very similar to the estimates of the 2013 World Bank Enterprise Survey in Madagas-car, which reported a 43 percent frequency of bribe payments. Firms which secured at least one red flag contract are 42.3 percent to report a strictly pos-itive level of corruption in public contracting, to compare with 57.8 percent for contracting firms that were awarded only white flag contracts.
About 1 in 6 of all survey respondents (15.7 percent) reported that firms similar to theirs are never required to make gifts or informal payments to public officials in order to secure contracts. Among firms which were awarded at least one red flag contract, 1 in 5 (19.1 percent) estimate that corruption in non-existent in public procurement.
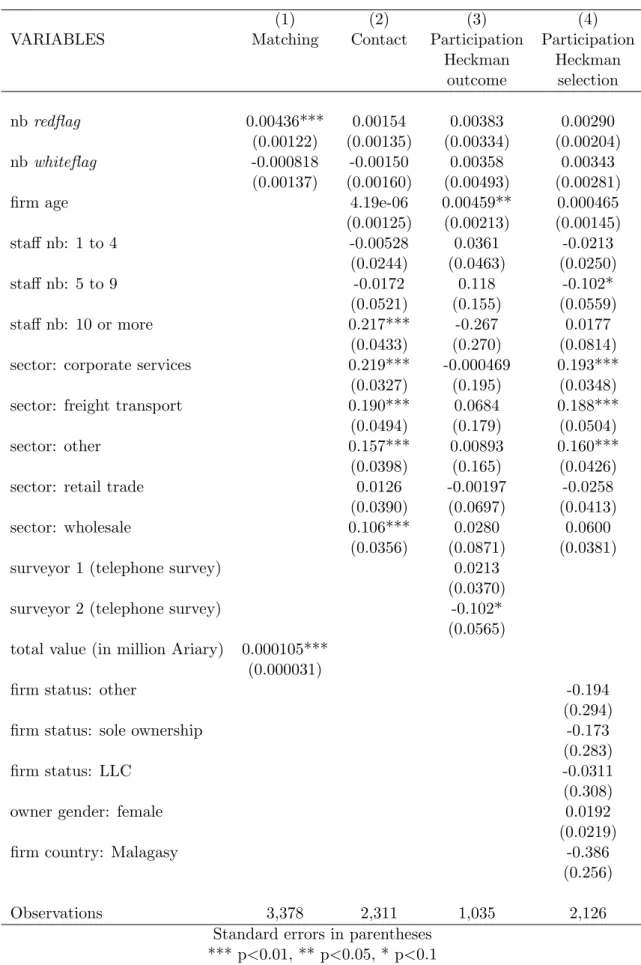
T able 5: Re gr e ssions (a v erage marginal effects) (1) (2) (3) (4) (5) (6) V ARIABLES P articipation P articipation Non-resp onse Non-resp onse Zero estimation Zero estimation Basic Mo del Extended Mo del Basic Mo del Extended Mo del Basic Mo d e l Extended Mo del n b re dflag 0.00269 0.00343 0.00854** 0.00192 0.00722** 0.00838*** (0.00272) (0.00278) (0.00436) (0.00451) (0.00290) (0.00294) n b whiteflag 0.00298 0.00411 0.000589 0.00281 -0.000269 -0.00145 (0.00402) (0.00408) (0.00716) (0.00712) (0.00465) (0.00467) firm age 0.00330* 0.00263 -0.00148 (0.00181) (0.00287) (0.00204) staff n b: 1 to 4 0.0325 0.0921* -0.0393 (0.0350) (0.0512) (0.0365) staff n b: 5 to 9 0.138* 0.0832 -0.0292 (0.0811) (0.110) (0.0806) staff n b: 10 or more -0.231*** 0.0904 0.419*** (0.0451) (0.142) (0.128) sector: corp orate services 0.00189 0.0589 0.0584 (0.0505) (0.0759) (0.0556) sector: freigh t transp ort 0.0604 0.00674 0.0830 (0.0695) (0.1000) (0.0807) sector: ot her 0.0266 -0.0882 0.0438 (0.0589) (0.0863) (0.0660) sector: re tai l trade -0.0198 0.100 0.0318 (0.0626) (0.0989) (0.0696) sector: wh ole sale 0.01000 0.100 0.0472 (0.0556) (0.0866) (0.0613) surv ey or 1 (telephone surv ey) 0.00777 0.290*** 0.00473 (0.0342) (0.0523) (0.0384) surv ey or 2 (telephone surv ey) -0.107*** 0.345*** 0.0770 (0.0355) (0.0628) (0.0494) Observ ations 1,204 1,146 463 442 463 442 Standard errors in paren theses *** p < 0.01, ** p < 0.05, * p < 0.1
T able 6: Answ ers Answ ers to the corruption q ues tion , for all resp onden ts and b y administration mo de 0% 0.1% to 9.9% 10% to 29.9% 30% to 100% No answ er Obs. All resp onden ts 15.7 9.9 20.0 15.0 39.4 434 In ternet 13.5 15.8 32.6 14.9 23. 3 215 T elephone 17.8 4.1 7.8 15.1 55.3 219 Question 10: In your opinion, what p er centage of the total value of a publ ic contr act do firms similar to yours usual ly have to sp end on informal p ayments and other gifts to se cur e the contr act?
Let’s examine the relationship between corruption experience and the probability to report the absence of corruption in the sector. Examining first the basic probit model, Table 5 (column 5) reports the average marginal effects of the variables on the likelihood of respondents estimating a zero magnitude of bribery in the process of securing public contracts for firms similar to theirs (versus not answering the question or estimating a strictly positive magnitude).
We observe that the number of red flag contracts secured by a firm has a positive and statistically significant effect on the likelihood that the firm’s owner or manager denies the existence of bribery in public procure-ment. The proportion of zero estimates of the magnitude of bribery in public procurement in the overall sample is 15.7 percent. One additional red flag contract awarded to a firm is associated with an additional 0.72 percentage point of probability of that firm providing a zero estimate of bribery, all other things held equal.
On the other hand, the number of secured contracts that complied with competitive rules (white flag) are not associated with the probability of a zero response to the question asking respondents to estimate the magnitude of corruption in public procurement for firms similar to theirs.
Including the additional control variables of the extended model (Table 5, column 6) increases the statistical significance and the magnitude of the average marginal effect of one additional red flag contract to 0.84 percentage points.
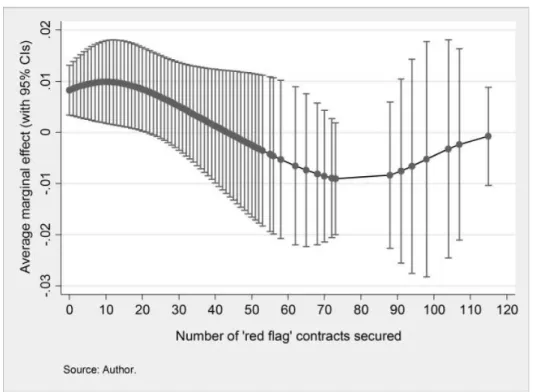
Using the extended model, Figure 3 shows that the marginal effects of securing one additional red flag contract on the probability of reporting the absence of corruption is greater when the respondent’s initial number of red flag contracts is low.
This decreasing average marginal effect result is not surprising as it is reasonable to expect that an additional experience of corruption has a greater influence on the behavior of a respondent when it is unusual in the first place. The average marginal effect scales down when the number of red flag contracts initially secured by the firm is over 11, becoming non-significant at 5 percent with more than 22 red flag contracts. It should be noted, however, that 94.6 percent of contracting firms secured less than 23 red flag contracts over the period considered.
Summarizing our findings on firm responses, firms with more experi-ence of corruption do not decline more often than others to take part in a survey or to answer a specific question about corruption. However, they tend to provide lower estimates of corruption by denying more frequently the existence of corruption.
Figure 3: Average marginal effects of red flag contracts on the likelihood of respondents providing a zero estimate of bribery, per initial number of
6
Robustness checks
6.1 Selection
A concern is sample selection bias. Selection bias may occur due to mis-matching between the ARMP contractors list and the INSTAT business database, or because of unsuccessful attempts to contact firms, dropping from the sample firms whose behavior may be systematically different from those included in the sample32.
As discussed in Section 4, reconciliation between the ARMP and IN-STAT datasets, which was required in order to contact firms awarded public contracts in 2013 or 2014, was successful for 72 percent of firms having re-ceived at least one public contract. For unmatched firms, only information about the number of red flag and white flag contracts they secured and the value of those contracts are available from the ARMP database.
The likelihood that reconciliation was successful is significantly posi-tively correlated with the number of corruption-prone contracts secured by a firm (Appendix C, first column). The effect is small, however. One addi-tional red flag contract awarded increases the likelihood of reconciliation by 0.4 percentage points. The total value of contracts secured by the firm is also statistically significantly but quantitatively weakly related to the likelihood of reconciliation: 10 million additional Ariary (about USD 4,500) increase this probability by 0.1 percentage point. In contrast, the number of white flag contracts secured has no effect on the probability of the matching being successful.
Firms which were successfully contacted by phone are larger than aver-age and operating in a greater proportion in wholesale trade, corporate ser-vices and freight transport. The number of red flag and white flag contracts awarded are not significantly associated with the likelihood of successful contact with the firm (Appendix C, second column).
A Heckman selection model is used to test selection in relation to par-ticipation in the survey among firms who were matched successfully with the INSTAT database33 (Appendix C, third and fourth columns).
In addition to the variables of the extended model, the selection re-gression includes as exclusion restrictions the gender and nationality of the
32Another limitation to our study is that only firms who secured at least one public contract in 2013 or 2014 have been sampled in the survey. This is due to data limitations as information on competing but losing firms were not available in the ARMP database. In addition, since the survey was specifically about public procurement, non-competing firms to public contracts were also excluded from the survey sample.
33The Heckman model fails to converge when applied to regressions explaining non-response and zero estimates to the corruption question, even when the number of exclu-sion restrictions is lowered to one. However, the absence of a selection problem at the participation stage makes selection issues unlikely for a particular question of that survey.
respondent, as well as dummies for the firm’s legal form.
The Heckman model rejects the existence of a selection bias at the participation stage, with a p-value of 0.99434.
6.2 Exclusion of respondents not confirming contracts
Another concern is to identify non-candid respondents to other questions of the survey. In particular, the first question of the survey asked respondents if they were awarded at least one public contract in 2013 or 2014. Given that the sampled firms were taken from the ARMP database, all were recipients of at least a public contract during the period. This question was meant to evaluate if respondents were aware of this fact and candid about it. About 16 percent of respondents did not confirm that their firm secured at least one public contract in 2013 or 2014. All but five of these 68 respondents not confirming this fact completed the online survey35 (Appendix B).
Regression results are robust to the exclusion of the respondents who did not confirm that their firm secured public contracts36(see Appendix D). In particular, the influence of the number of corruption-prone contracts on a firm’s decision to accept or refuse to answer the question on corruption is still statistically insignificant in the extended model.
Furthermore, the likelihood of respondents denying that corruption ex-ists in public procurement is still positively associated with the number of red flag contracts their firm secured, with an average marginal effect similar to the one obtained with the full sample.
6.3 Refinement of the red flag indicator
Yet another concern for the robustness of our results is the reliability of our measure of experience of corruption. Our red flag indicator used as a proxy for corruption in public procurement is defined at contract level on the basis of whether the contract value is within the boundaries allowed by the Public Procurement Code for its category and contracting method. However, public
34This evaluates with a t-test whether atanh(ρ) - the hyperbolic tangent of ρ, the correlation coefficient between the error terms of the selection and outcome regressions -has an influence on the participation variable.
35
It is possible that some respondents got confused by the term “public procurement” which has a formal connotation, although it actually refers to all purchases from public entities, not just large contracts put out for tender. The phone survey made it possible to clarify this point, something which could not be done for the online survey.
36On average, those respondents secured 4.5 red flag contracts compared to 7.4 for respondents who confirmed that their firm secured at least one public contract, a difference significant at 1 percent. The number of white flag contracts obtained by both groups of respondents is not significantly different at conventional levels. Not acknowledging being a contracting firm is unlikely to be a strategy used by corrupt firms to hide their behavior.
contracting officials may prefer to circumvent rather than infringe the legal rules to avoid being sanctioned for their favoritism. We develop a refined version of the red flag indicator adding to the blatant disregard for legal rules three further identification criteria (i) contract value just below category thresholds, (ii) contract splitting (iii) exceptional purchase mechanism.
6.3.1 The contract value is just under thresholds for
consulta-tions/tenders
As discussed in Section 2, according to Madagascar’s Public Procurement Code the prescribed contracting methods – direct purchasing, consultation or open tender – are determined by the value and category (supplies, intellec-tual services, services or works) of the contract. The contracting authority has the responsibility of estimating the value of the contract and is expected to make a sincere, reasonable assessment based on its actual needs and the price normally paid for these services (Lesn´e and Hanitra, 2016).
Given that contracting methods differ in how strict they are in terms of procedures and publicity requirements, a public official wanting to favor a specific firm may choose to circumvent the rules by assessing the value of the contract just below the category threshold, in order to benefit from less strict rules governing lower categories.
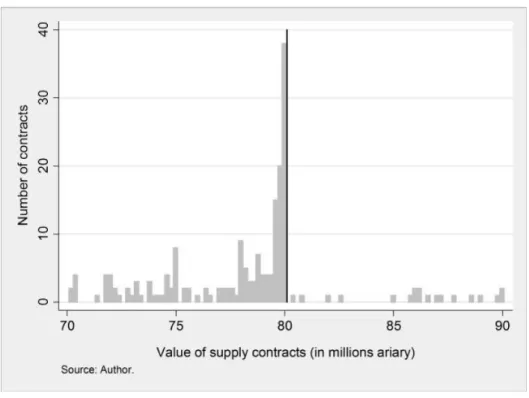
This practice of allocating a contract just below the threshold value is common in Madagascar. As illustrated by Figure 4, a relatively large number of contracts are awarded just below the open tender threshold of 80 million Ariary for the case of supply contracts (see Table 1) in order to use the consultation method. This suggests that the value of many of these contracts has not been determined objectively but with the aim to avoid the greater competition and stricter rules of an open tender. Similar patterns are observed just below the thresholds applying for consultations.
It should be noted, however, that this practice is not necessarily due to corruption. A public official may wish to resort to a consultation or a direct purchase in order to avoid the administrative burden of a more demanding procedure or to expedite the decision. Still, circumventing competitive bid-ding rules is a sign of mismanagement, itself symptomatic of a corruption risk. Hence, in addition to contracts in blatant breach of legal rules regu-lating public contracting methods, the refined red flag indicator classifies at risk of corruption a contract with a value of less than 5 percent under the maximum limits for open tenders or consultations.
Among the public contracts awarded in 2013 and 2014, 1,202 (or 3.4 percent) have a value of less than 5 percent under the maximum limit for open tenders or consultations and are therefore classified as red flag contracts in the refined version of the proxy indicator.
Figure 4: Distribution of contracts for supplies by their value, for contract value between 70 and 90 million Ariary
6.3.2 The contract is suspected of being artificially split
Another way of circumventing competitive bidding rules is to split a contract into several smaller contracts with a value lower than the maximum limit of the desired contracting method. Accordingly, the refined red flag indicator accounts for potential contract splitting. In particular, contracts awarded by a contracting authority for the same purpose and secured by the same contractor in the same year are considered at risk of corruption in the refined version of the red flag indicator if their combined value exceeds the legal threshold of the contracting methods chosen for all these smaller contracts37. Among the public contracts awarded in 2013 or 2014, 2,039 contracts (or 5.8 percent of all contracts) satisfy this condition, making them suspect of being artificially split and hence classified as corruption-prone38.
6.3.3 The contract is awarded via an exceptional purchase
mech-anism
According to the Madagascar PPC, the contracting authorities are allowed in some circumstances to waive the normal competitive bidding rules and use the so-called exceptional procedures of “limited tender” and “over-the-counter contract” (gr´e `a gr´e)39. Recourse to an exceptional procedure by contracting authorities must be approved by the ARMP prior to the award of the contract, and only for reasons permitted by the law, such as proven emergency or high confidentiality of the service or good requested by the public authority.
However, as emphasized by Auriol et al. (2016), contracting authorities may also request exceptional procedures with the sole purpose of avoiding regular competitive bidding rules. Since determining whether this recourse is justified or not is not possible with the ARMP data, we classify at risk of corruption all contracts awarded via an exceptional procedure in the refined version of the red flag indicator.
As observed in Table 2, 0.4 percent of the 34,930 contracts awarded in
37
In order to do this, we classified the 34,930 contracts into 30 separate groups according to the description of their purpose provided in the ARMP database.
38In order to make the refined red flag indicator robust to the various contract-splitting schemes, each firm that secured a contract suspected of being artificially split is assigned an additional red flag count of 1/n for this contract, with n being the number of contracts affected by the split. Without this correction, a firm with a contract split into three lower-value contracts, for example, would be considered to have more experience of corruption than a firm with a contract divided into two lower-value contracts, even if the overall value of these contracts were to be equal.
39
A limited invitation to tender differs from an open invitation to tender in that ap-plicants authorized to bid are preselected by the contracting authority. A gr´e `a gr´e is negotiated directly between the contracting authority and the firm of its choosing, no matter the value of the contract. See Table 1.
2013 and 2014 were attributed with an exceptional procedure (0.3 percent by limited tender and 0.1 percent by gr´e `a gr´e). These contracts are hence classified as corruption-prone in the refined red flag indicator definition.
Contracts allocated with an exceptional procedure are often of a large value. The median value of contracts awarded via an exceptional procedure is 200 million Ariary compare to 2 million Ariary for contracts attributed with a regular contracting method. Half of these exceptional contracts (50 percent) are for public works and 34 percent for supplies. Finally, almost all these contracts (97 percent) originate from public authorities located in the capital city, compared to 55 percent for regular contracts.
6.3.4 Results of the refined red flag indicator
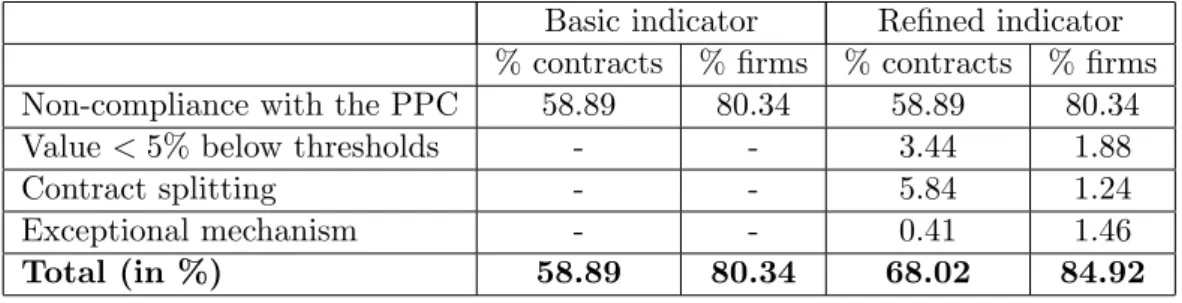
The refined red flag indicator adds an additional 3,190 contracts (9.1 per-cent of the total number of contracts) to the initial red flag indicator defi-nition, with 23,759 contracts overall being considered at risk of corruption, or 68 percent of the 34,930 public contracts awarded in 2013-2014. The two versions of the indicator are, however, highly correlated with a Pearson’s correlation coefficient of 0.92. Unsurprisingly, more firms have secured at least one red flag contract in 2013-2014 with the refined red flag indicator: 84.9 percent to compare with 80.3 percent with the initial red flag definition. Table 7 summarizes the criteria defining the basic and extended red flag corruption risk indicators and the associated share of public contracts that satisfy those criteria.
According to the refined definition of our red flag indicator, 84.9 percent of contracting firms in Madagascar have been awarded at least one public contract at risk of corruption in 2013 or 2014. This is 4.6 percentage points more than the basic red flag indicator, for which 80.3 percent of contracting firms are classified as having won at least one red flag contract.
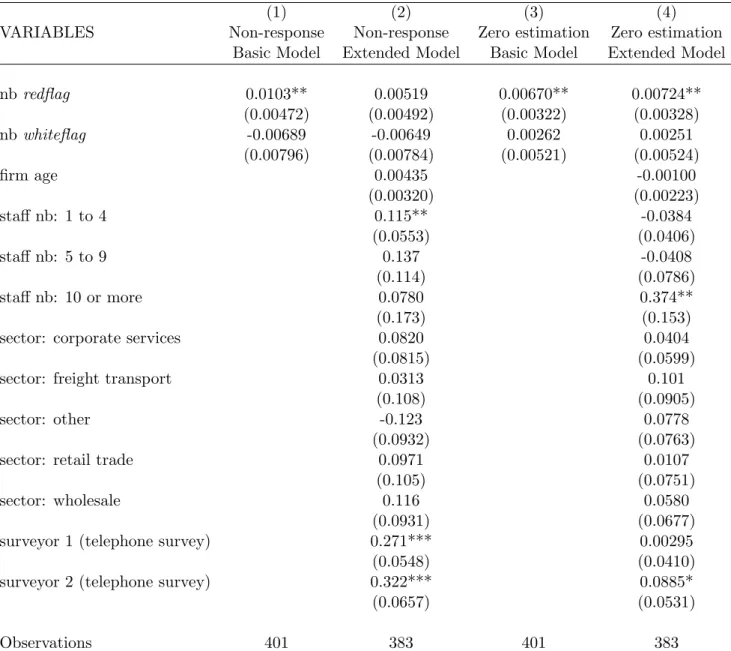
Regression results remain qualitatively unchanged using the refined red flag indicator (see Appendix E). The experience of corruption is still signifi-cantly associated with the probability of respondents reporting the absence of corruption in public procurement. The average marginal effect of one ad-ditional red flag contract won by firms on their probability of estimating a zero magnitude of corruption in public procurement is 0.88 percentage point in the extended model, compared to 0.84 percentage points with the original red flag indicator. Furthermore, the experience of corruption is consistently not associated with denial to participate in the survey or to answer a sensi-tive question about the prevalence of corruption in public procurement.
Table 7: Share of contracts and firms meeting criteria for red flag indicators
Basic indicator Refined indicator
% contracts % firms % contracts % firms
Non-compliance with the PPC 58.89 80.34 58.89 80.34
Value < 5% below thresholds - - 3.44 1.88
Contract splitting - - 5.84 1.24
Exceptional mechanism - - 0.41 1.46
Total (in %) 58.89 80.34 68.02 84.92