HAL Id: hal-01484699
https://hal-univ-rennes1.archives-ouvertes.fr/hal-01484699
Submitted on 22 Jun 2018
HAL is a multi-disciplinary open access
archive for the deposit and dissemination of sci-entific research documents, whether they are pub-lished or not. The documents may come from teaching and research institutions in France or abroad, or from public or private research centers.
L’archive ouverte pluridisciplinaire HAL, est destinée au dépôt et à la diffusion de documents scientifiques de niveau recherche, publiés ou non, émanant des établissements d’enseignement et de recherche français ou étrangers, des laboratoires publics ou privés.
during physical stress testing
Mireia Calvo, P. Gomis, D. Romero, V. Le Rolle, N. Behar, P. Mabo, A.
Hernandez
To cite this version:
Mireia Calvo, P. Gomis, D. Romero, V. Le Rolle, N. Behar, et al.. Heart rate complexity analysis in Brugada syndrome during physical stress testing. Physiological Measurement, IOP Publishing, 2017, 38 (2), pp.387-396. �10.1088/1361-6579/aa513c�. �hal-01484699�
syndrome during physical stress testing
Calvo M1,2,3, Gomis P3,5, Romero D1,2, Le Rolle V1,2, B´ehar N4, Mabo P1,2,4, Hern´andez A1,2
1INSERM, U1099, Rennes,F-35000, France
2Universit´e de Rennes 1, LTSI, Rennes, F-35000, France
3Dept ESAII, CREB, Universitat Politecnica de Catalunya, Barcelona, 08028, Spain 4CHU Rennes, Department of Cardiology and INSERM, CIC-IT 1414, Rennes,
F-35000, France
5CIBER of Bioengineering, Biomaterials and Nanomedicine (CIBER-BBN),
Zaragoza, 50018, Spain
E-mail: [email protected] August 2016
Abstract. Symptoms such as ventricular arrhythmias in Brugada syndrome (BS) typically occur at rest, especially during sleep, suggesting that the autonomic nervous system (ANS) function may be relevant in the arrhythmogenesis of the disease. The aim of this work was to assess the ANS response captured by a non-linear heart rate variability (HRV) measure in 69 patients diagnosed with BS, who underwent a standardized physical stress test. Heart rate complexity (HRC) was evaluated by the power-law scaling analysis (β slope) during rest, exercise, recovery and rest post-recovery, in order to discriminate between symptomatic and asymptomatic BS patients. Symptomatic patients showed a significant reduction in HRC in comparison to asymptomatic subjects, after exertion (p=0.015); during the whole recovery period (p=0.023), and, in particular within the passive recovery phase (p=0.025), as well as during rest post-recovery (p=0.022). Based on these results, symptoms could be associated with a lower ANS complexity during the stress test stages where parasympathetic activity is predominant. Therefore, the proposed HRV indicators could be of help in the risk stratification of asymptomatic patients.
Keywords: Brugada syndrome, heart rate dynamics, autonomic nervous system, risk stratification, stress test
1. Introduction
Brugada syndrome (BS) is an inherited disorder characterized by a typical electrocardiographic pattern presenting a distinct ST-segment elevation in right precordial leads, associated with a high risk for unexpected sudden cardiac death (SCD) due to malignant ventricular arrhythmias in absence of any apparent structural
cardiopathy. Since its description in 1992 as a new cardiac disorder (Brugada & Brugada 1992), BS has raised a great interest because of its high incidence, especially in far eastern countries, and its relation to sudden death in young adults and, less frequently, in infants and children. It has been estimated that BS are responsible for 4-12% of the total amount of SCD and for 20% of SCD in patients without structural cardiopathy (Brugada, et al. 1998, Antzelevitch, et al. 2005). Although several indicators have been assessed for the prediction of cardiac events in BS, studies based on the largest clinical series only proved prior symptoms and spontaneous type-1 Brugada ECG pattern as consistent predictors of ventricular fibrillation (VF) episodes (Probst, et al. 2010). Thus, risk stratification in BS still remains controversial, especially for asymptomatic patients. However, by relating previous symptomatology with the occurrence of cardiac events in BS, the information provided from new indicators in symptomatic and asymptomatic patients can be compared and related to the prediction of VF events.
Since ventricular arrhythmias in BS typically occur at rest and mainly at night, it is commonly assumed that vagal activity may play a determinant role in the arrhythmogenesis of this disorder (Matsuo, et al. 1999, Kies, et al. 2004). Indeed, previous works, focused on the analysis of the autonomic nervous system (ANS) function using positron emission tomography, have identified sympathetic dysfunctions on BS patients (Kies et al. 2004, Wichter, et al. 2002, Bigi, et al. 2008, Paul, et al. 2011). Also, many previous works have studied the autonomic function of BS patients through HRV analysis (Krittayaphong, et al. 2003, Hermida, et al. 2003, Kostopoulou, et al. 2010, Nakazawa, et al. 2003, Makimoto, et al. 2010, Tokuyama, et al. 2014, Pierre, et al. 2007). However, these works are based on linear, time and frequency-domain methods, being unable to capture the complex, non-linear effects on heart rate (HR) regulation. We hypothesize that the evaluation of HR dynamics on BS patients through non-linear fractal methods may provide additional information for risk stratification in this population.
Moreover, the autonomic response can be better assessed by stimulating the ANS through controlled maneuvers such as physical exercise. Exertion provokes a sympathetic activity increase and a parasympathetic inhibition, leading to higher HR. Conversely, post-exercise cardiodeceleration is adjusted by a continued increase in parasympathetic activity (Imai, et al. 1994), as well as a progressive sympathetic withdrawal (Savin, et al. 1982). Since traditional HR analysis at rest commonly fails to distinguish between symptomatic and asymptomatic BS patients, we explored HR changes during physical stress testing. Indeed, (Makimoto et al. 2010) published the first work reporting the interest of exercise to predict ventricular arrhythmias in BS patients, focusing on recovery after exertion.
Approaches using the power-law scaling exponent (β) obtained from the regression line of Power Spectral Density (PSD) vs. frequency plot on a bi-logarithmic scale have shown decreased complexity in patients with cardiovascular disorders and sudden cardiac death events (Huikuri, et al. 2000, Huikuri, et al. 1998, Lombardi, et al. 2001, Gomis,
et al. 2006, Maestri, et al. 2007, Tapanainen, et al. 2002). However, we are not aware of any study that has analyzed the HR dynamics’ complexity (HRC) of symptomatic and asymptomatic BS patients under conditions of physical activity and recovery.
Thus, the aim of this manuscript was to compare, according to symptomatic status, the autonomic cardiac control captured by this non-linearcomplexityindicator from RR series, in 69 BS patients, for each phase of a standardized physical stress test. The role of complexity assessment would be helpful in risk stratification of asymptomatic BS patients for whom the decision to implant an Implantable Cardioverter Defibrillator (ICD) based on the benefit/risk for the patient is particularly complex.
2. Methods
2.1. Study population
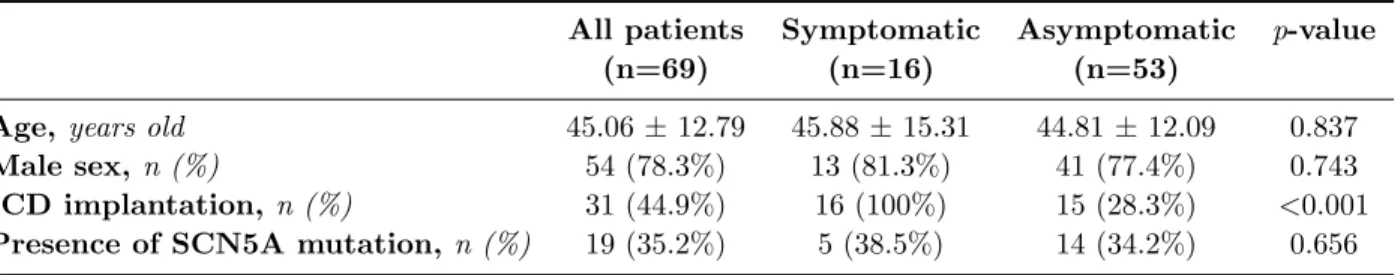
Sixty-nine Brugada syndrome patients underwent a physical exercise stress test while continuous ECG recordings were acquired. They were enrolled in 6 French centres: Rennes, Saint Pierre de la R´eunion, Nantes, Bordeaux, Brest and La Rochelle. After approval by the ethics committee of each centre, all participants provided informed consent to take part in the study, which was performed in accordance with the clinical research and ethics recommendations. Patients’ age ranged from 19 to 73 years old (45.06 ± 12.79 years old) and 78.3% were males. Table 1 summarizes participants’ baseline characteristics, where no significant differences in age and gender between patients included in the symptomatic and asymptomatic groups can be noted. Sixteen patients had the following documented symptoms: syncope (56.25%), cardiac arrest (25%), dizziness (18.75%) and, less frequently, palpitations (12.50%) and nocturnal convulsions (6.25%).
ICD implantation had been performed in 15 of 53 (28.3%) asymptomatic patients, based on a positive EPS (Electrophysiological Study) test, whereas all symptomatic patients were ICD carriers. Since no relevant cardiac episodes occurred during the test, these devices caused no significant effects on the recordings. Among 54 patients (13 were symptomatic) in whom genetic screening was performed, an SCN5A mutation was found in 19 (35.2%), from whom 5 were symptomatic.
Table 1. Patients’ baseline characteristics.
All patients Symptomatic Asymptomatic p-value
(n=69) (n=16) (n=53)
Age, years old 45.06 ± 12.79 45.88 ± 15.31 44.81 ± 12.09 0.837
Male sex, n (%) 54 (78.3%) 13 (81.3%) 41 (77.4%) 0.743
ICD implantation, n (%) 31 (44.9%) 16 (100%) 15 (28.3%) <0.001
2.2. Signal acquisition and test
Patients participated in a clinical protocol recommended by the American Heart Association (Gibbons, et al. 2002) described as triangular stress test since the load was increased until it reached the patient’s maximum potential. It was performed on a cyclo ergometer (Ergoline 900 Egamed, Piestany, Slovakia) and divided in the following phases:
• Resting phase: supine rest for 8 minutes and rest sitting on the bike for 2 more minutes.
• Exercise phase:
– Warm-up phase: for men, initial load of 50 watts (W); for women, initial load of 30 W, both for 2 minutes.
– Incremental exercise phase: for men, initial load of 80 W for 2 minutes and then incrementing 20 W every 2 minutes; for women, initial load of 50 W increasing load 20 W every 2 minutes.
• After exercise phase: – Recovery phase:
∗ Active recovery phase: for men, fixed load of 50 W; for women, fixed load of 30 W, both for 3 minutes.
∗ Passive recovery phase: total cessation of effort for 3 minutes.
– Rest post-recovery phase: supine rest until reaching 50 minutes of total recording, never exceeding 30 minutes of resting after recovery.
The purpose of the test was to reach at least 80% of the theoretical maximum heart rate, defined by the formula M HR = 220 − age (Fox & Haskell 1968).
The standard 12-lead ECG recording was collected and analyzed by the central board (Centre Hospitalier Universitaire de Rennes). It was acquired with the Holter monitor (ELA medical, Sorin Group, Le Plessis Robinsson, France) and continuously recorded at rest (from 10 minutes before warm-up phase beginning), during incremental exercise, recovery (6 minutes) and rest post-recovery. Since each test differed in the incremental exercise and rest post-recovery periods, the duration for these phases was fixed to 7 and 10 minutes, respectively, corresponding to the smallest duration found in the clinical series. Sampling frequency was set at 1000 Hz. Heart rate was continuously displayed and blood pressure measured with the sphygmomanometric method at rest, every two minutes during exercise, maximum effort and recovery.
RR series were obtained using a noise-robust wavelet-based algorithm for QRS complex detection and subsequent R-wave peak location (Dumont, et al. 2010). Since the result is a non-uniformly sampled RR series, a cubic splines interpolation was applied to signals in order to obtain regularly sampled data at a rate of 4 Hz.
Figure 1. Typical RR series obtained from a BS patient during stress test, showing each phase: (a) resting, (b) warm-up, (c) incremental exercise, (d) active recovery, (e) passive recovery and (f) rest post-recovery phases.
2.3. Power-law Scaling Analysis
The RR series in healthy subjects fluctuates in a complex way with a non-uniform pattern that has been associated with fractal behavior and, on a broadband spectrum, with a 1/f-like distribution (inverse power law). The β index measures the power-law behavior as the slope of the regression line calculated by the least-squares method on the linear portion of PSD against frequency plots on a bi-logarithmic scale. Several studies have employed the frequency band 0.0001-0.01 Hz to analyze long-term fluctuations when evaluating sudden cardiac death and myocardial infarction (Huikuri et al. 1998, Tapanainen et al. 2002). However, for short-term recordings, this technique has also been applied using the 0.003-0.1 Hz band (Lombardi, et al. 2000).
PSD was estimated using the Burg method (Burg 1975) with an optimized order for each signal, based on the Broersen’s combined information criterion (Broersen 2000), to obtain the autoregressive model parameters. Since we analyzed short segments of the RR series, the scaling exponent β was extracted from the frequency band 0.003-0.1 Hz (-2.5 to -1 on a logarithmic scale).
2.4. Statistical Analysis
Comparisons between symptomatic and asymptomatic patients during different phases of the test were evaluated by Mann-Whitney U non-parametric tests. The analysis was made using the commercially available statistical program SPSS 21.0 (IBM, Chicago, USA) and setting the level of significance at p < 0.05.
Binary logistic regression models were applied to variables that significantly differed between groups in order to predict the probability of experiencing symptoms, as a function of HRC measures.
3. Results
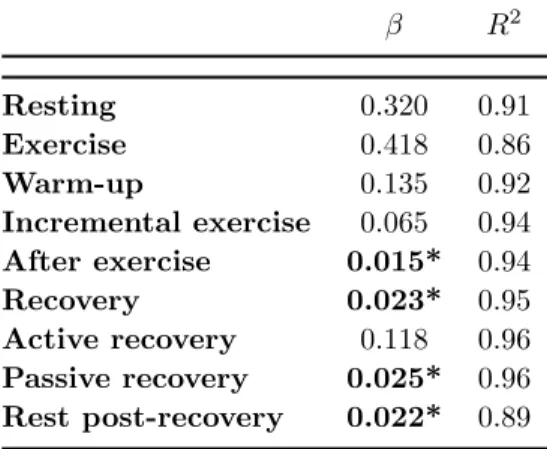
the different phases of the test between symptomatic and asymptomatic BS patients, as well as the R-squared (R2) as a fitting quality measure between the PSD and its fitted model associated with each phase. In general, linear models reached an acceptable goodness of fit, where R2 > 0.86. The lowest fitting qualities were found for exercise and after recovery phases, which were then analyzed in smaller segments with higher R2, always greater than 0.92.
Table 2. P-values and R2 obtained when comparing symptomatic and asymptomatic
patients along the test.
β R2 Resting 0.320 0.91 Exercise 0.418 0.86 Warm-up 0.135 0.92 Incremental exercise 0.065 0.94 After exercise 0.015* 0.94 Recovery 0.023* 0.95 Active recovery 0.118 0.96 Passive recovery 0.025* 0.96 Rest post-recovery 0.022* 0.89 *p < 0.05, Mann-Whitney U test.
Figure 2 displays an example of fit for a symptomatic and an asymptomatic patient after exertion, so as to represent the fitting quality, as well as the β slope decay experienced by the symptomatic case with respect to the asymptomatic patient.
Figure 2. Linear fit for β extraction after exercise in a symptomatic (left) and in an asymptomatic (right) BS patient.
Symptomatic patients showed a significant reduction in HRC, as estimated by the β slope, in comparison to asymptomatic subjects after exertion (p=0.015); during recovery (p=0.023), and more specifically during the passive recovery phase (p=0.025), and at rest post-recovery (p=0.022). Figure 3 reflects how symptomatic patients showed significantly decreased values in both recovery and post-recovery phases, with respect to asymptomatic subjects.
Figure 3. Group average results for β during resting, exercise, recovery and post-recovery phases; for symptomatic and asymptomatic BS patients (*p <0.05).
Table 3 collects the odds ratio (OR), 95% confidence intervals (CI) and p-values associated with each univariate model applied to variables that significantly differed between groups.
Table 3. Odds ratios, 95% confidence intervals and p-values associated with significant HRC indicators in univariate analysis.
Odds Ratio 95% CI p-value
β, recovery 0.180 0.028 - 1.146 0.069
β, passive recovery 0.230 0.029 - 1.812 0.163
β, rest post-recovery 0.097 0.012 - 0.803 0.030*
β, after exercise 0.189 0.036 - 0.992 0.049*
*p < 0.05, Mann-Whitney U test.
During the rest post-recovery phase, β turned to be an independent predictor in univariate analysis with a 9.7% (p=0.030) decreased risk per one point increase. After
exercise, β was also a significant predictor of symptoms, decreasing risk by a 18.9% per each point increase (p=0.049).
Finally, table 4 summarizes the mean ± standard deviation values for symptomatic and asymptomatic patients and summarizes p-values obtained in each significant case, showing higher values of HRC for asymptomatic BS patients.
Table 4. Mean ± standard deviation, for symptomatic and asymptomatic patients, and associated p-values of significant variables.
Symptomatic (n=16) Asymptomatic (n=53) p-value
β, recovery -1.866 ± 0.258 -1.685 ± 0.356 0.023
β, passive recovery -1.773 ± 0.292 -1.655 ± 0.288 0.025
β, rest post-recovery -1.853 ± 0.207 -1.651 ± 0.334 0.022
β, after exercise -1.706 ± 0.335 -1.468 ± 0.423 0.015
4. Discussion
In this study, non-linear HRV indicators were compared in 69 BS subjects who took part in a standardized physical stress test, in order to discriminate between symptomatic and asymptomatic patients. Although previous works have already analyzed the autonomic response of BS patients, this study presents, to our knowledge, the first evaluation of HR dynamics captured by short-term power-law scaling analysis, under conditions of physical activity and recovery.
This HRV marker has been employed to assess HRC in other cardiac disorders, such as chronic heart failure or transient myocardial ischemia, demonstrating decreased values of complexity in worse cardiac health conditions (Huikuri et al. 2000, Huikuri et al. 1998, Lombardi et al. 2001, Gomis et al. 2006, Maestri et al. 2007, Tapanainen et al. 2002).
The results obtained show a significant reduction in β after exertion, during recovery and rest post-recovery in symptomatic patients, with respect to asymptomatic patients. Therefore, subjects with higher risk showed lower complexity in HR dynamics, as already published for other cardiac pathologies.
Those statistically significant variables were then included in univariate logistic regression models in order to estimate their discrimination power. After recovery, β turned to be an independent predictor of symptomatology, supporting the idea that decreased complexity could be related to a greater risk in Brugada syndrome. After exercise, β was also a significant predictor, relating a decreased power-law scaling exponent to a worse prognosis.
It should be noted that although other indicators described in the literature assessing HRV non-linear properties were analyzed, differences between symptomatic and asymptomatic BS patients were not as significant as those captured by the β slope.
Despite DFA, the Hurst exponent, Sample Entropy and Higuchi’s Fractal Dimension capture similar HRV properties (Acharya, et al. 2006, Baumert, et al. 2007), in our clinical series, only the β slope demonstrated a potential impact on the prediction of risk in BS patients.
The autonomic nervous system is governed by complex interactions resulting from feedback loops of non-linear systems, that enable the organism to adapt to abnormal physiological conditions, such as metabolic variations, stress or disease. According to previous works, a reduction in the complexity of physiological control systems occurs with age and disease (Goldberger, et al. 2002, Rabinovich & Abarbanel 1998, Magrans, et al. 2010). Fractal power-law index β decreased significantly in symptomatic patients after exertion and recovery, when parasympathetic activity is predominant. Indeed, (Makimoto et al. 2010) analyzed the parasympathetic reactivation in BS patients by computing heart rate recovery (HRR) as the heart rate decay in the first minute after peak exercise cessation, concluding that a higher parasympathetic activity was related to the occurrence of cardiac events in BS. Thus, recovery stages seem to unmask significant autonomic differences related to symptomatology, also captured by the non-linear HRV indicators here presented.
The results found in our work indicate a loss of cardiac rhythm complexity after exertion and recovery in symptomatic BS patients. This may be explained by the fact that a decreased organism’s adaptability leads to a reduced complexity of the underlying biological control systems (Smith, et al. 2005). Moreover, this altered autonomic cardiac system dynamics when vagal tone is predominant confirms previous works that highlight the relevant role of autonomic imbalance in the genesis of life-threatening cardiac arrhythmias in BS (Matsuo et al. 1999, Kies et al. 2004). Indeed, polymorphic ventricular arrhythmias (PVA) and sudden cardiac death (SCD) mainly occur at rest and especially during sleep, when parasympathetic activity is predominant.
Data on cardiac ANS analyzed by positron emission tomography has confirmed that BS patients display some autonomic dysfunction, with increased presynaptic norepinephrine (NE) recycling and thus a reduction in the concentration of NE at the synaptic cleft. This imbalance is thought to promote arrhythmogenicity by decreasing intracellular levels of 3-5-cyclic adenosine monophosphate (cAMP) and thus disrupting the subsequent signaling pathway with potential implication for arrhythmogenesis (Wichter et al. 2002, Kies et al. 2004). This may lead to an enlarged transmural electrical dispersion that results in an increased probability of ventricular arrhythmias. In addition, the autonomic imbalance might be aggravated with the presence of physiological downregulation of adrenergic activity, justifying the occurrence of PVA and SCD at rest or during sleep (Priori, et al. 2000, Yan & Antzelevitch 1999). Other studies based on the full stomach test demonstrated that vagal stimulation induced by a large meal not only increased distinctive Brugada-like ECG changes but also lead to prognostic tendencies, since patients with a positive full stomach test were more frequently related to life-threatening events than patients with a negative test result (Miyazaki, et al. 1996, Chalvidan, et al. 2000).
Thus, findings on the present study further support this hypothesis and provide additional evidence for the role of autonomic imbalance in the pathophysiology of the disease. Although we did not find significant differences between groups in metrics characterizing the parasympathetic component that directly relate the loss of complexity with an increase in vagal tone, this study highlights the importance of physical stress testing in order to unmask relevant autonomic changes that could not be captured at rest, before the test.
Therefore, measurement of HRV not only by conventional but also by new non-linear methods during physical stress testing could be a helpful tool for documenting neural regulation alteration related to symptoms, which can have a potential impact on the progress of risk stratification in BS patients.
However, a relevant limitation of the study is that the clinical value of the analyzed indicators can only be proved if a close relationship between HRV variations and ventricular arrhythmias is identified. Here, symptomatic patients had documented symptoms but since no cardiac events of ventricular origin were induced during the study; we cannot directly relate HRC alterations in symptomatic patients to a greater risk for suffering symptoms.
5. Conclusion
We compared non-linear HRV indicators in 69 BS patients who took part in a standardized physical stress test in order to distinguish between symptomatic and asymptomatic groups.
Statistically significant differences were found during and after recovery, showing lower HR dynamics’ complexity in symptomatic patients under conditions of recovery and rest after recovery.
Although this study is based on a relatively small population of 69 subjects and, thus, conclusions on symptomatic status predictions cannot be inferred, the identified differences between symptomatic and asymptomatic BS patients indicate relevant tendencies of clinical importance. Therefore, significant HRV results could be of potential help in risk stratification of asymptomatic patients for whom the decision to implant a cardioverter defibrillator is still contentious.
Acknowledgments
This work was supported by the French Ministry of Health (Programme Hospitalier de Recherche Clinique - PHRC Regional). MC thanks la Caixa Foundation (Spain) and DR acknowledges Lefoulon-Delalande Foundation (France) for financial support.
References
U. R. Acharya, K. P. Joseph, N. Kannathal, C. M. Lim & J. S. Suri (2006). ‘Heart rate variability: a review’. Medical and biological engineering and computing 44(12):1031–1051.
C. Antzelevitch, et al. (2005). ‘Brugada Syndrome: Report of the Second Consensus Conference: Endorsed by the Heart Rhythm Society and the European Heart Rhythm Association’. Circulation 111(5):659–670.
M. Baumert, N. Wessel, A. Schirdewan, A. Voss & D. Abbott (2007). ‘Scaling characteristics of heart rate time series before the onset of ventricular tachycardia’. Annals of biomedical engineering 35(2):201–207.
M. A. B. Bigi, A. Aslani & A. Aslani (2008). ‘Significance of cardiac autonomic neuropathy in risk stratification of Brugada syndrome’. Europace 10(7):821–824.
P. Broersen (2000). ‘Finite sample criteria for autoregressive order selection’. Signal Processing, IEEE Transactions on 48(12):3550–3558.
J. Brugada, R. Brugada & P. Brugada (1998). ‘Right Bundle-Branch Block and ST-Segment Elevation in Leads V1 Through V3 : A Marker for Sudden Death in Patients Without Demonstrable Structural Heart Disease’. Circulation 97(5):457–460.
P. Brugada & J. Brugada (1992). ‘Right bundle branch block, persistent {ST} segment elevation and sudden cardiac death: A distinct clinical and electrocardiographic syndrome: A multicenter report’. Journal of the American College of Cardiology 20(6):1391 – 1396.
J. P. Burg (1975). Maximum Entropy Spectral Analysis. Phd thesis, Stanford University, Stanford, CA 94305.
T. Chalvidan, J.-C. DEHARO, P. Dieuzaide, P. DEEAYE & P. Djiane (2000). ‘Near fatal electrical storm in a patient equipped with an implantable cardioverter defibrillator for Brugada syndrome’. Pacing and Clinical Electrophysiology 23(3):410–412.
J. Dumont, A. Hernandez & G. Carrault (2010). ‘Improving ECG Beats Delineation With an Evolutionary Optimization Process’. Biomedical Engineering, IEEE Transactions on 57(3):607– 615.
S. M. Fox & W. L. Haskell (1968). ‘Physical activity and the prevention of coronary heart disease.’. Bulletin of the New York Academy of Medicine 44(8):950–965.
R. J. Gibbons, et al. (2002). ‘ACC/AHA 2002 guideline update for exercise testing: summary articleA report of the American college of cardiology/American heart association task force on practice guidelines (committee to update the 1997 exercise testing guidelines) 12345’. Journal of the American College of Cardiology 40(8):1531–1540.
A. L. Goldberger, C.-K. Peng & L. A. Lipsitz (2002). ‘What is physiologic complexity and how does it change with aging and disease?’. Neurobiology of aging 23(1):23–26.
P. Gomis, P. Caminal, M. Vallverd´u, S. Warren & G. Wagner (2006). ‘Non-linear dynamic analysis of the cardiac rhythm during transient myocardial ischemia’. Biomedizinische Technik 51(4):178– 181.
J.-S. Hermida, A. Leenhardt, B. Cauchemez, I. Denjoy, G. Jarry, F. Mizon, P. Milliez, J.-L. Rey, P. Beaufils & P. Coumel (2003). ‘Decreased nocturnal standard deviation of averaged NN intervals’. European heart journal 24(22):2061–2069.
H. V. Huikuri, T. H. M¨akikallio, K. J. Airaksinen, T. Sepp¨anen, P. Puukka, I. J. R¨aih¨a & L. B. Sourander (1998). ‘Power-law relationship of heart rate variability as a predictor of mortality in the elderly’. Circulation 97(20):2031–2036.
H. V. Huikuri, T. H. M¨akikallio, C.-K. Peng, A. L. Goldberger, U. Hintze, M. Møller et al. (2000). ‘Fractal correlation properties of RR interval dynamics and mortality in patients with depressed left ventricular function after an acute myocardial infarction’. Circulation 101(1):47–53.
K. Imai, H. Sato, M. Hori, H. Kusuoka, H. Ozaki, H. Yokoyama, H. Takeda, M. Inoue & T. Kamada (1994). ‘Vagally mediated heart rate recovery after exercise is accelerated in athletes but blunted in patients with chronic heart failure’. Journal of the American College of Cardiology 24(6):1529– 1535.
P. Kies, et al. (2004). ‘Abnormal Myocardial Presynaptic Norepinephrine Recycling in Patients With Brugada Syndrome’. Circulation 110(19):3017–3022.
Syndrome: A Pilot Study’. Journal of Cardiovascular Electrophysiology 21(7):773–780.
R. Krittayaphong, G. Veerakul, K. Nademanee & C. a. Kangkagate (2003). ‘Heart rate variability in patients with Brugada syndrome in Thailand’. European Heart Journal 24(19):1771–1778. F. Lombardi, T. H. M¨akikallio, R. J. Myerburg & H. V. Huikuri (2001). ‘Sudden cardiac death: role
of heart rate variability to identify patients at risk’. Cardiovascular research 50(2):210–217. F. Lombardi, A. Porta, M. Marzegalli, S. Favale, M. Santini, A. Vincenti, A. De Rosa et al. (2000).
‘Heart rate variability patterns before ventricular tachycardia onset in patients with an implantable cardioverter defibrillator’. The American journal of cardiology 86(9):959–963.
R. Maestri, et al. (2007). ‘Nonlinear indices of heart rate variability in chronic heart failure patients: redundancy and comparative clinical value’. Journal of cardiovascular electrophysiology 18(4):425– 433.
R. Magrans, P. Gomis, P. Caminal & G. Wagner (2010). ‘Multifractal and nonlinear assessment of autonomous nervous system response during transient myocardial ischaemia’. Physiological measurement 31(4):565–580.
H. Makimoto, et al. (2010). ‘Augmented ST-Segment Elevation During Recovery From Exercise Predicts Cardiac Events in Patients With Brugada Syndrome’. Journal of the American College of Cardiology 56(19):1576–1584.
K. Matsuo, T. Kurita, M. Inagaki, M. Kakishita, N. Aihara, W. Shimizu, A. Taguchi, K. Suyama, S. Kamakura & K. a. Shimomura (1999). ‘The circadian pattern of the development of ventricular fibrillation in patients with Brugada syndrome’. European Heart Journal 20(6):465–470.
T. Miyazaki, H. Mitamura, S. Miyoshi, K. Soejima, Y. Aizawa & S. Ogawa (1996). ‘Autonomic and antiarrhythmic drug modulation of ST segment elevation in patients with Brugada syndrome’. Journal of the American College of Cardiology 27(5):1061–1070.
K. Nakazawa, T. Sakurai, A. Takagi, R. Kishi, K. Osada, T. Nanke, F. Miyake, N. Matsumoto & S. Kobayashi (2003). ‘Autonomic imbalance as a property of symptomatic Brugada syndrome’. Circulation journal : official journal of the Japanese Circulation Society 67(6):511—514.
M. Paul, M. Meyborg, P. Boknik, U. Gergs, W. Schmitz, G. Breithardt, T. Wichter & N. Joachim (2011). ‘Autonomic Dysfunction in Patients with Brugada Syndrome: Further Biochemical Evidence of Altered Signaling Pathways’. Pacing and Clinical Electrophysiology 34(9):1147–1153. B. Pierre, D. Babuty, P. Poret, C. Giraudeau, O. Marie, P. Cosnay & L. Fauchier (2007). ‘Abnormal nocturnal heart rate variability and QT dynamics in patients with Brugada syndrome’. Pacing and clinical electrophysiology 30(s1):S188–S191.
S. G. Priori, et al. (2000). ‘Clinical and genetic heterogeneity of right bundle branch block and ST-Segment elevation syndrome A prospective evaluation of 52 families’. Circulation 102(20):2509– 2515.
V. Probst, et al. (2010). ‘Long-term prognosis of patients diagnosed with Brugada syndrome results from the FINGER Brugada Syndrome Registry’. Circulation 121(5):635–643.
M. Rabinovich & H. Abarbanel (1998). ‘The role of chaos in neural systems’. Neuroscience 87(1):5–14. W. M. Savin, D. M. Davidson & W. L. a. Haskell (1982). ‘Autonomic contribution to heart rate
recovery from exercise in humans’. Journal of Applied Physiology 53(6):1572–1575.
R. G. Smith, L. Betancourt & Y. Sun (2005). ‘Molecular endocrinology and physiology of the aging central nervous system’. Endocrine reviews 26(2):203–250.
J. M. Tapanainen, P. E. B. Thomsen, L. Køber, C. Torp-Pedersen, T. H. M¨akikallio, A.-M. Still, K. S. Lindgren & H. V. Huikuri (2002). ‘Fractal analysis of heart rate variability and mortality after an acute myocardial infarction’. The American journal of cardiology 90(4):347–352.
T. Tokuyama, et al. (2014). ‘Deterioration of the circadian variation of heart rate variability in Brugada syndrome may contribute to the pathogenesis of ventricular fibrillation’. Journal of cardiology 64(2):133–138.
T. Wichter, et al. (2002). ‘Cardiac Autonomic Dysfunction in Brugada Syndrome’. Circulation 105(6):702–706.