HAL Id: hal-01651673
https://hal.archives-ouvertes.fr/hal-01651673
Submitted on 14 Apr 2021
HAL is a multi-disciplinary open access
archive for the deposit and dissemination of
sci-entific research documents, whether they are
pub-lished or not. The documents may come from
teaching and research institutions in France or
abroad, or from public or private research centers.
L’archive ouverte pluridisciplinaire HAL, est
destinée au dépôt et à la diffusion de documents
scientifiques de niveau recherche, publiés ou non,
émanant des établissements d’enseignement et de
recherche français ou étrangers, des laboratoires
publics ou privés.
controlling mechanisms along a trophic gradient in a
barrier reef system
M. G. Weinbauer, M. E. Kerros, C. Motegi, I. C. Wilhartitz, F.
Rassoulzadegan, J. P. Torreton, Xavier Mari
To cite this version:
M. G. Weinbauer, M. E. Kerros, C. Motegi, I. C. Wilhartitz, F. Rassoulzadegan, et al.. Bacterial
community composition and potential controlling mechanisms along a trophic gradient in a barrier
reef system. Aquatic Microbial Ecology, Inter Research, 2010, 60 (1), pp.15-28. �10.3354/ame01411�.
�hal-01651673�
INTRODUCTION
Genetic fingerprinting (sometimes including sequen-cing) and cloning have been used to assess changes in bacterial community composition and potential control-ling mechanisms. Genetic fingerprints have been used to characterize gradients such as depth (Lee & Fuhrman
1991, Giovannoni et al. 1996, Acinas et al. 1999), salin-ity (Bouvier & del Giorgio 2002, Crump et al. 2004), or productivity (Reinthaler et al. 2005, Winter et al. 2005). Also, the dynamics of bacterioplankton diversity during phytoplankton blooms have been studied (Arrieta & Herndl 2002, Arrieta et al. 2004) and the results used to argue that there is seasonality in oceanic
bacterio-© Inter-Research 2010 · www.int-res.com *Email: [email protected]
Bacterial community composition and potential
controlling mechanisms along a trophic
gradient in a barrier reef system
Markus G. Weinbauer
1,
2,*, Marie-Emmanuelle Kerros
1, 2, Chiaki Motegi
1, 2,
Inés C. Wilhartitz
3, Fereidoun Rassoulzadegan
1, 2, Jean-Pascal Torréton
4, 5,
Xavier Mari
41Microbial Ecology & Biogeochemistry Group, Université Pierre et Marie Curie-Paris 6, Laboratoire d’Océanographie de Villefranche, 06230 Villefranche-sur-Mer, France 2CNRS, Laboratoire d’Océanographie de Villefranche, 06230 Villefranche-sur-Mer, France 3EAWAG: Swiss Federal Institute of Aquatic Science and Technology, Überlandstrasse 133, PO Box 611,
8600 Dübendorf, Switzerland
4IRD, Noumea Center, BP A5, 98848 Noumea, New Caledonia
5Present address: ECOLAG, UMR 5119, Université Montpellier II, Case 093, 34095 Montpellier, France
ABSTRACT: Bacterial abundance and community composition were investigated along trophic gra-dients in the barrier reef lagoon of Noumea, New Caledonia. Bacterial abundance and the percent-age of high nucleic acid (%HNA) bacteria (a potential indicator for bacterial production) increased from offshore waters towards the head of the bays. 16S rRNA gene PCR and denaturing gradient gel electrophoresis (DGGE) were used as genetic fingerprints for assessing differences in bacterial com-munity composition. Sequences of DGGE bands were assigned to (1) the genera Rugeria and Roseobacter (Rhodobacteriaceae), (2) the SAR11 cluster, (3) other Alphaproteobacteria, and (4) the
genus Alteromonas. Removal of the operationally defined attached bacteria by prefiltration did not
affect community profiles in offshore waters but had a strong influence in the bays, probably due to the much higher particle load and thus, attached bacteria in the bays. For the free-living community, the number of bands decreased linearly with increasing water residence time, chlorophyll a
concen-tration, and viral abundance. Specific bands were found for offshore waters and the 2 investigated semi-enclosed bays, whereas the lagoon showed no specific bands. A similarity analysis showed spe-cific clusters for offshore water, the lagoon, and the bays. A principle component analysis together with cluster and correlation analysis indicated that water residence time, viruses, and a complex top-down cascading effect of ciliate grazers on flagellates influenced community composition. Also, data from fingerprints of the total and free-living communities suggest that the free-living and the attached community are controlled by different mechanisms.
KEY WORDS: Diversity · Virus · Protist · Flagellate · Ciliate · Roseobacter · SAR11
Resale or republication not permitted without written consent of the publisher
O
PEN
PEN
A
CCESS
CCESS
plankton composition (Pinhassi & Hagström 2000, Fuhrman et al. 2006). Although the number of studies on bacterial diversity has increased in recent years, many environments remain poorly investigated, includ-ing the water column systems of tropical coral reefs (Dinsdale et al. 2008).
A variety of mechanisms influence bacterial commu-nity composition, including UV radiation (Winter et al. 2001), turbulence (Malits & Weinbauer 2009), nutrient and dissolved organic matter composition (Arrieta & Herndl 2002), grazing (Pernthaler 2005, Pernthaler & Amann 2005), and viral infection (Hewson et al. 2003, Winter et al. 2004). Also, general ecological patterns such as the species-area relationship (Horner-Devine et al. 2004b), the increase of diversity with system (‘island’) size (Bell et al. 2005, Reche et al. 2005), or the existence of latitudinal gradients (Fuhrman et al. 2008) appear to apply to bacteria. While one can expect that such influences and patterns are also operational in coral reef systems, no studies are available. In coral reef systems, the release of nutrients and mucus by corals stimulates the production of bacteria in nearby waters (Herndl & Velimirov 1986, Schiller & Herndl 1989) and fuels the food web of lagoon systems (Wild et al. 2004). This likely explains observations that the microbial loop is predominant and the community is often heterotrophic in the water column part of reef systems (Ferrier-Pagès & Gattuso 1998). Typically, lagoon bacteria are more active than bacteria in the open ocean, and usually only a moderate fraction of bacteria (ca. 10%) is attached to particles in the open ocean and reef lagoons (Rath et al. 1993, Torréton & Dufour 1996, Torréton 1999, Torréton et al. 2002). However, attached bacteria are often more active than their free-living counterparts (Simon et al. 2002, Grossart et al. 2007). It is also well documented that the diversity of prokaryotes attached to organic aggre-gates can be very different from free-living prokary-otes (DeLong et al. 1993, Acinas et al. 1999), although this has not been investigated yet in coral reef systems. Water residence time is an important concept to understand the hydrodynamically restricted aquatic systems and its control of ecological processes in the plankton. Water residence time is thought to be the most important physical control factor of ecological processes in estuaries (Jouon et al. 2006). In atoll and lagoon systems, it has been shown that chlorophyll a
(chl a) concentrations, primary production, and
bacter-ial production increase with water residence time (Delesalle & Sournia 1992, Charpy et al. 1997, Torréton et al. 2007). Water residence time also influences the dynamics of dissolved organic carbon and transparent exopolymeric particles (TEP; Mari et al. 2007b). Water residence time also determines whether a specific bac-terial community can develop; thus, for the
develop-ment of a specific bacterial community, the water resi-dence time must exceed that of bacterial growth. Indeed, a study in an estuary showed that specific communities developed with high bacterial production and long water residence time (Crump et al. 2004).
A recent study of organic matter reactivity along eutrophic gradients in the lagoon of New Caledonia revealed that the transfer efficiency of organic matter from the dissolved to the particulate phase via aggre-gation processes was reduced when the residence time of the water increased (Mari et al. 2007b). Such a reduction in organic matter reactivity may, in addition to water residence time itself, influence the distribu-tion and fate of attached and free-living prokaryotes. The lagoon of Noumea represents a steep, 20 km long gradient from the oligotrophic open ocean to meso-trophic semi-enclosed bays with a negligible freshwa-ter input from freshwa-terrestrial runoff. Here we present data on the community composition of bacterioplankton in the water column of various lagoon habitats by using genetic fingerprints and relate these diversity patterns to potential controlling factors such as water residence time and mortality factors.
MATERIALS AND METHODS
Study site and sampling. The SW lagoon of New Caledonia is an enclosed, relatively shallow site (aver-age depth: 20 m), surrounded by oligotrophic oceanic water. In contrast to the oligotrophy observed near the coral barrier, the near-shore environment is subject to terrestrial and, especially in the bays around the city of Noumea, to both industrial and urban inputs that increase the general productivity in these areas. Eutrophication in Grande Rade Bay is mainly of indus-trial origin, due to the close proximity of a large nickel smelter, while in Sainte Marie Bay, eutrophication is mostly of urban origin, i.e. due to wastewater outfalls from the Sainte Marie area. For more details see Mari et al. (2007b).
Seawater samples were collected during November and December 2004 at 10 stations distributed along 2 transects in the SW lagoon of New Caledonia, going from 2 semi-enclosed bays in the city of Noumea (~130 000 inhabitants) to a station outside the reef bar-rier (Fig. 1). Both transects were sampled twice, on 22 and 24 November 2004 (from Grande Rade Bay to the outer edge of the coral reef) and 29 November and 1 December 2004 (from Sainte-Marie Bay to the outer edge of the coral reef). Samples were obtained from 5 m depth using a Teflon pump. CTD casts were used on each sampling occasion to determine the vertical distribution of physical parameters. All stations were sampled within 1 h; water samples were stored in
acid-cleaned polycarbonate bottles and brought back to the laboratory within 1 to 2 h after sampling.
Residence time of the water masses.The parameter used to depict the ‘residence time’ of the water mass is the Local e-Flushing Time (LeFT; in days). The LeFT is defined as the time required for a tracer mass con-tained within the control volume (station) to be reduced by a factor 1/e by waters coming from outside the lagoon and, thus, it describes the replacement efficiency of water masses in the study area (Jouon et al. 2006): the shorter the LeFT, the faster the water masses at the loca-tion will definitely be replaced and, thus, renewed. The
annual average LeFT at the different stations was calcu-lated from a hydrodynamic model taking into account topographic constraints, average wind condition, and tidal cycle (Jouon et al. 2006). During the sampling pe-riod, wind conditions were similar to those used as input parameters in the hydrodynamic model (i.e. well estab-lished trade winds of about 8 to 10 m s–1). The LeFT was
0 at the offshore station (input parameter) and it was cal-culated for each station to range from 0.4 to 5.6 d in the lagoon stations, 12 to 17 d in Sainte Marie Bay, and 31 to 47 d in Grande Rade Bay (Mari et al. 2007b; Table 1).
Enumeration of microbes. Water samples were preserved with glutaraldehyde (0.5% final concentra-tion) for 30 min at 4°C, then flash frozen in liquid nitrogen and stored at –80°C until analysis. Viruses and bacteria were stained with SYBRGreen I and counted by flow cytometry using the protocol of Gasol & del Giorgio (2000) for bacteria and Brussaard (2004) for viruses. Synechococcus, Prochlorococcus, and
auto-trophic picoeukaryotes were counted as described by Jacquet et al. (2006). Samples for viruses were diluted 100-fold in TE (10 mM Tris, 1 mM EDTA, pH 8.0) buffer. Based on fluorescence intensity (and side scat-ter) 2 bacterial populations were distinguished: low (LNA) and high nucleic acid (HNA) bacteria.
Flagellate and ciliates were stained with DAPI, col-lected onto 0.8 µm pore-size Nuclepore filters, and counted using an epifluorescence microscope. It should be noted that ciliate counts obtained by this method can be underestimates. Heterotrophic (HNF) and autotrophic nanoflagellates (ANF) were distin-guished based on autofluorescence. Total flagellate (TNF) abundance is the sum of HNF and ANF. Chl a
was determined fluorometrically from duplicate 200 ml subsamples filtered onto 25 mm Whatman GF/F filters, and data were obtained from Mari et al. (2007b).
Fig. 1. Study area showing sampling stations. Stns D and N are in Grande Rade Bay and Sainte Marie Bay, respectively,
whereas Stns M are in the lagoon proper and offshore
Trophic group Stn LeFT Chl a No. of bands No. of bands Bacteria % HNA (d) (µmol l–1) TC FLC (106ml–1) bacteria Head of bays D01 46.9 1.64 (1.50–1.82) 14.5 (14–15) 12 1.27 (1.20–1.34) 80 (79–82) N04 17.1 1.72 (0.97–2.46) 16.0 (16) ND 1.70 (1.44–1.97) 69 (62–75) Middle of bays D08 40.8 0.88 (0.85–0.92) 13.5 (13–14) 13 1.08 (1.03–1.14) 77 (73–81) N12 12.9 1.12 (0.89–1.36) 16.0 (16) ND 1.42 (1.32–1.52) 67 (66–69) Mouth of bays D22 31.0 0.47 (0.43–0.52) 12.5 (12–13) 13 1.13 (1.11–1.16) 62 (62) N33 12.4 0.38 (0.35–0.41) 11.5 (11–12) ND 1.10 (1.07–1.14) 60 (59–62) Middle of lagoon M05 5.6 0.31 (0.28–0.34) 12.0 (12) 13 1.04 (1.03–1.06) 51 (51) M33 0.5 0.30 (0.31–0.31) 11.5 (11–12) ND 1.26 (1.10–1.34) 57 (57–58) Near barrier M10 0.4 0.31 (0.25–0.36) 12.8 (12–13) 14 0.99 (0.82–1.22) 60 (52–64) Open ocean M41 0 0.19 (0.10–0.31) 15.3 (14–16) 15 0.67 (0.61–0.73) 54 (51–60) Table 1. Bacterial and environmental characteristics of the sampling stations. Local e-flushing time (LeFT) and chlorophyll a
(chla) data are from Mari et al. (2007b) and are presented to characterize the trophic gradient. Each value corresponds to the
average (range in parentheses) of 2 or 4 measurements (except free-living communities, FLC). The numbers of denaturing gradient gel electrophoresis (DGGE) bands are for total bacterial communities (TC) and FLC. HNA: high nucleic acid bacteria;
DNA extraction. Cells from 0.5 to 1 l samples (total community) were recovered on a 0.2 µm pore-size poly-carbonate filter (diameter 47 mm; Whatman). A replicate sample (except for the Sainte-Marie Bay transects) was prefiltered through 1 µm polycarbonate filter (diameter 47 mm; Whatman) to remove mainly attached bacteria, and the filtrate containing mainly the free-living commu-nity was collected. Nucleic acids were extracted from the filters and purified as described elsewhere (Winter et al. 2004). Briefly, after 4 freeze-thaw cycles (–196°C to + 37°C), an enzyme treatment was performed with lysozyme (1.25 mg ml–1final concentration; Fluka
Bio-Chemika) for 30 min at 37°C followed by a digestion with Proteinase K (100 µg ml–1final concentration; Fluka
Bio-Chemika) and 1% sodium dodecyl sulfate for 2 h at 55°C. In contrast to the phenol-chloroform extraction step from the original protocol, nucleic acids were ex-tracted with 4.5 M NaCl2, followed by 100% isopropanol
precipitation. This modified procedure avoids the use of a toxic chemical and yields genetic fingerprints identical to those obtained by the original method (Malits & Wein-bauer 2009). The pellets were re-suspended in 60 µl of 0.5× TE buffer (10 mM Tris, 1 mM EDTA [HCl, pH 8.0]).
PCR. Conditions of the touchdown PCR and chemi-cals were as described by Schäfer & Muyzer (2001). One to 4 µl of cleaned nucleic acid extract were used as template in a 50 µl PCR reaction (1.5 mM MgCl2,
0.25 µM of each primer, and 2.5U Taq polymerase;
Sigma) together with a positive and a negative control. A fragment of the 16S rRNA gene was amplified using the primer pairs 341F-GC/ 907R and 344F-GC/ 915R for Bacteria and Archaea, respectively (Schäfer &
Muyzer 2001). The bacterial primers had the modifica-tions suggested to also detect Gammaproteobacteria
(Sanchez et al. 2007). Archaeal PCR products could either not be obtained or were often too weak to per-form denaturing gradient gel electrophoresis (DGGE). Therefore, we conclude that Archaea were not
abun-dant at the study site and we use the term ‘bacteria’ in the following.
DGGE. DGGE procedures followed those described by Schäfer & Muyzer (2001). PCR products (500 ng) were separated into bands by electrophoresis for 18 h at 100 V on acrylamide/bis-acrylamide (6%) gels pre-pared using a gradient of 30 to 70% (urea and for-mamide) using an INGENYphorU DNA Mutation Detection System (Ingeny International). A standard made from a 200 l bacterioplankton extraction was loaded to allow for comparison of bands within and between gels. DGGE gels were photographed with a gel documentation system (GelDoc EQ; Bio-Rad) after 15 min of staining with a 10× SYBR Gold solution (Mol-ecular Probes). Analysis of band patterns between lanes was performed with the Quantity One Software (Bio-Rad) using a variety of exposure times.
Selected samples covering all detected bands were rerun on a DGGE gel, and bands were excised. The DNA was eluted overnight in autoclaved Milli Q water at 4°C, checked for purity by re-running it on a gel, and sequenced (MWG-Biotech). Sequences were edited using the freeware program 4Peaks 1.6 (www. mekentosj.com). Up to approximately 500 bp of the 16S rRNA gene were used in a BLAST search.
Statistical analyses. Correlation and regression analyses were performed using a probability (p) < 0.05 as significant. Data were log or arcsine transformed (for percentages) to meet statistical requirements. Bacterial fingerprints were analyzed using a Simple Match simi-larity index. The difference in the number of bands was compared between offshore, lagoon, and bay waters us-ing an analysis of variance (ANOVA). Data comparison between the 2 bays was done by Student’s t-test.
Potential relationships among variables were tested by linear pairwise correlations (Spearman correlation analysis). Key parameters were used to perform princi-pal component analysis (PCA). Data were log(+1) transformed to satisfy the requirements of normality and homogeneity of variance necessary for parametric statistics. Only factors with an eigenvalue >1 were retained. All statistical analyses were performed with the JMP program.
RESULTS
Characterization of sampling sites
A physical and chemical characterization of the sam-pling stations at the samsam-pling dates can be found in Mari et al. (2007b). Briefly, salinity and temperature varied only slightly between sampling sites and dates, and no stratification of the water column was observed within the barrier reef. Nutrient concentrations were highest at the head of the bays and gradually de-creased towards the mouth of the bays, the distant parts of the lagoon, and the open ocean. All sampling stations during the sampling period were character-ized by inorganic nitrogen limitation as indicated by N:P ratios < 5 (Mari et al. 2007b).
Microbial abundance
Bacterial abundance ranged from 0.6 × 10⁶to 2.0 ×
106ml–1, and in all 4 transects, bacterial abundance was
lowest at the open ocean station and highest at the head of the bays (Table 1). Bacterial abundance was generally higher in Sainte Marie Bay than in Grande Rade Bay. HNA ranged from 51 to 82% and increased from 54% in the open ocean to 80% at the head of Grande Rade Bay.
The abundance of Synechococcus ranged from 0.8 to
19.8 × 10⁴ml–1. The abundance was highest in Grande
Rade Bay, similar in the lagoon and Sainte Marie Bay, and much lower offshore (Table 2). Prochlorococcus
was not detectable in most bay stations and showed low abundances in the lagoon and very high abundances offshore (on average 1.5 × 10⁵ml–1). Thus,
Prochloro-coccus dominated the cyanobacterial community
off-shore, whereas Synechococcus dominated in the
la-goon and bays. Abundances of Cyanobacteria (i.e. Synechococcus plus Prochlorococcus) did not change
much between study sites. Picoeukaryotes ranged from 1.6 to 12.4 × 10³ ml–1 and generally showed higher
abundances in the bays than at other stations.
HNF abundance ranged from 0.6 to 13.4 × 10³ml–1.
HNF abundance was higher at the head of the bays than in the open ocean, although the lowest values were found at a station in the middle of the lagoon and in the middle and mouth of Sainte Marie Bay (Table 3).
With the exception of a single sampling, ANF dance was lower than HNF abundance. ANF abun-dance and its relative contribution to total abunabun-dance were lowest in the open ocean and highest in the bays. Ciliate abundance ranged from 0.1 to 19 cells ml–1, and abundance was on average lowest in the open ocean. The distribution of viral abundance in the lagoon of Noumea has been described elsewhere (Mari et al. 2007a). Briefly, viral abundance ranged from 0.8 to 3.2× 10⁷ml–1and was highest at the head of the bays
and lowest in the open ocean.
Bacterial community composition
Fourteen different bands were successfully sequenced (Table 4). The identity of bands could be confirmed by identical sequences. Five major groups of phylotypes were detected: (1) sequences related to
Rhodobacteri-Trophic group Stn HNF ANF TNF Ciliates Viruses (103ml–1) (102ml–1) (103ml–1) (ml–1) (107ml–1) Head of bays D01 3.0 (2.7–3.2) 7.8 (2.4–13.2) 3.8 (3.4–4.1) 2.1 (2.0–2.2) 2.8 (2.8–2.9) N04 5.5 (4.7–6.3) 6.8 (2.5–11.0) 6.2 (5.8–6.6) 3.1 (1.0–5.1) 2.7 (2.2–3.2) Middle of bays D08 1.5 (0.6–2.3) 3.5 (0.5–6.5) 1.8 (1.3–2.4) 0.9 (0.9–1.0) 2.9 (2.8–3.0) N12 8.5 (3.7–13.4) 4.0 (1.8–6.3) 8.9 (4.3–13.5) 9.6 (0.5–18.6) 2.6 (2.3–2.9) Mouth of bays D22 1.6 (1.5–1.6) 3.5 (2.2–4.8) 1.9 (1.8–2.0) 1.2 (0.4–1.9) 2.5 (2.4–2.7) N33 2.7 (1.5–4.0) 16.3 (2.2–30.5) 4.4 (4.2–4.6) 0.9 (0.6–1.1) 2.4 (2.3–2.6) Middle of lagoon M05 1.4 (0.8–1.9) 1.6 (1.1–2.1) 1.5 (0.9–2.1) 2.3 (0.1–4.5) 2.0 (1.7–2.2) M33 2.8 (2.0–3.6) 1.7 (1.2–2.3) 3.0 (2.1–3.9) 1.7 (1.1–2.3) 2.6 (2.4–2.8) Near barrier M10 2.1 (1.4–4.0) 1.4 (0.7–3.1) 2.3 (1.6–4.1) 1.7 (1.2–2.4) 2.0 (1.4–2.6) Open ocean M41 2.5 (1.4–3.5) 1.4 (0.4–2.5) 2.6 (1.4–4.1) 0.6 (0.3–0.8) 1.2 (0.8–1.7) Table 3. Protistan and viral characteristics at the sampling stations. Virus data are from Mari et al. (2007a). Each value corre-sponds to the average (range in parentheses) of 2 or 4 measurements taken for each station. HNF: heterotrophic nanoflagellates;
ANF: autotrophic nanoflagellates; TNF: total nanoflagellates
Trophic group Stn Synechococcus Prochlorococcus Cyanobacteria Picoeukaryotes (104ml–1) (103ml–1) (104ml–1) (103ml–1) Head of bays D01 16.8 (16.0–17.7) 3.7 (ND–7.3) 17.1 (16.7–17.8) 6.3 (5.6–7.1) N04 12.4 (11.2–12.8) ND 12.0 (11.2–12.8) 10.7 (10.1–11.4) Middle of bays D08 19.1 (18.5–19.8) ND 19.1 (18.5–19.8) 5.3 (5.1_5.5) N12 12.9 (12.2–13.6) ND 12.9 (12.2–13.6) 11.6 (10.7–12.4) Mouth of bays D22 18.3 (17.4–19.5) 0.7 (ND–1.3) 18.6 (17.5–19.5) 3.9 (3.7–4.0) N33 10.5 (10.2–10.8) ND 10.5 (10.2–10.8) 5.4 (5.0–5.9) Middle of lagoon M05 12.5 (11.1–13.9) 10.1 (5.5–14.6) 13.5 (11.2–15.4) 3.2 (2.3–4.4) M33 13.2 (12.5–14.0) 6.1 (5.0–7.2) 13.9 (13.3–14.5) 3.3 (2.4–4.2) Near barrier M10 12.2 (8.2–15.2) 20.7 (9.2–41.4) 13.6 (9.5–17.1) 4.8 (2.0–8.1) Open ocean M41 2.2 (0.8–2.8) 145.7 (130.7–167.7) 16.8 (15.0–19.4) 3.4 (1.6–4.3) Table 2. Characteristics of Cyanobacteria and autotrophic picoeukaryotes at the sampling stations. Each value corresponds to the
average (range in parentheses) of 2 or 4 measurements taken for each station. ND: not detectable. Cyanobacteria is the sum
aceae (e.g. genera Rugeria and Roseobacter), (2)
se-quences related to the SAR11 cluster, (3) sese-quences re-lated to other Alphaproteobacteria, (4) sequences related
to Alteromonadaceae (genus Alteromonas), and (5) a
se-quence related to cyanobacterial sese-quences. The band corresponding to cyanobacterial sequences was not in-cluded in the analysis of the community composition. It is noteworthy that no plastid sequences were detected.
Duplicate filters yielded identical community pro-files (data not shown). Bacterial community composi-tion changed strongly along trophic gradients. Twenty different bands were detected, and 13 bands were pre-sent at all stations. The number of detected bands ranged from 14 to 16 in offshore waters, from 11 to 13 in the lagoon and the mouth of the bays, and from 13 to 15 in Grande Rade Bay, and it was 16 in Sainte Marie Bay (middle and head of bays). Thus, the highest num-ber of bands of total bacterial communities was found in the upper part of the bays and at the open ocean sta-tion (Fig. 2). An ANOVA and post hoc tests showed that the number of bands of the total community in the lagoon was significantly different from bay and off-shore stations. The number of bands of the free-living community showed a different trend and decreased from the open ocean towards the head of the bays. An ANOVA showed that offshore, lagoon, and bay waters were significantly different with respect to the number of bands of the free-living community.
Using band identity to describe environments, 3 spe-cific bands were found for offshore waters, 1 band was specific for the middle and head station of Sainte Marie Bay, and 1 band was specific for Grande Rade Bay. An additional band occurred only in the 2 bays, whereas no specific band was detected for the lagoon stations.
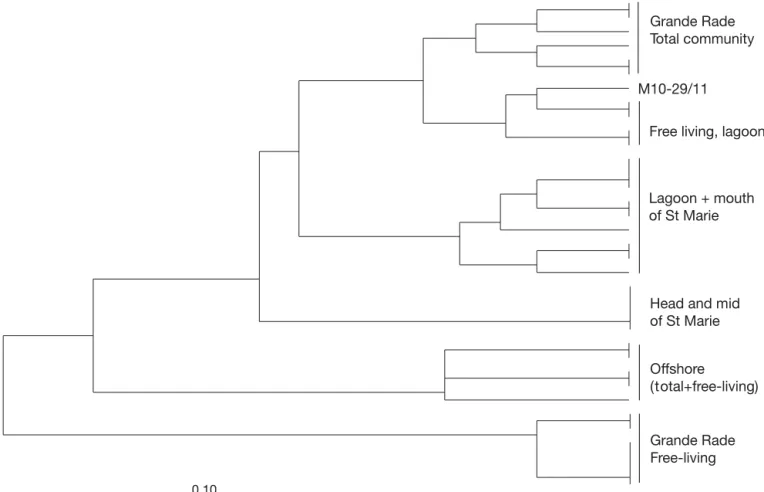
A similarity tree of the DGGE profiles (presence versus absence of bands) showed that the free-living commu-nity in Grande Rade was different from all others (Fig. 3). The offshore community was different from all other remaining lagoon and bay communities. Within the lagoon and bay communities, 3 clusters were found: 1 consisting of the head and center of Sainte Marie Bay, 1 of the mouth of Sainte Marie Bay and some lagoon stations (total community), and 1 of the
Band Closest match % Sequence similarity Taxonomic group (environmental or culture) (no. bases)
Noumea04-3 Roseobacter sp. MED001 98 (413) Alphaproteobacteria/Rhodobacteriaceae
Noumea04-4 Roseobacter sp. MED001 96 (369) Alphaproteobacteria/Rhodobacteriaceae
Noumea04-7 Clone VH-PA7-59 97 (457) Gammaproteobacteria/Alteromonadaceae
Noumea04-9 Clone 2_B6 or 2_C6 99 (433) Alphaproteobacteria/Rhodobacteriaceae
Noumea04-10 Clone SIMO-846 99 (420) Alphaproteobacteria/Rhodobacteriaceae
Noumea04-11 Clone 2_C6 98 (434) Alphaproteobacteria/Rhodobacteriaceae
Noumea04-12 Clone SIMO-846 98 (470) Alphaproteobacteria/Rhodobacteriaceae
Noumea04-13 Alphaproteobacterium IMCC10404 99 (279) Alphaproteobacteria
Noumea04-14 Alphaproteobacterium IMCC10417 97 (281) Alphaproteobacteria
Noumea04-16 Proteobacterium MS-B-38 or MS-F-42 96 (250) Proteobacteria
Noumea04-18 Clone VH-PA7-59 98 (445) Gammaproteobacteria/Alteromonadaceae
Noumea04-21 Marine eubacterial sp. (FL1) 93 (242) Alphaproteobacteria/SAR11
Noumea04-22 SAR11 cluster Alphaproteobacterium 86 (268) Alphaproteobacteria/SAR11
Noumea04-27 Prochlorococcus marinus Str. MIT 9215 98 (364) Cyanobacteria/Prochlorococcus
Table 4. Phylogenetic affiliation of sequences from denaturing gradient gel electrophoresis (DGGE) bands with closest uncul-tured and culuncul-tured matches. The number of bases used to calculate sequence similarity is given in parentheses in the third col-umn. Note that the last 2 sequences were from bands not included in the analysis of the community composition because they
were below the threshold set for the detection of a band
10 11 12 13 14 15 16 17 18
Open ocean Near barrier
Middle of lagoonMouth of baysMiddle
of bays Head of bays Total community
Free-living community
No. of DGGE bands
Fig. 2. Number of detected bands denaturing gradient gel electrophoresis (DGGE) of total and free-living communities in the southwest lagoon of New Caledonia as a function of en-vironment. For the free-living community, only data from
Grande Rade total communities and free-living com-munities from the lagoon. Specific clusters were found for communities from the middle and head of Sainte Marie Bay, from Grande Rade Bay, and from all lagoon stations (except Stn M10 sampled on 29 November) and the mouth of Sainte Marie Bay. Communities from the 2 bays were clearly different. Prefiltration did not affect the profiles at the open ocean station, whereas after prefiltration, i.e. when only the free-living com-munities were present, lagoon comcom-munities clustered together with non-prefiltered lagoon station communi-ties (Stn M10 sampled on 29 November), and Grande Rade Bay communities clustered apart from all other communities.
Relationship between parameters
Regression and correlation analyses were performed with average values per station, since LeFT values were only available as average values per station, and not all stations were sampled at the same frequency (Table 1). Bacterial abundance increased strongly with
chl a concentration and ciliate and viral abundance,
but not with LeFT, whereas %HNA increased signifi-cantly with LeFT, chl a concentration, and viral
abun-dance but not with ciliate abunabun-dance parameters (Table 5). Other significant relationships were those between LeFT and chl a, between viruses and chl a
(although r was lower than for the relationship be-tween viral and bacterial abundance), and bebe-tween HNF or TNF abundance and ciliate abundance. The abundance of Synechococcus was strongly related to
viruses, whereas the abundance of picoeukaryotes was strongly related to %HNA, HNF, and TNF.
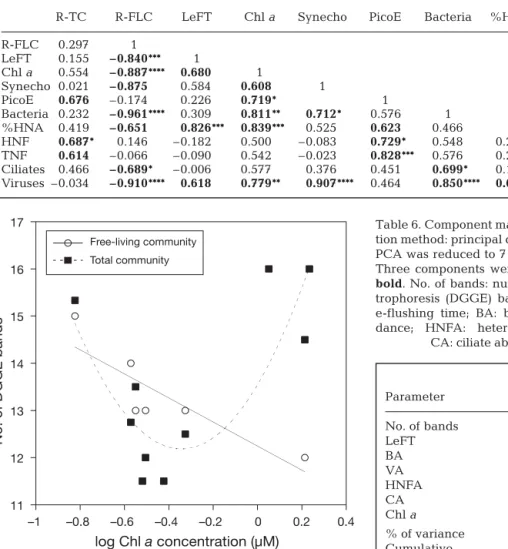
Using correlation analysis, the number of bands of total communities was only related significantly to HNF, TNF, and eukaryote abundance (Table 5). How-ever, we also found more complex relationships using regression analysis. For example, the number of bands was related to chl a concentration in a U-shape (Fig. 4).
No relationship was detected between the number of bands of total communities and LeFT. The number of bands of the free-living community decreased linearly with LeFT, chl a concentration (Fig. 4), Synechococcus,
%HNA, and bacterial, viral, and ciliate abundance.
0.10
M10-29/11
Free living, lagoon Grande Rade Total community
Lagoon + mouth of St Marie
Head and mid of St Marie
Offshore (total+free-living)
Grande Rade Free-living
Fig. 3. Cluster analysis of denaturing gradient gel electrophoresis (DGGE) band patterns by the unweighted pair-group method. The distance matrix was calculated using a simple match similarity index
Integrated view of data: PCA
Key parameters, namely richness, LeFT, bacteria, viral, HNF and ciliate abundance, and chl a
concen-trations were selected for PCA. Three significant com-ponents with an eigenvalue >1 were extracted, ex-plaining 86.2% of the total variation (Table 6). The component matrix revealed 2 fundamental factors influencing the environment. Most of the variations in the barrier reef system were characterized by the first component (PCA-C1), where LeFT was strongly corre-lated with bacterial and viral abundance and chl a and
was responsible for almost 50% of the variation in the system. The other 2 components, together explaining about 36% of the variation, revealed a relation between grazers and richness. The second component (PCA-C2) showed a positive correlation between the number of bands for the total community and HNF abundance, and the third component (PCA-C3) showed a negative correlation between the number of bands for the total community and ciliate abundance.
DISCUSSION
Potential control mechanisms of bacterial abundance
A lower bacterial abundance in the open ocean than in lagoon stations of coral reefs as shown in the present
R-TC R-FLC LeFT Chl a Synecho PicoE Bacteria %HNA HNF TNF Ciliates R-FLC 0.297 1 LeFT 0.155 –0.840*** 1 Chl a 0.554 –0.887**** 0.680 1 Synecho 0.021 –0.875 0.584 0.608 1 PicoE 0.676 –0.174 0.226 0.719* 1 Bacteria 0.232 –0.961**** 0.309 0.811** 0.712* 0.576 1 %HNA 0.419 –0.651 0.826*** 0.839*** 0.525 0.623 0.466 1 HNF 0.687* 0.146 –0.182 0.500 –0.083 0.729* 0.548 0.213 1 TNF 0.614 –0.066 –0.090 0.542 –0.023 0.828*** 0.576 0.273 0.975**** 1 Ciliates 0.466 –0.689* –0.006 0.577 0.376 0.451 0.699* 0.191 0.697* 0.621 1 Viruses –0.034 –0.910**** 0.618 0.779** 0.907**** 0.464 0.850**** 0.676 0.380 0.291 0.407 Table 5. Spearman correlation coefficients among all parameters. Data are from Table 1–3 and were log or arcsine transformed. Temperature is not shown, as no significant correlation was found. R-TC: number of bands, total community; R-FLC: number of bands, free-living community; LeFT: local e-flushing time; chl a: chlorophyll a; Synecho: Synechococcus; PicoE: picoeukaryotes;
HNA: high nucleic acid bacteria; HNF: heterotrophic nanoflagellates; TNF: total nanoflagellates. Values in bold are p < 0.05; *p < 0.01; **p < 0.005; ***p < 0.001; ****p < 0.0005 Lagoon of Noumea Parameter C1 C2 C3 No. of bands 0.09 0.56 0.67 LeFT 0.42 –0.27 0.24 BA 0.49 –0.05 –0.14 VA 0.47 –0.30 –0.10 HNFA 0.24 0.61 –0.18 CA 0.20 0.39 –0.61 Chl a 0.50 0.02 0.24 % of variance 49.8 21.3 15.0 Cumulative 86.2%
Table 6. Component matrix for the lagoon of Noumea. Extrac-tion method: principal component analysis (PCA). Data set for PCA was reduced to 7 key parameters (no. of samples = 24). Three components were extracted. Correlations > 0.4 are in
bold. No. of bands: number of denaturing gradient gel elec-trophoresis (DGGE) bands for total community; LeFT: local e-flushing time; BA: bacterial abundance; VA: viral abun-dance; HNFA: heterotrophic nanoflagellate abundance;
CA: ciliate abundance; chl a: chlorophyll a
11 12 13 14 15 16 17 –1 –0.8 –0.6 –0.4 –0.2 0 0.2 0.4 Free-living community Total community
No. of DGGE bands
log Chl a concentration (µM)
Fig. 4. Number of detected denaturing gradient gel elec-trophoresis (DGGE) bands of total and free-living communi-ties in the southwest lagoon of New Caledonia as function of chl a concentration. For the free-living community, only data
from Grande Rade Bay transects are available. Total commu-nity: y = 10.95x2+ 8.17x + 14.6, R2= 0.71, p < 0.001; free-living
study has been demonstrated previously (e.g. Torréton 1999). This difference was only moderate (Torréton 1999) and is supported by our study. The relationship be-tween bacterial abundance and chl a concentrations
(Table 5) suggests that bacterial production was linked to primary production as has been shown before for the barrier reef system of New Caledonia (Rochelle-Newall et al. 2008) and many other pelagic environments (e.g. Cole et al. 1988). Such a tight link is thought to be mainly the consequence of dissolved organic matter release from healthy phytoplankton cells (Baines & Pace 1991), which fuels bacterial production. Other links could be detritus formation and subsequent use by bacteria. In-deed, the concentration of transparent organic particles (TEP) was also well correlated with chl a (Mari et al.
2007b) and bacterial abundance (data not shown). It is known that %HNA often increases with bacterial pro-duction and that the HNA populations are often more ac-tive (e.g. Servais et al. 1999). We did not measure bacte-rial production in the present study, although previous work has shown that bacterial production increases along the trophic gradient in the lagoon in all seasons (Torréton et al. 2007, Conan et al. 2008, Rochelle-Newall et al. 2008). Thus, the strong correlation between %HNA (and total abundance) and chl a detected in the lagoon of
Noumea and the fact that these parameters strongly in-crease along trophic gradients is a good indication of a link between bacterial and primary production as shown previously along the trophic gradients investigated (Rochelle-Newall et al. 2008). In the bays, the long water residence time and the positive buoyancy of TEP result in an efficient cycling loop of organic matter (Mari et al. 2007b), and this could be an additional mechanism ex-plaining the high %HNA.
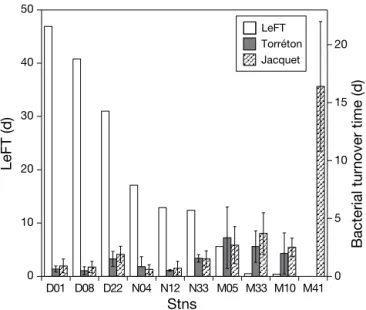
Our data support a previous report (Torréton et al. 2007) suggesting that water residence time has an in-fluence on bacterioplankton biomass. Recalculating 2 data sets from a total of 6 cruises from the same stations as in the present study (Jacquet 2005, Torréton et al. 2007), a negative relationship was found between LeFT and bacterial turnover time (data were used as log-transformed averages per station from 3 cruises; Torré-ton data set: r = –0.70, p < 0.01, n = 9; Jacquet data set: r = –0.74, p < 0.005, n = 10). In the bays, water residence time was much higher than bacterial turnover time (Fig. 5). At Stn M05 (lagoon station closest to coast), LeFT and turnover times were similar, whereas for the other lagoon stations, bacterial turnover times were much lower than LeFT. Water residence time is a cru-cial ecological parameter in semi-confined environ-ments, but it has not often been related to bacterial abundance and production or bacterial subpopulations (Crump et al. 2004). For example, it has been argued that specific communities can develop when the water residence time is higher than the bacterial turnover
time (Crump et al. 2004). PCA-C1 also suggests a posi-tive link between water residence time and bacterial and viral abundance and chl a concentrations (Table 6),
thus supporting the argument outlined here.
The abundances of bacteria and HNF often show a lack of coupling across trophic gradients, especially in more eutrophic environments (Gasol & Vaqué 1993, Gasol 1994). This is probably due to top-down control of HNF by larger protists such as ciliates. These find-ings have been used by Gasol and co-workers to develop a model predicting that grazing by flagellates controls bacterial production in oligotrophic but not in eutrophic environments (see also Pernthaler 2005). In support of these ideas, we did not find a significant relationship between bacterial and HNF or TNF abun-dance, whereas HNF and TNF abundance were highly correlated with ciliate abundance. This analysis could be influenced by mixotrophic flagellates, which are able to feed on bacteria and thus represent an addi-tional mortality factor for bacteria. However, total or autotrophic flagellate abundance was also not coupled to bacterial abundance. The lack of correlation be-tween HNF (or TNF) and bacterial abundance could also be due to flagellates grazing mainly on Cyanobac-teria as shown for an atoll lagoon (Sakka et al. 2000).
HNF (or TNF) abundance was not related significantly 0 10 20 30 40 50 0 5 10 15 20 D01 D08 D22 N04 N12 N33 M05 M33 M10 M41 LeFT Torréton Jacquet LeFT (d)
Bacterial turnover time (d)
Stns
Fig. 5. Local e-flushing time (LeFT) and bacterial turnover times at the sampling stations. Water residence times were calculated for the most common trade wind conditions of 8 m s–1(Mari et al. 2007a). Bacterial turnover times were
calcu-lated from 2 data sets available from the study stations (Jacquet 2005, Torréton et al. 2007). The Torréton data set was obtained from cruises in September 2000, June 2003, and October 2004, and the Jacquet data set was from April–May 2002, August 2002, and January 2003. Bacterial production was calculated from 3H-thymidine incorporation rates (TdR)
using a conversion factor of 2.85 × 10⁸ cells mol–1TdR
to Synechococcus, Prochlorococcus, or Cyanobacteria
but to autotrophic picoeukaryotes, suggesting that flagellates could have grazed on autotrophic pico-eukaryotes. Sakka et al. (2000) also provided evidence that protistan grazing on bacteria is low in oligotrophic coral reef lagoons. Thus, the weak correlation between bacterial abundance and HNF abundance could not only be due to top-down control of HNF by ciliates but also due to selective feeding of HNF.
Using the approach of Gasol & Vaqué (1993), Wein-bauer & Peduzzi (1995) found the same lack of cou-pling between bacterial and HNF abundance in the Adriatic Sea. In addition, they reported a strong corre-lation between bacterial and viral abundance. Since viral infection also increased with bacterial abundance and trophic conditions, they speculated that viral con-trol was stronger in eutrophic than in oligotrophic environments. Compilations of literature data also sug-gest that on average, the viral impact can be greater in eutrophic than in oligotrophic environments (Wein-bauer 2004, Parada et al. 2006). The reason for this could be the increased encounter rates with hosts and the lack of top-down control of viral abundance. HNF can ingest and digest viruses; however, since the removal rates are low (González & Suttle 1993), graz-ing is likely not an important mechanism controllgraz-ing viral abundance. Viruses could also originate from sources other than heterotrophic bacteria, such as
Cyanobacteria, which can be abundant at the study
site; in addition, Synechococcus abundance was
sig-nificantly related to viral abundance. However, the abundance of Synechococcus (and Prochlorococcus or
Cyanobacteria) was typically ca. 1 order of magnitude
lower than the abundance of heterotrophic bacteria. Moreover, viral lysis rates seem to be lower for Syne-chococcus and Prochlorococcus than for heterotrophic
bacteria (e.g. Garza & Suttle 1998, Baudoux et al. 2007). Thus, it is likely that the majority of viruses orig-inated from the lysis of heterotrophic bacteria. In the bays, up to 30% of total viral abundance was attached to organic particles at the study site (Mari et al. 2007a). If this attachment is detrimental to viral infectivity (Simon et al. 2002, Weinbauer et al. 2009), attachment could be an important mechanism for viral decay (Sut-tle & Chen 1992). However, this potential loss was at maximum 30% of the total abundance and did not result in a disruption of the correlation between viral and bacterial abundance. Thus, this suggests either that attachment of viruses was not a major cause of loss of viruses or that losses were not substantial.
Solar radiation can destroy viral particles and cause losses of infectivity without losses of particles (Suttle & Chen 1992). Data from the study area suggest that DNA effective radiation attenuates more rapidly with depth in more coastal than in more offshore waters
(Conan et al. 2008). Thus, a gradient in the losses of viral infectivity due to solar radiation can be expected, with the lowest effect in the bays. In addition, cell-spe-cific bacterial production increased towards the bays (Torréton et al. 2007, Rochelle-Newall et al. 2008), and this could also result in an increase of viral infection (Wommack & Colwell 2000). However, these mecha-nisms did not disrupt the relationship between viral and bacterial abundance (Table 5). In the bays, it is possible that increased losses by attachment are bal-anced by reduced losses due to UV light and higher infection frequencies. Thus, assuming that the models of Gasol & Vaqué (1993) and Gasol (1994) are applica-ble, the data indicate that the relative impact on bac-terioplankton mortality changed from viral lysis domi-nating in the bays to HNF domidomi-nating in the open ocean.
Bacterial community composition
Genetic fingerprints such as 16S rRNA gene-based DGGE have methodological constraints, which could influence our analysis. For example, multiple operons could be problematic, either resulting in an overesti-mation of a phylotype (in the case of sequence identity of multiple operons) or in suggesting higher diversity (in the case of sequence diversity of multiple operons). However, this is unlikely for the investigated types of water-column environments (Brown et al. 2005). More-over, it is known that some primers select against
Gammaproteobacteria. However, we used an
im-proved primer set that also detects the SAR11 cluster and some Gammaproteobacteria (Sanchez et al. 2007).
Indeed, the ubiquitous SAR11 cluster (Morris et al. 2002) was detected in our samples. In addition, plastids might be amplified. However, we did not obtain plastid sequences from the SW lagoon of New Caledonia. A high number of phylotypes belonging to Rhodobacteri-aceae as in the present study was also found in the
Mediterranean Sea using DGGE (Alonso-Saez et al. 2007, Malits & Weinbauer 2009), where it was also demonstrated by using fluorescence in situ
hybridiza-tion (FISH) that Roseobacter can be numerically
domi-nant (Alonso-Saez et al. 2007). Our detection of Al-teromonadaceae sequences is more surprising, since
the abundance of this group is thought to be low. How-ever, bloom-like outbreaks have been documented re-cently for Alteromonas (Alonso-Saez et al. 2007),
prob-ably because they can react quickly to disturbances (Allers et al. 2007). At the study site, the Alteromonas
bands were most typical for the bays. Assuming that
Alteromonas-specific responses to disturbance exist,
such disturbances could be mixing of oligotrophic off-shore-water with mesotrophic particle-rich bay water.
It is well known from marine systems that bacterial community composition changes along open gradi-ents such as estuaries (e.g. Bouvier & del Giorgio 2002, del Giorgio & Bouvier 2002, Crump et al. 2004). Using cluster analysis, we found that the gradients separated specific bacterial communities in the open ocean and the 2 bays. The system is characterized by gradients from oligotrophic open ocean waters to mesotrophic bays within a distance of ca. 20 km (Jacquet et al. 2006, Mari et al. 2007b, Rochelle-Newall et al. 2008). The gradients include water resi-dence time, metal concentrations (Ni, Cr, and Zn), nutrient and chl a concentrations, particulate organic
concentration and TEP contribution, and bacterial production (Mari et al. 2007b, Migon et al. 2007, Tor-réton et al. 2007). In addition, coral mucus harbors a large bacterial diversity (Rohwer et al. 2002), and mucus (and thus, probably also attached bacteria) is transported into the lagoon system (Wild et al. 2004). All of these parameters could have influenced bacter-ial community composition.
The community composition of attached and free-living bacteria can be different (DeLong et al. 1993, Acinas et al. 1999, Crump et al. 1999). Particle load increases from open ocean to bay stations (Mari et al. 2007b). Thus, the relative proportion of attached bac-teria is likely much higher in the bays than in the open ocean. Fingerprints of total bacteria did not dif-fer from free-living bacteria in the open ocean, whereas the strongest difference was found for Grande Rade Bay. Thus, our data suggest an abun-dant and phylogenetically specific attached bacterial community in the bays. The long water residence time as a consequence of constrained hydrodynamic circu-lation (Mari et al. 2007b) could provide enough time for the development of a specific or more pronounced community as has been previously suggested for another system (Crump et al. 2004). Bacterial turnover times were indeed much lower than the water resi-dence times in the investigated bays (Fig. 5). In addi-tion, the positively buoyant particles in the bays (Mari et al. 2007b), which keep the attached bacterial com-munities suspended, could have contributed to that. Moreover, this feedback system, where organic mat-ter is not exported efficiently but is continuously degraded in the water column, results in refractory dissolved organic matter (Mari et al. 2007b), which could also have influenced the development of spe-cific communities in the bays. Also, a longer water residence time could provide more opportunities for bacteria from other water masses or the atmosphere to become established and common. A similar mecha-nism could operate for organic matter compounds and metals, which could then also influence bacterial com-munity composition.
Diversity hypotheses
It is noteworthy that we sampled a trophic gradient along which chl a concentration and bacterial
produc-tion varied by more than an order of magnitude (Mari et al. 2007b, Torréton et al. 2007, Rochelle-Newall et al. 2008). Thus, the trophic gradient in the lagoon of Noumea allows for testing predictions from hypotheses describing the relationship between diversity and pro-ductivity. The number of bands detected using genetic fingerprinting is certainly an underestimation of spe-cies richness. Thus, as the number of DGGE bands is interpreted as an indicator of evenness, i.e. a low num-ber of bands likely means a lower evenness and a higher dominance of detectable phylotypes (Bonilla-Findji et al. 2009). As such, DGGE bands can be used to assess hypotheses on mechanisms controlling diver-sity.
A general hypothesis assumes a unimodal distribu-tion of diversity along a productivity gradient, with the highest diversity at intermediate productivity (e.g. Worm et al. 2002). Using chl a to represent
productiv-ity and the number of bands as a diversproductiv-ity parameter, the number of phylotypes of free-living communities decreased linearly with chl a concentration. Others
have found a decrease in the number of phylotypes of free-living communities with increasing bacterial pro-duction and respiration (Reinthaler et al. 2005, Winter et al. 2005). This potentially suggests a common fea-ture such as a change in evenness when trophic gradi-ents are investigated (Worm et al. 2002). We found a unimodal distribution for total communities; however, this distribution showed a U-shape and not a hump form. It has been shown before that the relationship between chl a and the number of detected bands for
bacterioplankton can be complex. Hump-shaped, U-shaped, and a lack of relationships between the rich-ness of different large taxonomic groups of bacteria and chl a concentration have been demonstrated for
freshwater systems (Horner-Devine et al. 2004a). Our findings (PCA, regression and cluster analysis) sug-gests that complex patterns can also originate from differences in community composition between free-living and attached bacteria and from varying con-tributions of the attached to total communities. The low dominance in offshore waters supports widely held but not thoroughly tested ideas that dominance is lower and species diversity is higher in oligotrophic than in eutrophic environments. The low dominance in the bays could then be due to a mixture of very different free-living and attached communities.
Mortality factors such as viral lysis and protistan grazing can also influence productivity-diversity rela-tionships (Worm et al. 2002). For example, the number of detected phylotypes of the free-living community
decreased with viral abundance in the North Sea (Win-ter et al. 2005). A decrease in the number of bands of the free-living community with increasing viral abun-dance was also detected in the present study. PCA-C2 suggested a positive effect of HNF on the number of bands of the total community, and PCA-C3 indicated a negative effect of ciliates. HNF can sustain the number of detected phylotypes, especially when acting syner-gistically with viral lysis (Zhang et al. 2007, Bonilla-Findji et al. 2009). HNF and viruses can also modify the relationship between diversity (as the number of DGGE bands) and productivity (Bonilla-Findji et al. 2009). The PCA component matrix could thus suggest that, at high grazing pressure by HNF, bacterial even-ness is sustained; at low grazing pressure, i.e. when HNF are top-down controlled by ciliates, only a few bacterial phylotypes may dominate.
CONCLUSIONS
This study is one of the few investigating bacterial community composition in tropical coral reef ecosys-tems. Bacterial community composition was clearly dif-ferent between offshore waters and the semi-enclosed bays. Water residence time and mortality factors seemed to be a crucial parameter structuring bacterial communities. An unexpected potentially cascading ef-fect of ciliate control on HNF, and thus on bacterial community composition, was detected. Our data also confirm the idea that it may be necessary to distinguish between attached and free-living bacterial community diversity and associated methods to assess productivity.
Acknowledgements. We thank the crew of the RV ‘Coris’ for
their assistance during sampling. This research was sup-ported by the French National Research Agency (ANR-ECCO program and ANR-Blanc-MAORY project) and by the French Research Institute for Development (IRD). We thank C. Win-ter for help with the similarity tree and J. Dolan for improving the English. Two anonymous reviewers made valuable com-ments, which helped to improve the manuscript.
LITERATURE CITED
Acinas SG, Antón J, Rodríguez-Valera F (1999) Diversity of free-living and attached bacteria in offshore Western Mediterranean waters as depicted by analysis of genes encoding 16S rRNA. Appl Environ Microbiol 65:514–522 Allers E, Gomez-Consarnau L, Pinhassi J, Gasol JM, Simek K, Pernthaler J (2007) Response of Alteromonadaceae and Rhodobacteriaceae to glucose and phosphorus
manipula-tion in marine mesocosms. Environ Microbiol 9:2417–2429 Alonso-Saez L, Balagué V, Sa EL, Sanchez O and others
(2007) Seasonality in bacterial diversity in north-west Mediterranean coastal waters: assessment through clone libraries, fingerprinting and FISH. FEMS Microbiol Ecol 60:98–112
Arrieta JM, Herndl GJ (2002) Changes in bacterial β-glucosi-dase diversity during a coastal phytoplankton bloom. Lim-nol Oceanogr 47:594–599
Arrieta JM, Weinbauer MG, Lute C, Herndl GJ (2004) Response of bacterioplankton to iron addition in the Southern Ocean. Limnol Oceanogr 49:799–808
Baines SB, Pace ML (1991) The production of dissolved organic matter by phytoplankton and its importance to bacteria: patterns across marine and freshwater systems. Limnol Oceanogr 36:1078–1090
Baudoux AC, Veldhuis M, Witte HJ, Brussaard CPD (2007) Viruses as mortality agents of picophytoplankton in the deep chlorophyll maximum layer during IRONAGES III. Limnol Oceanogr 52:2519–2529
Bell T, Ager D, Song JI, Newman JA, Thompson IP, Lilley AK, van der Gast CJ (2005) Larger islands house more bacter-ial taxa. Science 308:1884
Bonilla-Findji O, Herndl G, Gattuso JP, Weinbauer MG (2009) Viral and flagellate control of prokaryotic production and community structure in offshore Mediterranean waters. Appl Environ Microbiol 75:4801–4812
Bouvier TC, del Giorgio PA (2002) Compositional changes in free-living bacterial communities along a salinity gradient in two temperate estuaries. Limnol Oceanogr 47:453–470 Brown MV, Schwalbach MS, Hewson I, Fuhrman JA (2005) Coupling 16S-ITS rDNA clone libraries and automated ribosomal intergenic spacer analysis to show marine microbial diversity: development and application to a time series. Environ Microbiol 7:1466–1479
Brussaard CP (2004) Optimization of procedures for counting viruses by flow cytometry. Appl Environ Microbiol 70: 1506–1513
Charpy L, Dufour P, Garcia N (1997) Particulate organic mat-ter in sixteen Tuamotu atoll lagoons (French Polynesia). Mar Ecol Prog Ser 151:55–65
Cole JJ, Findlay S, Pace ML (1988) Bacterial production in fresh and saltwater ecosystems: a cross-system overview. Mar Ecol Prog Ser 43:1–10
Conan P, Joux F, Torreton JP, Pujo-Pay M, Douki T, Rochelle-Newall E, Mari X (2008) Effect of solar ultraviolet radiation on bacterio- and phytoplankton activity in a large coral reef lagoon (southwest New Caledonia). Aquat Microb Ecol 52:83–98
Crump BC, Armbrust EV, Baross JA (1999) Phylogenetic analysis of particle-attached and free-living bacterial communities in the Columbia River, its estuary, and the adjacent coastal ocean. Appl Environ Microbiol 65: 3192–3204
Crump BC, Hopkinson CS, Sogin ML, Hobbie JE (2004) Microbial biogeography along an estuarine salinity gradi-ent: combined influences of bacterial growth and resi-dence time. Appl Environ Microbiol 70:1494–1505 del Giorgio PA, Bouvier TC (2002) Linking the physiologic
and phylogenetic successions in free-living bacterial com-munities along an estuarine gradient. Limnol Oceanogr 47:471–486
Delesalle B, Sournia A (1992) Residence time of water and phytoplankton biomass in coral reef lagoons. Cont Shelf Res 12:939–949
DeLong EF, Franks DG, Alldregde AL (1993) Phylogenetic diversity of aggregate-attached vs. free-living marine bac-terial assemblages. Limnol Oceanogr 38:924–934 Dinsdale EA, Pantos O, Smriga S, Edwards RA and others
(2008) Microbial ecology of four coral atolls in the North-ern Line Islands PLoS ONE 3: e1584. doi:10.1371/journal. pone.0001584
Ferrier-Pagès C, Gattuso JP (1998) Biomass, production and
➤
➤
➤
➤
➤
➤
➤
➤
➤
➤
➤
➤
➤
➤
➤
➤
➤
➤
➤
➤
➤
➤
grazing rates of pico- and nanoplankton in coral reef waters (Miyako Island, Japan). Microb Ecol 35:46–57 Fuhrman JA, Hewson I, Schwalbach MS, Steele JA, Brown
MV, Naeem S (2006) Annually reoccurring bacterial com-munities are predictable from ocean conditions. Proc Natl Acad Sci USA 103:13104–13109
Fuhrman JA, Steele JA, Hewson I, Schwalbach MS, Brown MV, Green JL, Brown JH (2008) A latitudinal diversity gradient in planktonic marine bacteria. Proc Natl Acad Sci USA 105:7774–7778
Garza DR, Suttle CA (1998) The effect of cyanophages on the mortality of Synechococcus spp. and selection for UV
resistant viral communities. Microb Ecol 36:281–292 Gasol JM (1994) A framework for the assessment of top-down
vs bottom-up control of heterotrophic nanoflagellate abundance. Mar Ecol Prog Ser 113:291–300
Gasol J, del Giorgio P (2000) Using flow cytometry for count-ing natural planktonic bacteria and understandcount-ing the structure of planktonic bacterial communities. Sci Mar 64: 197–224
Gasol JM, Vaqué D (1993) Lack of coupling between hetero-trophic nanoflagellates and bacteria: a general phenome-non across aquatic systems? Limnol Oceanogr 38:657–665 Giovannoni SJ, Rappé MS, Vergin KL, Adair NL (1996) 16S rRNA genes reveal stratified open ocean bacterioplankton populations related to the green non-sulfur bacteria. Proc Natl Acad Sci USA 93:7979–7984
González JM, Suttle CA (1993) Grazing by marine nanofla-gellates on viruses and viral-sized particles: ingestion and digestion. Mar Ecol Prog Ser 94:1–10
Grossart HP, Tang KW, Kiørboe T, Ploug H (2007) Compari-son of cell-specific activity between free-living and attached bacteria using isolates and natural assemblages. FEMS Microbiol Lett 266:194–200
Herndl GJ, Velimirov B (1986) Microheterotrophic utilization of mucus released by the Mediterranean coral Cladocora cespitosa. Mar Biol 90:363–369
Hewson I, Vargo GA, Fuhrman JA (2003) Bacterial diversity in shallow oligotrophic marine benthos and overlying waters: effects of virus infection, containment, and nutri-ent enrichmnutri-ent. Microb Ecol 46:322–336
Horner-Devine MC, Carney KM, Bohannan BJ (2004a) An ecological perspective on bacterial biodiversity. Proc Biol Sci 271:113–122
Horner-Devine MC, Lage M, Hughes JB, Bohannan BJ (2004b) A taxa–area relationship for bacteria. Nature 432:750–753 Jacquet S (2005) Impact des apports en nutriments sur le
réseau trophique planctonique dans du lagon sud-ouest de Nouvelle-Calédonie. PhD thesis, Université Pierre et Marie Curie, Paris
Jacquet S, Delesalle B, Torréton JP, Blanchot J (2006) Response of phytoplankton communities to increased anthropogenic influences (southwestern lagoon, New Caledonia). Mar Ecol Prog Ser 320:65–78
Jouon A, Douillet P, Ouillon S, Fraunié P (2006) Calculations of hydrodynamic time parameters in a semi-opened coastal zone using a 3D hydrodynamic model. Cont Shelf Res 26:1395–1415
Lee S, Fuhrman JA (1991) Spatial and temporal variation of natural bacterioplankton assemblages studied by total genomic DNA cross-hybridization. Limnol Oceanogr 36: 1277–1287
Malits A, Weinbauer MG (2009) Effect of turbulence and viruses on aggregate formation and prokaryotic cell size, production and diversity. Aquat Microb Ecol 54:243–254 Mari X, Kerros ME, Weinbauer MG (2007a) Virus attachment
to transparent exopolymeric particles along trophic
gradi-ents in the southwest lagoon of New Caledonia. Appl Env-iron Microbiol 73:5245–5252
Mari X, Rochelle-Newall E, Torréton JP, Pringault O, Jouon A, Migon C (2007b) Water residence time: a regulatory factor of the DOM to POM transfer efficiency. Limnol Oceanogr 52:808–819
Migon C, Ouillon S, Mari X, Nicolas E (2007) Geochemical and hydrodynamic constraints on the distribution of trace metal concentrations in the lagoon of Noumea, New Cale-donia. Estuar Coast Shelf Sci 74:756–765
Morris RM, Rappé MS, Connon SA, Vergin KL (2002) SAR11 clade dominates ocean surface bacterioplankton commu-nities. Nature 420:806–810
Parada V, Herndl GJ, Weinbauer MG (2006) Viral burst size of heterotrophic prokaryotes in aquatic systems. J Mar Biol Assoc UK 86:613–621
Pernthaler J (2005) Predation on prokaryotes in the water col-umn and its ecological implications. Nat Rev Microbiol 3: 537–546
Pernthaler J, Amann R (2005) Fate of heterotrophic microbes in pelagic habitats: focus on populations. Microbiol Mol Biol Rev 69:440–461
Pinhassi J, Hagström Å (2000) Seasonal successions in marine bacterioplankton. Aquat Microb Ecol 21:245–256 Rath H, Schiller C, Herndl GJ (1993) Ectoenzymatic activity
and bacterial dynamics along a trophic gradient in the Caribbean Sea. Mar Ecol Prog Ser 102:89–96
Reche I, Pulido-Villena E, Morales-Baquero R, Casamayor EO (2005) Does ecosystem size determine aquatic bacterial richness? Ecology 86:1715–1722
Reinthaler T, Winter C, Herndl GJ (2005) Relationship between bacterioplankton richness, respiration, and pro-duction in the Southern North Sea. Appl Environ Micro-biol 71:2260–2266
Rochelle-Newall EJ, Torréton JP, Mari X, Pringault O (2008) Phytoplankton-bacterioplankton coupling in the coastal sub-tropical South Pacific. Aquat Microb Ecol 50:221–229 Rohwer F, Seguritan V, Azam F, Knowlton N (2002) Diversity
and distribution of coral-associated bacteria. Mar Ecol Prog Ser 243:1–10
Sakka A, Legendre L, Gosselin M, Delesalle B (2000) Struc-ture of the oligotrophic planktonic food web under low grazing of heterotrophic bacteria: Takapoto Atoll, French Polynesia. Mar Ecol Prog Ser 197:1–17
Sanchez O, Gasol JM, Massana R, Mas J, Pedros-Alio C (2007) Comparison of different denaturing gradient gel electrophoresis primer sets for the study of marine bacteri-oplankton communities. Appl Environ Microbiol 73: 5962–5967
Schäfer H, Muyzer G (2001) Denaturing gradient gel elec-trophoresis in marine microbial ecology. In: Paul J (ed) Marine microbiology, Vol 30. Academic Press, San Diego, CA, p 425–468
Schiller C, Herndl GJ (1989) Evidence of enhanced microbial activity in the interstitial space of branched corals: possi-ble implications for coral reef metabolism. Coral Reefs 7:179–184
Servais P, Courties C, Lebaron P, Troussellier M (1999) Cou-pling bacterial activity measurements with cell sorting by flow cytometry. Microb Ecol 38:180–189
Simon M, Grossart HP, Schweitzer B, Ploug H (2002) Micro-bial ecology of organic aggregates in aquatic ecosystems. Aquat Microb Ecol 28:175–211
Suttle CA, Chen F (1992) Mechanisms and rates of decay of marine viruses in seawater. Appl Environ Microbiol 58: 3721–3729
Torréton JP (1999) Biomass, production and heterotrophic
➤
➤
➤
➤
➤
➤
➤
➤
➤
➤
➤
➤
➤
➤
➤
➤
➤
➤
➤
➤
➤
➤
➤
➤
➤
➤
➤
➤
➤
➤
➤
➤
➤
➤
➤
➤
➤
➤
➤
➤
➤
➤
➤
➤
➤
➤➤
activity of bacterioplankton in the Great Astrolabe Reef lagoon (Fiji). Coral Reefs 18:43–53
Torréton JP, Dufour P (1996) Temporal and spatial stability of bacterioplankton biomass and productivity in an atoll lagoon. Aquat Microb Ecol 11:251–261
Torréton JP, Pagès J, Talbot V (2002) Relationship between bacterioplankton and phytoplankton biomass, production and turnover rate in Tuamotu atoll lagoons. Aquat Microb Ecol 28:267–277
Torréton JP, Rochelle-Newall EJ, Jouon A, Faure V, Jacquet S, Douillet P (2007) Correspondence between the distri-bution of hydrodynamic time parameters and the distrib-ution of biological and chemical variables in a semi-enclosed coral reef lagoon. Estuar Coast Shelf Sci 74: 766–776
Weinbauer MG (2004) Ecology of prokaryotic viruses. FEMS Microbiol Rev 28:127–181
Weinbauer MG, Peduzzi P (1995) Significance of viruses ver-sus heterotrophic nanoflagellates for controlling bacterial abundance in the Northern Adriatic Sea. J Plankton Res 17:1851–1856
Weinbauer MG, Bettarel Y, Cattaneo R, Luef B and others (2009) Viral ecology of organic and inorganic particles in aquatic systems: avenues for further research. Aquat
Microb Ecol 57:321–341
Wild C, Huettel M, Klueter A, Kremb SG, Rasheed MY, Jor-gensen BB (2004) Coral mucus functions as an energy car-rier and particle trap in the reef ecosystem. Nature 428: 66–70
Winter C, Moeseneder MM, Herndl GJ (2001) Impact of UV radiation on bacterioplankton community composition. Appl Environ Microbiol 67:665–672
Winter C, Smit A, Herndl G, Weinbauer M (2004) Impact of virioplankton on archaeal and bacterial community rich-ness in seawater batch cultures. Appl Environ Microbiol 70:804–813
Winter C, Smit A, Herndl GJ, Weinbauer MG (2005) Linking bacterial richness with viral abundance and prokaryotic activity. Limnol Oceanogr 50:968–977
Wommack KE, Colwell RR (2000) Virioplankton: viruses in aquatic ecosystems. Microbiol Mol Biol Rev 64:69–114 Worm B, Lotze HK, Hillebrand H, Sommer U (2002)
Con-sumer versus resource control of species diversity and ecosystem functioning. Nature 417:848–851
Zhang R, Weinbauer MG, Qian PY (2007) Viruses and flagel-lates sustain apparent richness and reduce biomass accu-mulation of bacterioplankton in coastal marine waters. Environ Microbiol 9:2008–2018
Editorial responsibility: Ruben Sommaruga, Innsbruck, Austria
Submitted: May 28, 2009; Accepted: February 18, 2010 Proofs received from author(s): April 21, 2010