HAL Id: hal-01423307
https://hal.inria.fr/hal-01423307
Submitted on 29 Dec 2016HAL is a multi-disciplinary open access archive for the deposit and dissemination of sci-entific research documents, whether they are pub-lished or not. The documents may come from teaching and research institutions in France or abroad, or from public or private research centers.
L’archive ouverte pluridisciplinaire HAL, est destinée au dépôt et à la diffusion de documents scientifiques de niveau recherche, publiés ou non, émanant des établissements d’enseignement et de recherche français ou étrangers, des laboratoires publics ou privés.
BACH2 promotes indolent clinical presentation in
Waldenström macroglobulinemia
Charles Herbaux, Elisabeth Bertrand, Guillemette Marot, Christophe
Roumier, Nicolas Poret, Valérie Soenen, Olivier Nibourel, Catherine
Roche-Lestienne, Natacha Broucqsault, Sylvie Galiègue-Zouitina, et al.
To cite this version:
Charles Herbaux, Elisabeth Bertrand, Guillemette Marot, Christophe Roumier, Nicolas Poret, et al.. BACH2 promotes indolent clinical presentation in Waldenström macroglobulinemia. Oncotarget, Impact journals, 2016. �hal-01423307�
www.impactjournals.com/oncotarget/ Oncotarget, Advance Publications 2016
BACH2 promotes indolent clinical presentation in Waldenström
macroglobulinemia
Charles Herbaux1,2, Elisabeth Bertrand1, Guillemette Marot3, Christophe Roumier4,
Nicolas Poret1, Valérie Soenen4, Olivier Nibourel4, Catherine Roche-Lestienne4,
Natacha Broucqsault1, Sylvie Galiègue-Zouitina1, Eileen M Boyle2, Guillemette
Fouquet2, Aline Renneville4, Sabine Tricot5, Franck Morschhauser2, Claude
Preudhomme4, Bruno Quesnel1,2, Stephanie Poulain5, Xavier Leleu6,7
1Inserm U837, Team 3, Cancer research Institute of Lille, Lille, France 2Service des Maladies du Sang, Hôpital Huriez, CHRU, Lille, France 3Lille Nord de France University, Equipe Biostatistique, UDSL, Lille, France 4Laboratory d’Hématologie, Biologie and pathologie Center, CHRU, Lille, France 5Département d’Hématologie-Immunologie-Cytogénétique, CH, Valenciennes, France 6Service d’Hématolgie et Thérapie cellulaire, Hématologie, CHU, Poitiers, France 7Centre d’Investigation Clinique Inserm, CHU, Poitiers, France
Correspondence to: Xavier Leleu, email: [email protected]
Keywords: BACH2, Waldenström macroglobulinemia, indolent, progression, physiopathology
Received: February 21, 2016 Accepted: May 12, 2016 Published: June 07, 2016
ABSTRACT
Approximately 30% of the patients who fulfil the criteria of Waldenström’s macroglobulinemia (WM) are diagnosed while asymptomatic (indolent), and will not require immediate therapy. Conversely, patients with a disease-related event will be considered for therapy. The physiopathology of these 2 groups remains unclear, and the mechanisms of progression from indolent to symptomatic WM have yet to be fully understood. Seventeen patients diagnosed with WM were included in this study, 8 asymptomatic WM (A-WM) and 9 symptomatic WM (S-WM). A differential analysis was performed on a first series of 11 patients and identified 48 genes whose expression separated samples from A- to S-WM. This gene signature was then confirmed on a second independent validation set of 6 WM. Within this expression profile, BACH2, a B-cell transcription factor known to be a tumor suppressor gene, was found to be over-expressed in A-MW relatively to S-MW. We specifically over-expressed BACH2 in a WM-related cell line and observed a significant reduction of the clonogenic activity. To the best of our knowledge, we report for the first time a specific gene expression signature that differentiates A-WM and S-WM. Within this expression profile, BACH2 was identified as a candidate gene that may help to understand better the behavior of tumor cells in indolent WM.
INTRODUCTION
Waldenström’s macroglobulinemia (WM), a rare lymphoproliferative disorder characterized by bone marrow (BM) infiltration of lymphoplasmacytic cells associated with serum IgM paraprotein [1], has various clinical presentations. Mainly, WM is characterized with either symptomatic (S-WM) or asymptomatic (A-WM also called smoldering or indolent WM) features, according to the presence or absence of features attributable to
tumor infiltration and/or attributable to the monoclonal protein [2]. The exact incidence rate of A-WM is unknown as many patients are possibly undiagnosed, and one might consider it represents the majority of WM [3], but the consequence for the patients is remarkable as A-WM will not require immediate therapy sometimes for years. Conversely, patients with WM disease-related events will be considered for therapy [4].
The long lasting indolent profile is not specific to WM, and is observed virtually in all B-cell non Hodgkin
low grade lymphoma subtypes. Understanding the key physiopathological mechanisms that protect tumor cells from progression towards aggressive/symptomatic disease might be a target for therapy in the very near future. Although progress was made in recent years to understand the pathogenesis of WM, very little is known about differences between A-WM and S-WM, and the mechanisms of progression from A-WM to S-WM have yet to be understood. Gene expression profiling has been shown to identify specific signature allowing clinical aggressiveness stratification in myeloma [5, 6] and in follicular lymphoma [7].
We therefore hypothesized that a gene signature that differentiates S-WM from A-WM could be identified. The purpose of this study was to find pathways and genes from this gene signature that will help better understand the underlying mechanisms that differentiate S-WM from A-WM.
RESULTS
A-WM and S-WM display different gene expression profile-based signatures
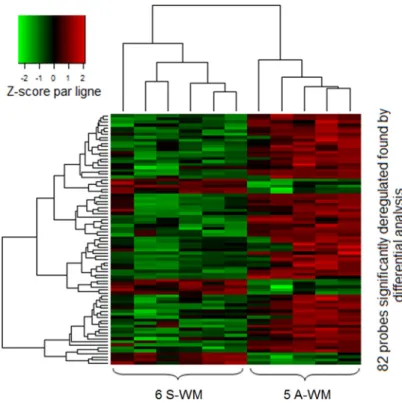
We first studied a set of 11 patients (5 A-WM and 6 S-WM) with a high-throughput assay-based comprehensive approach. The differential analysis identified 82 probes corresponding to 48 genes whose patterns of expression resulting from using an unsupervised classification were able to differentiate samples from A-WM and S-WM (Figure 1) The 48 genes are listed in Supplementary Data Table 1.
Validation of the 48 genes-based signature on an independent set of patients
We sought to validate the 48 genes-based signature obtained with the first set of 11 patients on an independent set of 6 patients with WM. For this supervised classification the objective was to study whether the A-WM and S-WM would be correctly identified and categorized using the 48 genes-based signature profile. Our gene expression-profiling-based signature was overall able to classify accurately 94% of the 17 WM patients, including the 6 WM of an independent validation set (Figure 2).
Pathway analysis of in the signature
We then reviewed the literature and sought for specific pathways involved in the difference between A-WM and S-WM using Ingenuity® software, on the 48 genes independently of the fold-changes. The pathway analysis identified three networks: the B cell differentiation and activation pathway, the PI3K/AKT pathway and the microenvironment interactions pathways (Supplementary Data Table 2). Following the review of the literature, 3
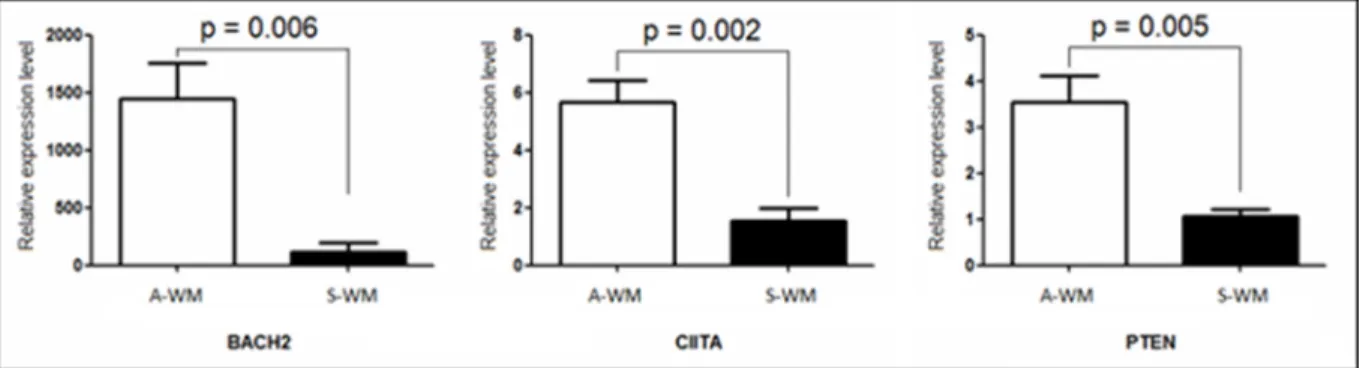
genes appeared of key interest: BACH2, CIITA and PTEN. BACH2 is a B-cell-specific transcription factor known to be a tumor suppressor gene [8]. CIITA acts as a positive regulator of class II major histocompatibility complex gene transcription [9], BACH2 increases the expression of CIITA through PRDM1. PTEN functions as a tumor suppressor by negatively regulating AKT1 signaling, a pathway involved in WM [10]. We then sought to confirm the transcriptional dysregulation of these 3 genes on patients with WM, 3 A-WM and 4 S-WM, by qRT-PCR (Figure 3).
Genomic alteration of BACH2
In order to study further the mechanisms of deregulation of BACH2 in A-WM and S-WM, we conducted a genome wide SNP array study on 14 out of the 17 WM included in this study. BACH2 gene is located on the 6q15 locus. Among those 14 patients, 8 (4 A-WM and 4 S-WM) demonstrated a deletion of long arm of chromosome 6 (del6q), the most frequent chromosomal abnormality in WM, seen in approximately 50% of WM. Interestingly, we noticed that 3 out of the 4 S-WM with del6q had the 6q15 locus altered, whereas 3 out of 4 of the A-WM had a del6q preserving the 6q15 region (Figure 4).
BACH2 involved in clonogenic activity in A-WM
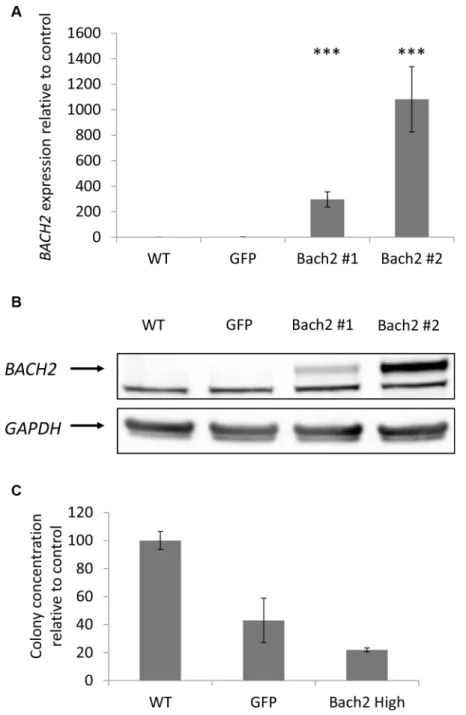
As mentioned above, we gave a special interest to BACH2 following ingenuity pathway analysis and literature review. In our study, BACH2 expression was increased in indolent WM relative to symptomatic WM, and thus we sought to reproduce in vitro the two asymptomatic and symptomatic WM profile through the study of the consequences of BACH2 deregulation on a WM cell-line. Of interest, we noticed that BCWM1 was the most proliferative WM cell line (as compared to MWCL1 for example), in vitro. We first specifically over-expressed BACH2 in BCWM1, as presented in panel A and B of Figure 5. We then studied viability and cell growth. We did not observe any difference between wild type BCWM1 and BACH2 high engineered BCWM1 (data not shown). We then focused on studying the clonogenic activity according to the level of BACH2 expression, another major phenomenon and key feature of tumorigenesis. As shown on Figure 5C, we noticed that the clonogenic activity was significantly reduced in BACH2 high engineered cell lines.
DISCUSSION
We have identified a specific gene expression signature of 48 genes that differentiates A-WM and S-WM, validated on an independent set of patients. Some genes appeared of key interest to explain the differences observed between A-WM and S-WM. BACH2 is a B-cell transcription factor known to act as a tumor
Figure 1: GEP identifies a signature that allows to differentiate A-WM from S-WM. Gene expression data were normalized using the Robust Multi-array Average (RMA) algorithm. Then we performed differential analysis on a first series of 11 patients; 82 probes (corresponding to 48 genes) were significantly identified. The heatmap shows the spectrum of normalized expression values with a Z-score: red indicates a high level of mRNA expression and green indicates a low level of expression. Each row represents one of the 82 probes and each column a WM sample. In this unsupervised classification, patients with A-WM clustered separately from patients with S-WM.
Figure 2: Correlation plot of the transcriptional profile for A-WM and S-WM. The correlation coefficients for each of the WM samples with the average expression of the 82 probes in either A-WM or S-WM samples were calculated and are shown on the vertical axis and horizontal axis, respectively. The line of equal correlation was chosen as threshold. Patients positioned above the threshold were classified as A-WM; patients below the threshold were classified as S-WM. The blue dots correspond to the A-WM, the yellow ones to the S-WM. The circles correspond to the first 11 patients and the triangles to the 6 patients from the independent set.
suppressor gene. CIITA is part of the same signaling pathway as BACH2; BACH2 represses BLIMP1 which represses CIITA. Otherwise, it was demonstrated that primary WM cells present a constitutive activation of the PI3K/Akt pathway [10], sustained by decreased expression of PTEN. In our study, BACH2, CIITA and PTEN expression is lower in S-WM than in A-WM. The suppressor of cytokine signalling-6 (SOCS6) is over-expressed in tumor cells of patients with symptomatic WM. In this particular case, two pathophysiological hypotheses are possible. First, SOCS6 could inhibit antitumor immunity by suppressing effects of IFN-alpha, as described for SOCS3 in T lymphoma [11]. On the other hand, the over-expression of SOCS6 could be an epiphenomenon, constituting a negative feedback loop in response to multiple cytokine stimulation experienced by aggressive WM tumor cells, as described for SOCS1 in chronic myeloproliferative disorders [12]. Other genes could have also been interesting candidates considering their important fold-change and low p-value in the differential analysis, the list is available in Supplementary Table 1.
One of the important findings of this study was the identification of BACH2 as a potential key player in the aggressiveness of WM tumor cells. BACH2 is a transcription factor that is selectively expressed in B-cells, abundantly expressed in B-cell early stages and turned off in terminally differentiated cells [13]. This protein has multifaceted actions in B cell development [8], from tumor suppressor gene to class switch recombination and somatic hypermutation [14]. Most importantly, BACH2-mediated activation of TP53 is required for elimination of pre-B cells that failed to productively rearrange immunoglobulin gene [15]. Many studies have examined the role of BACH2 in lymphoid neoplasms in relation to its critical actions in the B lymphocyte development and ontogeny, particularly as a tumor suppressor gene [13, 16, 17]. Importantly, it was shown that BACH2 reduced proliferation and induced cell death when over-expressed in B lymphoma tumor cells [17], and enforced expression of BACH2 in RAJI cell line resulted in marked reduction of clonogenic activity [8]. These findings are consistent with the key functions of BACH2 in the lymphomagenesis, in DLBCL, but also
Figure 3: Confirmation of the gene expression profile by RT-qPCR. Quantification of mRNA of BACH2, CIITA and PTEN was performed by real time qPCR against an endogenous control gene: ABL1. Histograms show relative expression values between A-WM and S-WM. The white histograms correspond to Asymptomatic WM, the black ones to Symptomatic WM. A statistically significant difference was observed on the three genes.
Figure 4: BACH2 locus alteration differs in patients with 6q deletion according to WM status. Smooth signal of copy number variation is shown for 4 patients with a 6q deletion (del6q). The vertical line shows the BACH2 gene location in 6q15 region. Examples 1 and 4 are asymptomatic patients, with a del6q preserving the 6q15 locus. Examples 2 and 3 are symptomatic patients with a del6q involving 6q15 locus.
apparently in WM as we have shown, although the exact mechanism of action of BACH2 remains to be identified. BACH2 was previously mentioned in WM in two studies [18, 19], as part of a gene expression profile. The first study discriminated clonal B lymphocytes from WM and CLL, while the second one discriminated Waldenström’s clone and normal CD22+CD25− B-cells. Interestingly, the second study showed that BACH2 was under-expressed in Waldenström’s clone (clonal B-cells from IgM MGUS and
WM patients), consistent with our findings, and provides additional argument for the assumption that BACH2 plays a tumor suppressor gene-role in WM.
It was described that the frequency of WM patients displaying genomic alteration (like copy-number alterations or loss of heterozygosity) significantly increased from asymptomatic to symptomatic WM [19, 20]. It is therefore expected that these genomic abnormalities might cause a significant modification of
Figure 5: Clonogenic activity was significantly reduced in a BACH2 high engineered cell line. Expression of Bach2 in transfectants. (A) RNA level were measured by q-RTPCR in BCWM1 cell line non transduced (WT), infected with an empty particle (GFP) and in several transfectants (Bach2 #1 and #2). Histograms show relative expression values. (B) Protein expression of Bach2 was evaluated by Western blot in the same cell lines (p < 0,003). Only the highest Bach2 expressing clone was used for the next experiments. (C) Methylcellulose colony formation assay was performed on BCWM1 cell line as described in Materials and methods. As a control, BCWM1 non transduced (WT) and infected with an empty lentiviral particle (GFP) were used. Histograms show relative concentration values.
gene expression profile, as shown in our study for the first time to the best of our knowledge. Surprisingly, Paiva et al. [19] reported absence of difference between the gene expression profile of A-WM versus S-WM; possibly explained by the lower number of patients in their transcriptomic study (4 asymptomatic and 6 symptomatic). Furthermore, Paiva et al. used FACS-sorted cells, while we used immunomagnetic beads sorted cells (purity of sample was then confirmed by flow cytometry).
We showed that the MDR (minimal deleted region) of del6q seemed to differ in size for A-WM and S-WM, and also seemed to differ in the integration of the 6q15 locus, where BACH2 is located. Indeed, among patients with del6q, we noticed that patients with S-WM demonstrated more frequently a del6q involving the 6q15 locus. We therefore concluded that haploinsufficiency could participate in the under-expression of BACH2 in symptomatic WM
In our study, BACH2 expression did not seem to be correlated with viability and cell growth in WM, but only with clonogenic activity. The same data was reported in RAJI cell line [8]. In this study, the authors also performed two kinds of assays. One was to monitor growth curves, and the other was to monitor colony formation activity. The latter assay is thought to be more stringent in terms of cell proliferation.
Finally, these data might have therapeutic applications. Targeting a tumor suppressor gene is known to be difficult, but the BACH2 pathway could be targeted. For example, BACH2 represses BLIMP1. A BLIMP1 inhibitor could possibly guide symptomatic WM cells in a more indolent phenotype.
We report for the first time a GEP signature allowing to distinguish asymptomatic from symptomatic WM. Using this set of data we have identified key pathways and genes to help further understand the mechanisms of progression and the physiopathology of WM. In particular, BACH2 expression seems to be significantly correlated with the phenotypic differences between asymptomatic and symptomatic WM. Future studies will help validate this gene signature and might decipher the role of BACH2 in WM.
MATERIALS AND METHODS
Patients
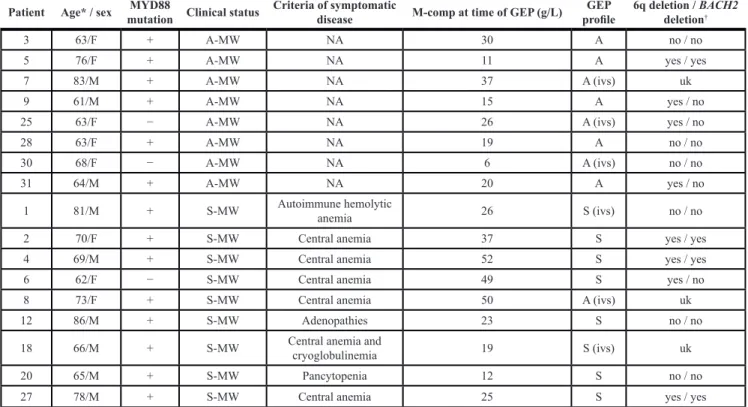
Seventeen patients diagnosed with WM [1] (8 A-WM and 9 S-WM) were included in this study. Table 1 summarizes the main characteristics of the patients. Patients were untreated and gave informed consent prior to research sampling. The median age was 70 years (range, 61–86). Approval of this protocol was obtained from the local IRB of the CHRU of Lille (CSTMT043) and the study was conducted in accordance with the Declaration of Helsinki.
Conventional Cytogenetic, FISH, Immunophe-notypic studies were available for all the patients and performed as previously published [20].
Cell selection
Research sampling consisted of BM samples and blood cells for all WM patients. T lymphocytes normal fraction was used as an intra-individual reference to distinguish acquired somatic aberrations in WM from germline polymorphisms. The samples were enriched for cell population of interest using immunomagnetic beads (B cell isolation kit for tumoral cells, and Pan T cell isolation kit, Myltenyi-Biotec, USA). The purity of samples was confirmed by flow cytometry on tumor (CD19, kappa and lambda) and normal cell fractions (CD3, T lymphocytes). DNA was extracted using Qui Amp kit (Sigma-Aldrich Co. Saint-Quentin Fallavier France). Total RNA was extracted using the Trizol method (Invitrogen, Carlsbad CA).
Cell line and lentiviral infection
BCWM.1 cell line was used in this study. This is a B-cell line developed in patients with WM; BCWM.1 was a gift from Dr S.P. Treon from DFCI (Dana-Farber Cancer Institute) [21], and harboring MYD88 L265P mutation but no 6q deletion. Lentiviral constructs expressing GFP and resistance to puromycin used to generate stable Bach2 expressing BCWM.1 cell line (BCWM.1-Bach2) and empty vector (BCWM.1-GFP) were purchased from Applied Biological Material (ABM) Inc. (Richmond, BC). BCWM.1 cell line was exposed to lentiviral particles for 6 hours at a multiplicity of infection (MOI) of 2. Two days after the infection, selection of the infected cells was done by adding puromycin to the culture medium at a concentration of 1 µg/mL.
Proliferation, viability, immunoblotting and clonogenicity assay
Viability and cell growth were determined using the MTS assays, CellTiter 96® AQueous One Solution Cell Proliferation Assay (Promega) and the Click-iT® EdU Flow Cytometry Assay kit (Invitrogen) according to the manufacturer’s protocol, respectively. Apoptosis was measured using annexin V - propidium iodide staining using flow cytometric analysis (Beckman Coulter, Brea, CA, USA). Study of mitochondrial membrane potential was achieved using MitoTracker Red CMXRos-Special Packaging® (Invitrogen). Study of caspases activity was performed using staining CaspaLux® (OncoImmunin, Gaithersburg, MD). The clonogenic activity of each BCWM1 clone was evaluated by methylcellulose culture. 500 cells were placed in 1 ml of methylcellulose
medium without cytokines (MethoCult H4230, Stemcell technologies, Vancouver, Canada) in duplicates, and incubated under fully humidified conditions in 35 mm Petri dish (Greiner Bio-One, Kremsmünster, Austria) at 37°C in 5% CO2. Colonies were numbered on day 10. The following antibodies were used for immunoblotting on whole cell lysates: anti-BACH2 (LSBio®, Seattle, WA, USA) and anti-actin (Santa Cruz Biotechnology, Santa Cruz, CA, USA).
Real-time quantitative reverse transcription PCR
Quantification of mRNA of BACH2, CIITA and PTEN was performed by real time qPCR against an endogenous control gene, ABL1, with correspondent Taqman® assays on StepOneTM Real-Time PCR System (Life Technologies, CA, USA). Relative expression values were calculated using the means of ∆ Ct (threshold cycle) from the triplicates and expressed as 2-DDCt.
Single nucleotide polymorphism array analysis and gene expression profiling
Genome-wide detection of copy number alteration (CNV) and loss of heterozygosity (LOH) were available in 13 of the 17 WM cases using the Genome-Wide Human SNP Array 6.0 (Affymetrix) [20]. It allows precise delineation
of the location and size of submicroscopic chromosomal defects, copy-neutral LOH and germline CNVs.
Gene expression profiling (GEP) was performed using U133 Plus 2.0 arrays (Affymetrix, USA), that analyzed over 47,000 transcripts. The RNA integrity was assessed using 2100 Bioanalyzer (Agilent, CA, USA). Expression data were normalized using the Robust Multi-array Average (RMA) algorithm. We performed differential analysis on a first series of 11 patients (5 A-WM and 6 S-WM) calculated with the ‘metaMA’ [22] R package (with the ‘limma’ option) in order to establish a gene expression profile. We then used a supervised classification to distinguish A-WM from S-WM as previously described [23]. Therewith, we validated this profile on an independent set of 6 patients (3 A-WM and 3 S-WM). We then performed a pathway analysis using Ingenuity Pathways Analysis® (Ingenuity Systems, CA, USA).
Other statistical analyses
Statistical associations were assessed using Chi2 and Fisher exact tests. Pairwise comparisons were performed by Mann-Whitney test or Student’s t-test. Overall survival was defined as the time between diagnosis and death or the last follow-up. Statistics were achieved using SPSS 15.0.
Table 1: Characteristics of the patients which samples were used in this study
Patient Age* / sex mutation Clinical statusMYD88 Criteria of symptomatic disease M-comp at time of GEP (g/L) profileGEP 6q deletion / BACH2 deletion†
3 63/F + A-MW NA 30 A no / no
5 76/F + A-MW NA 11 A yes / yes
7 83/M + A-MW NA 37 A (ivs) uk
9 61/M + A-MW NA 15 A yes / no
25 63/F − A-MW NA 26 A (ivs) yes / no
28 63/F + A-MW NA 19 A no / no
30 68/F − A-MW NA 6 A (ivs) no / no
31 64/M + A-MW NA 20 A yes / no
1 81/M + S-MW Autoimmune hemolytic anemia 26 S (ivs) no / no 2 70/F + S-MW Central anemia 37 S yes / yes 4 69/M + S-MW Central anemia 52 S yes / yes 6 62/F − S-MW Central anemia 49 S yes / no 8 73/F + S-MW Central anemia 50 A (ivs) uk
12 86/M + S-MW Adenopathies 23 S no / no
18 66/M + S-MW Central anemia and cryoglobulinemia 19 S (ivs) uk
20 65/M + S-MW Pancytopenia 12 S no / no
27 78/M + S-MW Central anemia 25 S yes / yes
Abbreviations: M: male, F: female, A-WM: asymptomatic WM, S-WM: symptomatic WM, ivs: independent validation set, uk: unknown, M-comp: monoclonal-component.
ACKNOWLEDGMENTS
We would like to thank the patients included in this study.
CONFLICTS OF INTEREST
No conflicts of interest.
GRANT SUPPORT
This work was supported by the Fondation ARC pour la Recherche sur le Cancer and by La Ligue contre le Cancer.
C Herbaux has done the project as part of a master degree salary paid by Faculté de Médecine Lille2.
REFERENCES
1. Vijay A, Gertz MA. Waldenström macroglobulinemia. Blood. 2007; 109:5096–103.
2. Gobbi PG, Baldini L, Broglia C, Goldaniga M, Comelli M, Morel P, Morra E, Cortelazzo S, Bettini R, Merlini G. Prognostic validation of the international classification of immunoglobulin M gammopathies: a survival advantage for patients with immunoglobulin M monoclonal gammopathy of undetermined significance? Clin Cancer Res. 2005; 11:1786–90.
3. Kyle RA, Benson JT, Larson DR, Therneau TM, Dispenzieri A, Kumar S, Melton LJ 3rd, Rajkumar SV. Progression in smoldering Waldenstrom macroglobulinemia: long-term results. Blood. 2012; 119:4462–6.
4. Kyle RA, Treon SP, Alexanian R, Barlogie B, Björkholm M, Dhodapkar M, Lister TA, Merlini G, Morel P, Stone M, Branagan AR, Leblond V. Prognostic markers and criteria to initiate therapy in Waldenstrom’s macroglobulinemia: consensus panel recommendations from the Second International Workshop on Waldenstrom’s Macroglobulinemia. Semin Oncol. 2003; 30:116–20. 5. Decaux O, Lodé L, Magrangeas F, Charbonnel C, Gouraud W,
Jézéquel P, Attal M, Harousseau J-L, Moreau P, Bataille R, Campion L, Avet-Loiseau H, Minvielle S. Prediction of survival in multiple myeloma based on gene expression profiles reveals cell cycle and chromosomal instability signatures in high-risk patients and hyperdiploid signatures in low-risk patients: a study of the Intergroupe Francophone du Myélome. J Clin Oncol. 2008; 26:4798–805.
6. Broyl A, Hose D, Lokhorst H, de Knegt Y, Peeters J, Jauch A, Bertsch U, Buijs A, Stevens-Kroef M, Beverloo HB, Vellenga E, Zweegman S, Kersten M-J, et al. Gene expression profiling for molecular classification of multiple myeloma in newly diagnosed patients. Blood. 2010; 116:2543–53.
7. Glas AM, Kersten MJ, Delahaye LJMJ, Witteveen AT, Kibbelaar RE, Velds A, Wessels LFA, Joosten P, Kerkhoven RM, Bernards R, van Krieken JHJM, Kluin PM, van’t Veer LJ, et al. Gene expression profiling in follicular lymphoma to assess clinical aggressiveness and to guide the choice of treatment. Blood. 2005; 105:301–7.
8. Sasaki S, Ito E, Toki T, Maekawa T, Kanezaki R, Umenai T, Muto A, Nagai H, Kinoshita T, Yamamoto M, Inazawa J, Taketo MM, Nakahata T, et al. Cloning and expression of human B cell-specific transcription factor BACH2 mapped to chromosome 6q15. Oncogene. 2000; 19:3739–49. 9. Steimle V, Otten LA, Zufferey M, Mach B.
Complementation cloning of an MHC class II transactivator mutated in hereditary MHC class II deficiency (or bare lymphocyte syndrome). Cell. 1993; 75:135–46.
10. Leleu X, Jia X, Runnels J, Ngo HT, Moreau A-S, Farag M, Spencer JA, Pitsillides CM, Hatjiharissi E, Roccaro A, O’Sullivan G, McMillin DW, Moreno D, et al. The Akt pathway regulates survival and homing in Waldenstrom macroglobulinemia. Blood. 2007; 110:4417–26.
11. Brender C, Lovato P, Sommer VH, Woetmann A, Mathiesen A-M, Geisler C, Wasik M, Ødum N. Constitutive SOCS-3 expression protects T-cell lymphoma against growth inhibition by IFNalpha. Leukemia. 2005; 19:209–13. 12. Bock O, Hussein K, Brakensiek K, Buhr T, Schlué J, Wiese B,
Kreipe H. The suppressor of cytokine signalling-1 (SOCS-1) gene is overexpressed in Philadelphia chromosome negative chronic myeloproliferative disorders. Leukemia Research. 2007; 31:799–803.
13. Muto A, Hoshino H, Madisen L, Yanai N, Obinata M, Karasuyama H, Hayashi N, Nakauchi H, Yamamoto M, Groudine M, Igarashi K. Identification of Bach2 as a B-cell-specific partner for small maf proteins that negatively regulate the immunoglobulin heavy chain gene 3’ enhancer. EMBO J. 1998; 17:5734–43.
14. Muto A, Tashiro S, Nakajima O, Hoshino H, Takahashi S, Sakoda E, Ikebe D, Yamamoto M, Igarashi K. The transcriptional programme of antibody class switching involves the repressor Bach2. Nature. 2004; 429:566–71.
15. Swaminathan S, Huang C, Geng H, Chen Z, Harvey R, Kang H, Ng C, Titz B, Hurtz C, Sadiyah MF, Nowak D, Thoennissen GB, Rand V, et al. BACH2 mediates negative selection and p53-dependent tumor suppression at the pre-B cell receptor checkpoint. Nat Med. 2013; 19:101–22. 16. Swaminathan S, Duy C, Müschen M. BACH2-BCL6
balance regulates selection at the pre-B cell receptor checkpoint. Trends Immunol. 2014; 35:131–7.
17. Muto A, Tashiro S, Tsuchiya H, Kume A, Kanno M, Ito E, Yamamoto M, Igarashi K. Activation of Maf/AP-1 repressor Bach2 by oxidative stress promotes apoptosis and its interaction with promyelocytic leukemia nuclear bodies. J Biol Chem. 2002; 277:20724–33.
18. Gutiérrez NC, Ocio EM, de Las Rivas J, Maiso P, Delgado M, Fermiñán E, Arcos MJ, Sánchez ML, Hernández JM, San Miguel JF. Gene expression profiling of B lymphocytes and plasma cells from Waldenström’s macroglobulinemia: comparison with expression patterns of the same cell counterparts from chronic lymphocytic leukemia, multiple myeloma and normal individuals. Leukemia. 2007; 21: 541–9.
19. Paiva B, Corchete LA, Vidriales M-B, García-Sanz R, Perez JJ, Aires-Mejia I, Sanchez M-L, Barcena P, Alignani D, Jimenez C, Sarasquete M-E, Mateos M-V, Ocio EM, et al. The cellular origin and malignant transformation of Waldenström’s macroglobulinemia. Blood. 2015; 125:2370–80. doi: 10.1182/blood-2014-09-602565. 20. Poulain S, Roumier C, Galiègue-Zouitina S, Daudignon A,
Herbaux C, Aiijou R, Lainelle A, Broucqsault N, Bertrand E, Manier S, Renneville A, Soenen V, Tricot S, et al. Genome wide SNP array identified multiple mechanisms of genetic changes in Waldenstrom macroglobulinemia. Am J Hematol. 2013; 88:948–54.
21. Ditzel Santos D, Ho AW, Tournilhac O, Hatjiharissi E, Leleu X, Xu L, Tassone P, Neri P, Hunter ZR, Chemaly MAZ, Branagan AR, Manning RJ, Patterson CJ, et al Establishment of BCWM.1 cell line for Waldenström’s macroglobulinemia with productive in vivo engraftment in SCID-hu mice. Exp Hematol. 2007; 35:1366–75.
22. Marot G, Foulley J-L, Mayer C-D, Jaffrézic F. Moderated effect size and P-value combinations for microarray meta-analyses. Bioinformatics. 2009; 25:2692–9.
23. van ’t Veer LJ, Dai H, van de Vijver MJ, He YD, Hart AAM, Mao M, Peterse HL, van der Kooy K, Marton MJ, Witteveen AT, Schreiber GJ, Kerkhoven RM, Roberts C, et al. Gene expression profiling predicts clinical outcome of breast cancer. Nature. 2002; 415:530–6.