HAL Id: insu-01382390
https://hal-insu.archives-ouvertes.fr/insu-01382390
Submitted on 17 Oct 2016
HAL is a multi-disciplinary open access
archive for the deposit and dissemination of
sci-entific research documents, whether they are
pub-lished or not. The documents may come from
teaching and research institutions in France or
abroad, or from public or private research centers.
L’archive ouverte pluridisciplinaire HAL, est
destinée au dépôt et à la diffusion de documents
scientifiques de niveau recherche, publiés ou non,
émanant des établissements d’enseignement et de
recherche français ou étrangers, des laboratoires
publics ou privés.
margin of Tibet: Constraints from the Tarim basin
sedimentary record
Tamsin Blayney, Yani Najman, Guillaume Dupont-Nivet, Andrew Carter, Ian
Millar, Eduardo Garzanti, Edward Sobel, Martin Rittner, Sergio Andò,
Zhaojie Guo, et al.
To cite this version:
Tamsin Blayney, Yani Najman, Guillaume Dupont-Nivet, Andrew Carter, Ian Millar, et al..
Indenta-tion of the Pamirs with respect to the northern margin of Tibet: Constraints from the Tarim basin
sedimentary record. Tectonics, American Geophysical Union (AGU), 2016, 35 (10), pp.2345-2369
�10.1002/2016TC004222�. �insu-01382390�
Indentation of the Pamirs with respect to the northern
margin of Tibet: Constraints from the Tarim
basin sedimentary record
Tamsin Blayney1, Yani Najman1, Guillaume Dupont-Nivet2,3,4, Andrew Carter5, Ian Millar6, Eduardo Garzanti7, Edward R. Sobel3, Martin Rittner8, Sergio Andò7, Zhaojie Guo4, and Giovanni Vezzoli7
1
Lancaster Environment Centre, Lancaster University, Bailrigg, UK,2Géosciences Rennes, UMR-CNRS 6118, Université de Rennes 1, Rennes, France,3Institut für Erd- und Umweltwissenschaften, Universitaet Potsdam, Potsdam, Germany,4Key
Laboratory of Orogenic Belts and Crustal Evolution, Ministry of Education, Beijing, China,5Department of Earth and Planetary Sciences, Birkbeck College, London, UK,6NERC Isotope Geosciences Laboratory, BGS Keyworth, Nottingham,
UK,7Laboratorio di Petrografia del Sedimentario, Dipartimento di Scienze Geologiche e Geotecnologie, Università di Milano-Bicocca, Milano, Italy,8London Geochronology Centre, Department of Earth Sciences, University College London,
London, UK
Abstract
The Pamirs represent the indented westward continuation of the northern margin of the Tibetan Plateau, dividing the Tarim and Tajik basins. Their evolution may be a key factor influencing aridification of the Asian interior, yet the tectonics of the Pamir Salient are poorly understood. We present a provenance study of the Aertashi section, a Paleogene to late Neogene clastic succession deposited in the Tarim basin to the north of the NW margin of Tibet (the West Kunlun) and to the east of the Pamirs. Our detrital zircon U-Pb ages coupled with zirconfission track, bulk rock Sm-Nd, and petrography data document changes in contributing source terranes during the Oligocene to Miocene, which can be correlated to regional tectonics. We propose a model for the evolution of the Pamir and West Kunlun (WKL), in which the WKL formed topography since at least ~200 Ma. By ~25 Ma, movement along the Pamir-bounding faults such as the Kashgar-Yecheng Transfer System had commenced, marking the onset of Pamir indentation into the Tarim-Tajik basin. This is coincident with basinward expansion of the northern WKL margin, which changed the palaeodrainage pattern within the Kunlun, progressively cutting off the more southerly WKL sources from the Tarim basin. An abrupt change in the provenance and facies of sediments at Aertashi has a maximum age of 14 Ma; this change records when the Pamir indenter had propagated sufficiently far north that the North Pamir was now located proximal to the Aertashi region.1. Introduction
Although the Pamir is an archetype of intracontinental collision and the region’s topographic evolution likely played a key role in controlling regional climate, our understanding of the detailed tectonic history remains poorly constrained. The region (Figure 1), an indented continuation of the north-west margin of the Tibetan Plateau, consists of a number of terranes which amalgamated as the Tethys closed, culminating in the India-Asia collision most commonly quoted at ~60–50 Ma [DeCelles et al., 2014; Hu et al., 2015; Najman et al., 2010; Rowley, 1996; Wu et al., 2014]. Although topography existed in both the Pamirs and Tibet prior to the India-Asia collision [e.g., Cao et al., 2015; Kapp et al., 2007; Murphy et al., 1997; Robinson et al., 2004; Royden et al., 2008; Schwab et al., 2004; Volkmer et al., 2007], it is thisfinal collision, associated with the evolution of the Himalayan orogen, that resulted in the indentation of the Pamirs into the Tajik-Tarim basin to the north [e.g., Burtman and Molnar, 1993] and significant uplift of Tibet [e.g., Harrison et al., 1992].
The Pamir terranes (Figure 1a) are an along-strike continuation of Tibetan terranes [Burtman and Molnar, 1993; Robinson et al., 2012; Schwab et al., 2004; Tapponnier et al., 1981; Yin and Harrison, 2000] that have been subjected to a higher degree of crustal shortening and metamorphism, and deeper exhumation, relative to the equivalent terrains in Tibet. Intracontinental subduction occurred along the south dipping Alai subduc-tion zone [e.g., Burtman and Molnar, 1993; Fan et al., 1994] with the Main Pamir Thrust and Pamir Frontal Thrusts forming the updip expression of this subduction zone [Arrowsmith and Strecker, 1999; Burtman and Molnar, 1993; Coutand et al., 2002; Hamburger et al., 1992; Sobel et al., 2013].
Tectonics
RESEARCH ARTICLE
10.1002/2016TC004222
Key Points:
• Prior to Pamir indentation, the West Kunlun (WKL) mountain range already formed topographic relief
• Pamir indentation commenced at ~25 Ma with activation of the Kashgar-Yecheng Transfer System and Tiklik Fault
• It was no sooner than 14 Ma that the Pamir range had indented≈200 km northward with the modern day Yarkand drainage occurring after 11 Ma Supporting Information: • Supporting Information S1 • Data Set S1 • Data Set S2 • Data Set S3 • Data Set S4 • Data Set S5 • Data Set S6 Correspondence to: T. Blayney, t.blayney1@lancs.ac.uk Citation:
Blayney, T., et al. (2016), Indentation of the Pamirs with respect to the northern margin of Tibet: Constraints from the Tarim basin sedimentary record, Tectonics, 35, doi:10.1002/ 2016TC004222. Received 21 DEC 2015 Accepted 2 SEP 2016
Accepted article online 9 SEP 2016
©2016. The Authors.
This is an open access article under the terms of the Creative Commons Attribution License, which permits use, distribution and reproduction in any medium, provided the original work is properly cited.
Figure 1. (a) The major terrains of the Pamir and West Kunlun in NW Tibet after Robinson et al. [2012]. (b) The geology of the region after Bershaw et al. [2012] and Cao et al. [2015]. Modern river sample locations shown as yellow dots, sedimentary section located at“Aertashi.” TS = Tanymas suture, RPS = Rushan-Pshart suture, WTBZ = Wakhan-Tirich boundary zone, SS = Shyok suture, JS = Jinsha suture, KS = Kunlun suture, KUS = Kudi suture, MPT = Main Pamir Thrust, KYTS = Kashgar-Yecheng transfer system, SYF = Sache-Yangdaman fault.
When and how the northern margin of Tibet evolved and the Pamir range indented and uplifted are poorly documented. Models have been proposed for a northward propagation of deformation across the Tibetan Plateau [Tapponnier et al., 2001], while there is also evidence that the northern margin of Tibet was deforming soon after India-Asia collision, by middle-late Eocene times [e.g., Clark et al., 2010; Yuan et al., 2013; Staisch et al., 2016]. However, that research mostly relates to the more north-eastern regions of Tibet and little has been published on the northwest margin. Significant work includes the seminal work of Burtman and Molnar [1993], who synthesized the Cenozoic geodynamic framework; Ducea et al. [2003], who considered that crustal thickening during the early stages of India-Asia collision resulted in a low relief elevated plateau since early Cenozoic; Yin et al. [2002], who similarly proposed earliest Cenozoic crustal thickening for the WKL; Sobel and Dumitru [1997], who recorded evidence for late Oligocene exhumation in the WKL; Amidon and Hynek [2010], who recorded two periods of accelerated exhumation in the middle Eocene and early Miocene; and Schurr et al. [2014], who quantified recent and active deformation.
The onset of Pamir indentation relative to Tibet has been constrained as ~25–20 Ma [Burtman and Molnar, 1993; Sobel and Dumitru, 1997; Cowgill, 2010; Bande et al., 2015], as discussed in more detail in section 2.1. The evolution of both the Pamirs and the Tibetan Plateau has been suggested to drive regional as well as global climate change [e.g., Bosboom et al., 2011, 2014c; Ruddiman and Kutzbach, 1989; Zhang et al., 2007]. Uplift of Tibet resulted in intensification of the monsoon and changes in atmospheric circulation patterns [Molnar et al., 2010, and references therein]. The evolution of the Pamirs resulted in the removal of a major moisture source in Asia: prior to the India-Asia collision, the Tarim Seafilled the broad east-west trending Tarim basin that extended across the location of the modern Pamir and into the Tajik depression [e.g., Bosboom et al., 2015; Mao and Norris, 1988]. During the Eocene, this sea retreated west from the basin, remov-ing a major source of moisture, thus contributremov-ing to the aridification of Asia [Ramstein et al., 1997; Zhang et al., 2007] and the development of one of the largest sand seas in the world; dust from this desert contributes substantially to the global aerosol system that modulates global climate [Uno et al., 2009; Zheng et al., 2015a]. Proposed mechanisms that caused this sea retreat range from Pamir indentation, overthrusting, and associated sedimentary overfilling [Burtman and Molnar, 1993; Burtman, 2000; Coutand et al., 2002] to a eustatic regression [Dupont-Nivet et al., 2007; Sobel and Dumitru, 1997] or a combination of the two [Bosboom et al., 2011, 2014b].
This paper elucidates the evolution of this region, particularly the indentation history of the Pamirs, from a study of material deposited in the Tarim basin to the north of the NW margin of Tibet and to the east of the Pamirs (Figure 1). We interpret our new provenance data from the Cenozoic Aertashi sedimentary section in terms of an evolving source area and the controlling tectonics which effected the changes we document.
2. Geological Background
To constrain the evolution of the NW margin of Tibet and the Eastern Pamir, we focus our study on the long-est and blong-est dated Cenozoic stratigraphic record in the SW Tarim basin. The Aertashi sedimentary section (Figure 1) is located adjacent to the eastern side of the Pamirs, to the north of the northern margin of Tibet, and at the western edge of the Tarim basin.
2.1. The Pamir
The Pamir mountain range forms a prominent indenter separating the Tarim and Tajik basins and has a com-plex and debated formation history; intracontinental subduction, lower crustal delamination, slab rollback, subduction erosion, subduction accretion, and a marginal slab-tear have all been discussed [e.g., Burtman and Molnar, 1993; Hamburger et al., 1992; Negredo et al., 2007; Replumaz et al., 2010; Sippl et al., 2013; Sobel et al., 2013].
Prior to indentation, the Pamir is thought to have had a relatively straight east-west trending northern margin aligned with the West Kunlun (WKL) and the northern margin of Tibet (Figure 1), forming the western conti-nuation of these accreted terranes [Burtman and Molnar, 1993; Robinson et al., 2004; Schwab et al., 2004]. Formation of the Pamir indenter may have resulted from the interaction of distributed shortening across the India-Asia collision zone with lateral heterogeneities in the Asian crust such as the Tarim basin [England and Houseman, 1985]. The Pamir’s characteristic curvature has been attributed to oroclinal bending [Yin et al., 2001], radial thrusting [Robinson et al., 2004], a hybrid model involving north-west radial thrusting
with anticlockwise rotation at the western margin and transpressional right-slip transfer faulting at the east-ern margin [Cowgill, 2010], or a consequence of northward rollback of the subducting slab [Sobel et al., 2013]. The Pamir region can be subdivided into three main terranes (Figure 1a) separated by major sutures, which sequentially collided during progressive closure of the Tethyan Ocean [Burtman and Molnar, 1993; Robinson et al., 2012; Schwab et al., 2004]. The North Pamir, bound by the Main Pamir Thrust (MPT) in the north and the Tanymas suture in the south, is composed of predominantly Palaeozoic, and Triassic (meta)sedimentary and metavolcanic rocks intruded by Triassic-Jurassic granitoids (Figure 1b) [Schmidt et al., 2011; Schwab et al., 2004].
The Central Pamir is bound by the Tanymas suture to the north and the Rushan-Pshart zone to the south. It consists of Palaeozoic and Triassic-Jurassic (meta)sedimentary rocks [Schwab et al., 2004] and gneiss domes of various protolith types and ages, including the Muztagh Ata dome, which were metamorphosed and exhumed during the Cenozoic [Robinson et al., 2007; Schmidt et al., 2011; Schwab et al., 2004; Stearns et al., 2015].
The South Pamirs, bounded by the Rushan-Pshart suture zone to the north and the Wakhan-Tirich Boundary zone (possibly equivalent to the Bangong Nujiang suture [Robinson, 2015]) to the south, are composed of Palaeozoic, Triassic, and Jurassic (meta)sedimentary rocks, which have been affected by Cretaceous and Cenozoic magmatism and metamorphism [Schwab et al., 2004]. It contains the giant Shakhdara dome of Cretaceous and older protolith, metamorphosed and exhumed during domal formation in the Cenozoic [Stübner et al., 2013]. In the eastern Pamir, horsetails splaying from the northern termination of the Karakoram strike-slip Fault (KKF) delineate the boundary between the South and Central Pamirs (Figure 1a).
To the south of the Pamirs lie the Karakoram and the Kohistan-Ladakh arc (Figure 1), separated by the Shyok suture. The former consists of deep crustal metamorphics, Cretaceous and Cenozoic intrusives, and sedi-mentary rocks [e.g., Fraser et al., 2001]; the latter consists of a predominantly Cretaceous age oceanic island arc [e.g., Tahirkeli and Jan, 1979].
The Pamirs are suggested to have been translated ~300 km northward relative to the northern margin of Tibet [Burtman and Molnar, 1993] accommodated along the south dipping Alai subduction zone [Burtman and Molnar, 1993; Fan et al., 1994; Hamburger et al., 1992] with the Main Pamir Thrust (MPT) forming its updip projection [Burtman and Molnar, 1993; Hamburger et al., 1992; Roecker et al., 1980] (Figure 1a).
Northward motion of the Pamir salient is accommodated along the eastern and western margins by a series of strike-slip faults including on the western side of the Pamir Salient the sinistral Darvaz-Karakul fault system and on the eastern margin the Kashgar-Yecheng transfer system (KYTS) with an estimated offset of ~280 km [Cowgill, 2010; Sobel and Dumitru, 1997]. In turn, the KYTS transfers shortening to the north-vergent Tiklik Fault, which bounds the northern margin of the WKL [Cao et al., 2013, 2015].
Timing of movement on the KYTS, dated as having initiated by 20 Ma from apatitefission track (AFT) data [Sobel and Dumitru, 1997], provides one of the few constraints on the timing of Pamir indentation. Cowgill [2010] used the above data and combined it with previously published sedimentological and magnetostrati-graphic data from the Aertashi section [Yin et al., 2002] to further interpret the timing of movement. While the subsidence curves suggesting Eocene onset of motion have since been updated with magnetostratigraphi-cally refined depositional ages, which do not show acceleration of subsidence at this time [Bosboom et al., 2014b], Cowgill’s assertion of movement along the fault at 25–18 Ma, based on the AFT data and onset of conglomeratic facies, is in agreement with other researcher results.
More recently, Bande et al. [2015] proposed that movement along both the buried Shache-Yangdaman right-slip Fault in the Tarim basin, and the Talas-Fergana Fault in the Tienshan (see section 2.3), dated around ~25 Ma as well as late Cenozoic counterclockwise vertical axis rotations of the Fergana Basin to the north of the Pamirs, is related to Pamir indentation. Furthermore, Tang et al. [2015] used anisotropy of magnetic susceptibility data to record an increase in strain in basin sediments at 26 Ma, which they related to the onset of Pamir indentation. Dating of indentation in the late Oligocene-early Miocene is broadly consistent with the time at which contours of isopach maps for Tarim basin sediments show truncation against the Pamirs [Wei et al., 2013], taking into account the large uncertainties in formation ages at this regional scale.
The dextral Karakorum fault (KKF) is associated with intra-Pamir shortening. Active since 16–13 Ma [e.g., Phillips and Searle, 2007; Phillips et al., 2004] or ~24 Ma [e.g., Lacassin et al., 2004; Valli et al., 2008], the northern end of the KKF terminates in horsetail splays, which bound some of the Central Pamir gneiss domes [Schurr et al., 2014; Strecker et al., 1995]. Most of these domes experienced N-S extensional exhumation from ~20 to ~16 Ma; this was succeeded by renewed N-S contractional deformation [e.g., Stearns et al., 2015].
2.2. The West Kunlun Mountain Range (WKL)
The WKL forms the northern margin of the western Tibetan Plateau, extending into the south-eastern Pamirs; we refer to the latter as the Pamir Kunlun (Figure 1). Prior to the India-Asia collision, the WKL evolved as part of a sequence of terranes accreted onto the southern margin of Asia during the Palaeozoic-Mesozoic as a result of closure of the Paleotethys [Matte et al., 1996; Robinson et al., 2012; Xiao et al., 2002; Yin and Harrison, 2000]. The West Kunlun mountain range consists of the North Kunlun; South Kunlun, our regionally defined Pamir Kunlun; and the Songpan-Ganzi and Tianshuihai terranes (Figure 1a).
As illustrated in Figure 1b, the North and South Kunlun consist predominantly of Precambrian-Palaeozoic metasedimentary rocks, and plutons of Palaeozoic and, at its western extent adjacent to the Pamir Kunlun, Triassic age [Cowgill et al., 2003; Liu et al., 2015; Schwab et al., 2004; Xiao et al., 2003; Xiao et al., 2002; Youngun and Hsü, 1994]. The Songpan-Ganzi terrane consists of Triassic and Jurassic plutons, and Triassic (meta)sedimentary rocks [Yin and Harrison, 2000], while the Tianshuihai terrane consists predominantly of Triassic-Cretaceous (meta)sedimentary rocks overlying a Palaeozoic basement [Cowgill et al., 2003; Liu et al., 2015; Matte et al., 1996; Robinson et al., 2012; Schwab et al., 2004]. The Pamir Kunlun is composed of Precambrian and Palaeozoic (meta)sediments, a large areal extent of Palaeozoic plutons, as well as Triassic intrusions.
Cao et al. [2015] suggest that the WKL had emerged above sea level by Triassic-Early Jurassic times, supported by the presence of well-developed Triassic to Lower Jurassic magmatism; Matte et al. [1996] sug-gested that these resulted from north dipping subduction of the Paleotethyan lithosphere under the Kunlun at this time. Crustal thickening along the WKL northern margin began at>46 Ma according to Yin et al. [2002]. Thrusting along the northern margin of the Kunlun was considered to have initiated at ~26–23 Ma by Jiang et al. [2013], Jiang and Li [2014], and Cao et al. [2015]; 25–20 Ma by Sobel and Dumitru [1997]; and 20 Ma by Wang et al. [2003] and Matte et al. [1996], while Jin et al. [2003], Liu et al. [2010], and Zheng et al. [2000, 2010] consider that the main phase of uplift occurred in the Pliocene.
2.3. The Western Tarim Basin
The Tarim basin today forms a large intracontinental basin, which preserves a stratigraphic record spanning the Late Proterozoic through the Cenozoic [e.g., Tian et al., 1989]. During the Late Cretaceous through Eocene, the SW Tarim basin hosted a series of shallow marine transgressions and regressions [Bosboom et al., 2011, 2014b, Tang et al., 1989, Lan and Wei, 1995; Burtman et al., 1996; Burtman, 2000]. Surrounding the basin are a series of ranges that have been deformed by the successive accretion of continental terranes, which started during the Permian and ended at the Indo-Asia collision [Hendrix et al., 1992; Jia et al., 2004; Robinson et al., 2003; Yin and Harrison, 2000]. The basin has been overthrust by the Tien Shan in the north, the Pamirs in the west, and the Kunlun and the Tibetan Plateau in the south [e.g., Burtman and Molnar, 1993; Cowgill, 2010; Jia, 1997; Yin and Harrison, 2000]. However, the Tarim basin itself has remained relatively undeformed [e.g., Zheng et al., 2000]. In the south-western region of the basin, where our study is located, it is separated from the WKL hinterland by the Tiklik Thrust and Kashgar-Yecheng Transfer system (KYTS) (Figure 1).
Cenozoic depositional units of the western Tarim basin include the Palaeogene Kashi Group, composed of the Aertashi, Qimugen, Kalatar, Wulagen, and Bashibulake Formations. These formations are predominantly composed of marine facies [Tang et al., 1989], which record a series of marine transgressions-regressions [e.g., Bosboom et al., 2011; Lan and Wei, 1995; Tang et al., 1989]. Following thefinal retreat of this sea, terrestrial red clastic units named the Wuqia Group were deposited, composed of the Keziluoyi, Anjuan, and Pakabulake Formations. These mainly consist offluvial facies siltstones and mudstones in the lower portion [e.g., Jia et al., 2004; Bosboom et al., 2011] with the upper Wuqia Group and overlying Artushi and Xiyu Formations domi-nated byfluvial and alluvial fan facies sandstones, gravels, and conglomerates (Yin et al. [2002], Zheng et al. [2006], Zheng et al. [2010], Zheng et al. [2015a], and this study). Basinward thrusting by the WKL, from ~26 or
~23 Ma [Cao et al., 2015; Jiang and Li, 2014; Jiang et al., 2013] has resulted in weak deformation of these sediments.
The NW-SE trending Shache-Yangdaman right-slip Fault (SYF) lies in the subsurface of the western Tarim basin [Wei et al., 2013]. This structure was active syndepositionally with the Wuqia Group and Xiyu Formation. Facies analysis and isopach patterns suggest that a 6 km thick transtensional basin (the Yecheng subbasin) formed between the SYF and the dextral-slip KYTS. This fault possibly connects to the dextral Talas-Fergana Fault (TFF) to the northwest, which experienced significant slip during the late Oligocene-middle Miocene [Bande et al., 2015].
3. Previous Isotopic Provenance Studies on the Western Tarim
Sedimentary Records
Isotopic provenance studies in the western Tarim basin relevant to this research have been carried out in the Oytag and Qimugen sections east of the Pamirs and the Kekeya and Sanju sections north of the NW Tibetan margin (Figure 1). Isotopic provenance studies in the Tien Shan and the rest of the western Tarim basin have also been carried out [e.g., Yang et al., 2014] but are not discussed further here as these areas do not contri-bute to sedimentation of the Aertashi section.
The Oytag (Wuyitake) sedimentary section is located near the Main Pamir Thrust. Today, the Gez River cuts across this outcrop belt, draining the North Pamir. The Oytag section spans the Jurassic-Neogene [Bershaw et al., 2012; Sobel and Dumitru, 1997, and references therein; Sun and Jiang, 2013]. The recent Paleogene chronology proposed by Sun and Jiang [2013] should be considered with caution because it implies marine sediment depositional ages that are at odds with the rich marine biostratigraphic assemblages recorded in this and other sections (see reviews in Bosboom et al. [2014b, 2014d]). Located south of the Oytag section is the Qimugen section (Figure 1). Today Qimugen is part of a drainage system which drains the North Pamir and Pamir Kunlun. The majority of the section on which isotopic provenance analyses have been undertaken is dated at <18 Ma on the basis of detrital zircons [Cao et al., 2014]. Further southeast, along the south-western edge of the basin, lie the Eocene to Mid-Miocene Kekeya and Early to Mid-Miocene Sanju sections [Cao et al., 2015]. These sections lie along rivers that drain the North and South Kunlun terranes.
3.1. Oytag Section
This section was studied by Bershaw et al. [2012] along the Oytag River without the use of magnetostrati-graphic dating. Later application of magnetostratimagnetostrati-graphic dating to the parallel section exposed along the Gez River [Sun and Jiang, 2013] led those authors to reinterpret Bershaw’s data in light of their new age con-straints. A more comprehensive provenance data set has since been produced by Sun et al. [2016], although we note the uncertainty in the age of this section, as summarized above.
Palaeocurrent data show a consistent direction toward the NE throughout the section [Bershaw et al., 2012], and according to Chen et al. [1992], there is little tectonic rotation.
We confine our summary of data in the Oytag section to the age range comparable with that part of the Aertashi section on which this research focusses. Noting that the magnetostratigraphic ages of Sun and Jiang [2013] should be used with caution, a provenance change is documented sometime in the interval they date between ~34 Ma and ~26 Ma [Sun et al., 2016]. Samples dated at 34 Ma and 40 Ma have distinctive zircon U-Pb age peaks at ~200–300 Ma and ~400–500 Ma and an appreciable proportion of grains at >500–1000 Ma and>1600 Ma. Rare Late Cretaceous and Paleogene grains are also recorded. By contrast, the sample dated at ~26 Ma does not contain any Paleogene grains, and there is no distinct peak at 400–500 Ma. The prove-nance change is also mirrored by bulk rock Sm-Nd data, which show an evolving upsection decrease to less negativeεNd(0) values through time. The proportion of metamorphic lithic fragments as determined from petrography also increases over this time interval. Sun et al. [2016] interpreted these results to indicate input into the lower part of the section, from the Karakoram and Kohistan arc south of the Pamirs (located on Figure 1), based on the presence of Cretaceous and Paleogene grains. Later absence of such grains upsection, they interpret as due to accelerated uplift of the Pamir-Kunlun terrane blocking the input from more distal terranes. By contrast, Bershaw et al. [2012] speculated that Paleogene grains were derived from a volcanic source from the Central or southeastern Pamir [Budanov et al., 1999].
3.2. Qimugen Section
Magnetostratigraphic dating has not been published for this section. The majority of the section over which isotopic provenance analyses have been carried out is dated by zircon U-Pb analyses at<18 Ma, and the uppermost sample analyzed for zircon U-Pb lies below the Xiyu Formation, with the youngest zircon dated at 19 Ma [Cao et al., 2014]. Palaeocurrents are broadly NE directed, with the exception of one south-easterly and one westerly directed data set in the lower Miocene. Clockwise rotations of 14.2 ± 11.5° in 41 to 40 Ma strata for the Qimugen section were observed by Bosboom et al. [2014a], indicating that true palaeocurrent direction lay more toward the north than north-east. Zircon populations show peaks at ~200–300 Ma, ~400–500 Ma, ~800–1000 Ma, and >1500 Ma. Sporadic occurrences of Cretaceous (~100 Ma) and Neogene (20 Ma) grains were also recorded throughout the section, interpreted by Cao et al. [2014] as indicating derivation from the southeast Pamir-Karakoram hinterland and transported by a palaeo-Yarkand River.
3.3. Sanju and Kekeya Sections
In the Sanju section, proposed to be dated between ~20 and ~9 Ma on the basis of magnetostratigraphy, palaeocurrent data are NNE directed throughout the section [Cao et al., 2015]. This is in keeping with a south-ern source that would be expected given the location of this section, located just north of the northsouth-ern Tibet margin, and distant from the Pamir indenter to the west. Throughout this section, Precambrian U-Pb zircon ages show populations at ~700–1200 Ma, ~1600–2100 Ma, and >2400 Ma. Prominent peaks at 400–500 Ma and ~200–300 Ma are also recorded, along with sporadic Cretaceous grains (~100 Ma), Paleogene grains, and Neogene grains as young as 11 Ma. Such an overall age distribution is very similar to that found in both the Songpan-Ganzi [Ding et al., 2013] and eastern North Pamir [Robinson et al., 2012]. Given the palaeocurrent directions, Cao et al. [2015] interpreted a Songpan-Ganzi source for these sediments. They did note the lack of coincidence between sporadic Cenozoic zircons found in the Sanju section but not so far recorded in the Songpan-Ganzi terrane, and they considered this mismatch to be the result of incomplete characterization of this terrane to date.
Double dating of zircon U-Pb with zirconfission track (ZFT) ages [Cao et al., 2015] indicates that the fission track ages reflect times of exhumation rather than magmatism. Three predominant fission track age populations were recorded: a Triassic-Early Jurassic (~250–170 Ma) population, a Palaeocene-early Miocene population (~60–21 Ma), and a middle Eocene-late Miocene (~39–7 Ma) population, along with a minor Early Cretaceous (~131–103 Ma) population. The data are taken to reflect that the northern margin of Tibet was above sea level and exhuming in the Mesozoic; exhumation was moderate during the Palaeogene, steady during the late Oligocene to early Miocene, and accelerated somewhat at ~15 Ma.
The Kekeya section shows near identical data over approximately the same time period, in terms of palaeo-currents [Zheng et al., 2010], and zircon U-Pb and FT data, and therefore was interpreted as also southerly derived [Cao et al., 2015]. The Kekeya section does differ from the Sanju section in its lack of Neogene zircons. However, the significance of this absence is debatable given the small number of such grains recorded at Sanju and the low number of samples (two) analyzed at Kekeya.
4. The Study Area: The Aertashi Section
The study area is located near the village of Aertashi east of the Pamirs (Figure 1), adjacent to the Yarkand River, which today predominantly drains the Central, and South Pamirs, including the Muztagh Ata dome and the WKL. The area forms part of the larger Yecheng subbasin, which has its depocenter near the town of Yecheng [Wei et al., 2013]. The Palaeogene-Neogene eastward dipping sediments are composed of the Palaeocene to Eocene marine Kashi Group, which here comprises the Aertashi, Qimugen, Kalatar, and Wulagen Formations (Figure 2a). These rocks record marine transgression-regression sequences preceding thefinal retreat of the Tarim sea [Bosboom et al., 2011]. Note that the marine Bashibulake Formation, which overlies the Wulagen Formation in north-western Tarim, is not present in this area [Bosboom et al., 2011]. Continental deposits overlie the Wulagen Formation in the Aertashi section. Some authors name these oldest continental deposits in the Aertashi section the Bashibulake Formation [Zheng et al., 2015a], while others name these rocks the Keziluoyi Formation [Bosboom et al., 2011]. Following the stratigraphy of Zheng et al. [2015a], these sediments are overlain by thickly bedded red sandstones and mudstones of the Oligocene to Lower Miocene continental Wuqia Group comprising the Keziluoyi, Anjuan, and Pakabulake Formations.
Figure 2. (a) A magnetostratigraphic timeline for the Aertashi section by Zheng et al. [2015a] and Bosboom et al. [2011]. (b) Sedimentary log [Bosboom et al., 2011] for the Upper Kashi Group and lower Wuqia Group with our sample locations and palaeocurrent data. (c) Sedimentary log of the Aertashi section from this study with sample locations and palaeocur-rents. Figures 2b and 2c are correlated to the timeline of Zheng et al. [2015a] using facies interpretations for the upper log C and previous magnetostratigraphic dating by Bosboom et al. [2011] for log B. Colors on the logs are added to highlight our correlation to the log of Zheng et al. [2015a] and follow the format of Zheng et al. [2015a] for consistency. Colors within our sedimentary section reflect the observed color changes for these sedimentary rocks.
These formations are interpreted to be composed offluvial, lacustrine, and delta facies. Overlying the Wuqia Group, Zheng et al. [2015a] describe thin conglomeratic deposits with sandstone and siltstone layers of the Artushi Formation as representing distal alluvial fan andfluvial deposits, respectively. An abrupt change in lithofacies is recorded in the overlying Xiyu Formation containing massive cobble conglomerates interpreted to be proximal alluvial fan deposits [Zheng et al., 2015a].
Previous work conducted by Bosboom et al. [2011, 2014b] on the lower part of the Aertashi section and Zheng et al. [2015a] for the Wuqia Group and Artushi and Xiyu Formations provided a revised magnetostratigraphic timeline for the section (Figure 2), which supersedes lower resolution work conducted by Yin et al. [2002]. The final marine regression in this section is dated as middle Eocene [Bosboom et al., 2011, 2014b], with the onset of continental deposition from ~41 Ma onward. The updated chronology provided by Zheng et al. [2015a] revises the age of the uppermost Artushi Formation as 15 Ma. The overlying Xiyu Formation was not magne-tostratigraphically dated, but a new maximum constraint to its age is derived from our new detrital zircon U-Pb ages of 14 Ma from samples near the base of the Xiyu Formation (section 6.4). Accordingly, the promi-nent onset of coarse conglomerates of the Xiyu Formation previously estimated at ~24 Ma by Yin et al. [2002] is now revised to be<14 Ma. Further age constraint within the Xiyu Formation is provided by a disputed ash layer, in which the youngest populations of biotites and zircons were dated at 11 Ma. This dates this horizon as either 11 Ma or<11 Ma depending on whether the horizon is interpreted as an ash layer [Zheng et al., 2015a, 2015b] or a heterolithic sediment layer [Sun et al., 2015]. Although the exact outcrop location was not published by the original authors, we estimated, based on succession thickness, that our uppermost sam-ple lies above this layer and is also therefore younger than 11 Ma. While we utilize the more conservative “younger than” 11 Ma age for our uppermost sample throughout our interpretations, we do note the pre-sence of fresh volcanic detritus in this sample (section 6.2). This indicated that the prepre-sence of penecontem-poraneous volcanics in the vicinity could support the proposal of an ash layer temporally and spatially close by, in agreement with the report of 10–12 Ma granite-syenite intrusions near Tashgorgan [Jiang et al., 2012; Robinson et al., 2007].
Yin et al. [2002] conducted petrographic analysis of the Wuqia Group in Aertashi. Overall, they recorded the section as mainly composed of feldspatho-litho-quartzose sandstones, dominated by monocrystalline quartz grains. They concluded that the Oligocene sandstones at Aertashi are similar to those of Middle Jurassic to Paleogene strata studied in Aertashi by Sobel [1999]. From this similarity they interpreted that the source region has not changed substantially since the Middle Jurassic. They interpreted significant changes observed above their measured section to indicate the initiation of a new thrust fault in the foreland after ~24 Ma. However, the revised chronology of this section indicates that this event likely occurred after ~14 Ma. Palaeoflow data based on flute casts [Bosboom et al., 2014b], and imbrication and ripples [Zheng et al., 2010], indicate thatflow was consistently from the south throughout the Eocene-Miocene with the exception of the upper Wuqia Group, where a change is recorded toflow from the west to northwest. However, the latter data set are based on cross-bed foreset orientations, which when not taken in 3-D can provide only apparent directions; this change in palaeocurrent direction was not observed in our data from this section, presented in section 6.1.
5. Approach, Sampling, and Methods
5.1. Sampling
Characterization of the terranes, which may have sourced the Aertashi section, namely, the WKL, North, Central, and South Pamir, and comparison of that signature with the rocks of the Aertashi section, is key to our provenance study. We undertook U-Pb analyses on detrital zircons from modern river sediments draining these terranes, in order to characterize their signature (see Figure 1 and Text S1 in the supporting informa-tion). The use of modern river sands for terrane characterization is preferable to using bedrock samples, as it provides a more representative average of a larger area. Rivers draining the Central Pamir were not easily accessible in China, and for this terrane we therefore used published data from the western (Tajik) Pamirs [Lukens et al., 2012] to characterize the source.
We collected samples from each unit in the Aertashi section, as identified by Zheng et al. [2015a], and con-structed a detailed sedimentary log (Figure 2c). By comparison with the equivalent log from Zheng et al.
[2015a] (Figure 2a), we were able to extrapolate the depositional ages of the Aertashi rocks. We were aided in this task by (a) the fact that, unsurprisingly, the main provenance changes we see at Aertashi occur at inter-vals where clear facies changes occur (e.g., the onset of conglomerate stringers), making it easy to accurately correlate times of provenance change to Zheng et al. [2015a] ages on their log, and (b) our own unpublished paleomagnetic data [Blayney et al., 2014], which agree with that of Zheng et al. [2015a]. The Xiyu conglomer-ates were not subject to magnetostratigraphic analysis in either Zheng et al. [2015a] or our studies. The top of the underlying unit is dated at 15 Ma by the magnetostratigraphy, and our sample from the base of the Xiyu conglomerates yielded zircons of 14 Ma U-Pb age, thus providing a maximum age constraint. Although Zheng et al. [2015a] did not provide location coordinates for their 11 Ma/<11 Ma disputed ash layer (see section 4), it is located at ~2300 m stratigraphic height above the base of the conglomerates. Our uppermost Xiyu sample (above our logged section) is located at ~3000 m stratigraphic height above the base of the conglomerates (as estimated approximately from application of trigonometry to dip data), and therefore, our uppermost sample is constrained at<11 Ma depositional age. All sample locations are given in Text S1.
By comparing our modern river U-Pb zircon data, representing the source region signatures, with the signa-ture from Aertashi rocks, we identified the provenance and changes upsection, aided by additional information, such as palaeocurrent data, Sm-Nd bulk geochemistry data, petrography, and heavy-mineral data. We also took two samples from the Yarkand River to provide the signature of the modern day Aertashi setting. Zircon fission track data were used to assess exhumation patterns, but unfortunately only the Keziluoyi Formation, Xiyu Formation, and Yarkand River sand yielded usable data, due to grain size issues. We double-dated these samples with U-Pb analyses to extract maximum provenance information. Analyses were carried out at a number of labs, and full methodologies are given in Data Set S1 in the support-ing information.
5.2. Petrography and Heavy-Mineral Analyses
Twelve bedrock samples from the Aertashi section and two modern river sands from the Yarkand River along with a single sample from a river draining the Muztagh Ata dome were analyzed. Petrographic analysis involved the counting of 400 points per sample following the Gazzi-Dickinson method [Ingersoll et al., 1984]. Heavy-mineral analysis involved the counting of 200 points of 63–355 μm size fraction transparent heavy minerals, obtained by dry sieving and heavy liquid separation. All analyses were carried out at the University of Milano-Bicocca, Italy; full methodologies are given in Data Set S1 [Garzanti and Vezzoli, 2003; Ingersoll et al., 1984, Andò and Garzanti, 2014, Andò et al., 2012; Galehouse, 1971; Garzanti and Andò, 2007; Garzanti et al., 2009; Hubert, 1962], and full data sets are given in Data Set S2.
5.3. Sm-Nd Bulk Analyses
Eleven mudstones from the Aertashi section and six modern river muds from the Yarkand, Muji, Tashkorgan, Muztagh Ata, Karakash, and Tiznip Rivers were powdered in an agate ball mill. They were then leached in dilute acetic acid to remove carbonate before spiking with149Sm-150Nd isotope tracers, followed by dissolu-tion and column chemistry following the method of Makishima and Nakamura [1997]. Analyses were carried out on a Thermo Scientific Triton mass spectrometer at the Natural Environment Research Council (NERC) Isotope Geoscience Laboratories. Nd isotope data are normalized to146Nd/144Nd = 0.7219. Fifteen analyses of the JND-i standard gave a value of 0.512106 ± 0.000005 (9.1 ppm, 1 sigma). All other standard and sample data are quoted relative to a value of 0.512115 for this standard. Seven analyses of La Jolla gave 0.511864 ± 0.000006 (11.5 ppm, 1 sigma). Full methodologies are given in Data Set S1; full data sets are given in Data Set S3.
5.4. Zircon U-Pb and Fission Track Analyses
Eight modern river sands draining the North Pamir, South Pamir, Muztagh Ata drainage, and WKL and ele-ven rocks from the Aertashi section were used for detrital zircon U-Pb analyses. Three of the samples on which detrital zircon U-Pb analyses were undertaken were also analyzed for zirconfission track analysis, all other samples having zircons unsuitable forfission track analyses due either to low yield or small grain size. Detrital zircon separation was performed following standard protocols. Heavy-mineral concentrates rich in zircon were mounted in araldite and polished for U-Pb analyses by laser ablation-inductively coupled plasma–mass spectrometry (ICP-MS). Handpicking was avoided as this can introduce bias. Zircons for ablation were selected independent of grain size by systematically scanning the grain mount.
Samples forfission track analysis were selected on the basis of zircon abundance and an adequate mean grain size. Multiple Teflon grain mounts were made to enable different etch times to capture grains of different age and/or uranium concentrations. Zircon U-Pb analyses andfission track analyses were under-taken by using the London Geochronology Centre facilities at University College London. U-Pb analyses, both for single-dated zircons and zircons doubled dated withfission track, were conducted by using a New Wave 193 nm excimer laser ablation system coupled to an Agilent 7700× quadrupole-based ICP-MS. Full analytical methods can be found in the Data Set S1 [Hurford, 1990, Black et al., 2003, Jochum et al., 2011; Sláma et al., 2008, Wiedenbeck et al., 2004], and more detailed descriptions of the zircon char-acteristics are provided in Data Set S7 [Hoskin and Black, 2000].
6. Results
6.1. Sedimentology and Palaeocurrent Data
Our sedimentological log recording conglomerates, sandstones, and mudstones (Figure 2) show the close correlation of our facies with that of Zheng et al. [2015a], as described in section 5. Particularly, useful for correlation was the unit of thin beds of conglomeratic stringers at 2050–2700 m upsection, and the onset of the major conglomeratic unit at 4050 m upsection. Clasts in the lower, thin conglomerate stringer facies are up to 5 cm in diameter, and of predominantly sedimentary origin, with a few isolated limestone clasts at the base of the unit which are up to 50 cm diameter. Basement and volcanic clasts were recorded in the upper, major conglomeratic unit, clasts of which were up to 30 cm diameter. We were unable to replicate the palaeocurrent data previously recorded by Zheng et al. [2010], as described in section 5. Reliable palaeo-current indicators, predominantlyflute marks, were measured throughout the section up to the base of the Xiyu conglomerates and have been restored to account for tectonic rotation in accord with the work of Bosboom et al. [2014a] and Blayney et al. [2014]. Bosboom et al. [2014a] recorded clockwise rotations of 21.6 ± 4.2° in 41 to 36 Ma strata for the Aertashi section and 17.1 ± 6.5° rotation recorded in 33 to 28 Ma strata. Blayney et al. [2014] recorded a 15° ± 4.3° clockwise rotation in 27–15 Ma strata.
A consistent NW directed palaeoflow is recorded throughout (Figure 2).
6.2. Petrography and Heavy-Mineral Data
The Aertashi succession displays a very sharp compositional trend from base to top. Quartz decreases pro-gressively upsection, while, conversely, feldspars, rock fragments, micas, and heavy minerals all propro-gressively increase. Selective diagenetic dissolution of the least chemically stable minerals partly contributed to this trend. Deep corrosion features and even skeletal outlines [Andò et al., 2012] were observed on garnets, staur-olite, and epidote. The transparent heavy-mineral concentration (tHMC) [Garzanti and Andò, 2007] increases upsection by nearly 2 orders of magnitude, and the proportion of stable heavy minerals zircon, tourmaline, and rutile (ZTR index) [Hubert, 1962] correspondingly decreases. Nevertheless, provenance signals are very clearly preserved (Figure 3).
From the base of the section until 15 Ma (petrologic intervals 1a–1c), rocks include litho-feldspatho-quartzose to feldspatho-litho-quartzose sandstones, yielding extremely low heavy-mineral assemblages including tour-maline, apatite, garnet, zircon, and rutile. Provenance trends are subtle in this lower part of the succession most affected by diagenetic dissolution. Petrologic interval 1c sandstones (i.e., from ~25 Ma, just below the lower conglomerate“stringers”) become more enriched in phyllite, schist, metasandstone, and dravitic tour-maline grains relative to the petrologic intervals 1a and 1b below, suggesting increasing supply from very low grade to low-grade metasedimentary rocks. An abrupt provenance change is documented in petrologic interval 2 (≤14 Ma, at the start of the major conglomerates), with a marked increase in very low to low-grade felsic to mafic metavolcanic rock fragments and epidote-dominated heavy-mineral suites. Such a metavolca-nic source was also present but much less prominent during the deposition of the underlying rocks, as testified by the constant presence of a few metavolcanic grains although epidote has been largely dissolved. Stratigraphically higher up the conglomeratic unit (petrologic interval 3,<11 Ma), significant input from penecontemporaneous volcanic sources are documented by quartzo-feldspato-lithic to quartzo-litho-feldspathic sandstones with mafic to intermediate volcanic rock fragments and frequently zoned plagioclase. Commonly fresh zoned green augitic clinopyroxene represents nearly a third of the sand fraction and is asso-ciated with apatite and minor titanite, hornblende, and oxy-hornblende.
Comparison with modernfluvial sands yields a poor match. Evidence of erosion from the hinterland gneiss domes was not recorded in any of the Aertashi sandstones, which are sharply distinct from the feldspatho-quartzose sand, with abundant granitoid rock fragments and rich hornblende-dominated suites, carried by the modern river draining Muztagh Ata. The Yarkand modern river sand also bears little similarity to any of the Aertashi section sandstones, having much more abundant carbonate rock fragments and no volcanic or metavolcanic rock fragments. Quartz is much more abundant in the Yarkand River samples compared to petrologic interval 3 and much less abundant than in petrologic intervals 1a–1c. Feldspars and meta-morphic indices [Garzanti and Vezzoli, 2003] tend to be higher in the Yarkand River sand, indicating a different source area and erosion of a deeper tectono-stratigraphic level compared to Aertashi sandstones
6.3. Sm-Nd Data
Previous works on Sm-Nd for the Pamirs and WKL are limited [Robinson et al., 2012; Schwab et al., 2004]. Therefore, we analyzed modern muds from rivers draining the North, Central, and South Pamir, and WKL in order to gain a better averaged characteristic signature for these terranes (Figure 4), which is used to interpret our data from the Aertashi sedimentary section.
Figure 3. Petrography and heavy minerals in Aertashi sandstones and modern rivers draining the Pamirs. (a) QFL plot (fields after Garzanti [2015]). (b) Lithic plot. (c) Compositional biplot including all major petrographic and heavy-mineral parameters. In the biplot [Gabriel, 1971], the length of each ray is proportional to the variance of the corresponding element in the data set. If the angle between two rays is close to 0°, 90°, or 180°, then the corresponding elements are directly correlated, uncorrelated, or inversely correlated, respectively. Note sharp petrographic changes upsection, at≤14 Ma and <11 Ma. None of the Aertashi sandstones compare well with modern Yarkand River sands. Q = quartz, F = feldspars (KF = K-feldspar, Pl = plagioclase) , L = lithic fragments (Lv = volcanic, Ls = sedimentary, Lm = metamorphic, Lvm = volcanic, meta-volcanic and metabasite, Lc = carbonate, Lph = pelite and chert, Lms = low-rank metasedimentary, Lmf = high-rank felsic). MI = metamorphic index [Garzanti and Vezzoli, 2003]. tHMC = transparent heavy-mineral concentration [Garzanti and Andò, 2007], ZTR = zircon + tourmaline + rutile, Cld = chloritoid, St = staurolite, And = andalusite, Ky = kyanite, Sil = sillimanite.
In the Aertashi section, the times of provenance change seen in the petrographic data, as described above, are mirrored by the Sm-Nd data. A shift to more negative, crustal,εNd values is seen just below the onset of the unit containing thin conglomeratic stringers at ~25 Ma, synchronous with the petrographic record of greater input from very low grade and low-grade metamorphic rocks. A second major shift, to more juvenile, less negative values, is seen at≤14 Ma, synchronous with the petrographic change to a major increase in felsic and mafic metavolcanics at this time. Fine-grained material was not present higher up the succession, and therefore, the still later petrographic addition of substantial fresh volcanic input was not recordable by our Sm-Nd bulk analyses. Similar to the petrographic signal, the modern Yarkand River displays anεNd value very different from that of the rocks at≤14 Ma.
6.4. Zircon U-Pb Data 6.4.1. Source Terrains
The North, Central, South Pamir, and WKL each have characteristic signatures as illustrated in Figure 5 (see also Data Set S4). We were not able to access modern rivers draining the Central Pamirs in China. Published data only are available from the western Central Pamir, draining west in Tajikistan, from catch-ments principally draining the gneiss domes [Lukens et al., 2012]; these may not be representative of the eastern regions.
The North Pamir is considered to be the along strike equivalent to the WKL, the WKL being composed of both the North/South Kunlun terranes [e.g., Burtman and Molnar, 1993] and Songpan-Ganzi terrane [Schwab et al., 2004]. Therefore, unsurprisingly, the zircon spectra of some rocks from the North Pamir and WKL, when look-ing at, for example, Mesozoic metasedimentary rocks, can be very similar (for example, compare spectra in Figure 5 of Robinson et al. [2012] for the North Pamir with the Songpan-Ganzi data of Ding et al. [2013], compiled in Figure 7 of Cao et al. [2015]. However, there is considerable along-strike variation; in particular, the Palaeozoic igneous rocks that are prevalent in the South Kunlun and Pamir Kunlun of the WKL are sparse in the North Pamir (Figure 1b). Instead, the North Pamir are dominated by Triassic igneous and metasedimen-tary lithologies, as already noted by Robinson et al. [2012]. This along-strike variation expresses itself in
Figure 4.εNd bulk geochemistry data for modern river sediments draining the Yarkand River at Aertashi, the Karakash, and Tiznip Rivers draining the WKL, the Muji River draining the North Pamir, a Muztagh Ata draining river and the Tashkurgan River draining the South Pamir, and from the Aertashi section, sedimentary rocks with ages in Ma for key units taken from Zheng et al. [2015a]. This plot highlights two key shifts, (1) at approximately 25 Ma, corresponding to the onset of a change in facies with thin conglomerate stringers, and (2) a second shift at≤14 Ma, corresponding to the onset of the major conglomeratic unit.
Figure 5. Characterization of Pamir and WKL terrains. Normalized kernel density plots for U-Pb detrital zircon data from modern rivers draining the WKL, South, Central, and North Pamir. Data are from this study except where noted (samples prefixed Tb are from Rittner et al. [2016], prefixed 1071 are from Carrapa et al. [2014], and TJK are from Lukens et al. [2012]. TJK06, drains both Central and Southern Pamir. The dotted plots relate to small tributaries rather than major drainages, which may not be representative of the terrain as a whole. The 206/238 ages from Lukens et al. [2012] are taken for <1100 Ma, and for Carrapa et al. [2014] their “best age” is plotted. The shaded bars highlight the ~400–500 Ma and ~ 200–300 Ma peaks, typical of WKL provenance, and 100 Ma the peak typical of South Pamir provenance. The color-coded KDE lines reflect the different tectonic terrains.
differences in the zircon spectra of modern river sediments draining the two regions, since modern river sediments from large catchments better depict the average signature of a terrane compared to individual bedrock samples. In Figure 5, it can be seen that the WKL, unlike the Pamir terranes, has a very distinctive and characteristic“double peak” of U-Pb zircon ages, at ~200–300 Ma and 400–500 Ma, a subordinate peak at ~800 Ma, and an appreciable population at>1800 Ma. Our modern river data from the North Pamir and published modern river data from Carrapa et al. [2014] and Rittner et al. [2016] (Figure 5) show that the significant populations aged ~400–500 Ma, 800 Ma, and >1800 Ma in the WKL are much less prevalent in the North Pamir. Instead, in the North Pamir, the 200–300 Ma peak dominates, consistent with the igneous outcrop pattern (Figure 1b). A Triassic 200–300 Ma peak also dominates our modern river sample draining the Muztagh Ata Dome, along with an appreciable ~15 Ma peak.
The only available data from the Central Pamir are from Lukens et al. [2012]; these are from river samples draining west which may not be applicable for comparison with sediment deposited in the Tarim basin. Note that one of the samples (TJK06) is from a river that drains both South and Central Pamir, and therefore is of mixed provenance. Samples are characterized by a zircon peak at ~500–600 Ma, as well as the presence of Paleogene grains. The South Pamir is dominated by an ~100 Ma peak, reflecting grains sourced from bath-oliths of this age which dominate this unit [Robinson et al., 2012].
6.4.2. Aertashi Sedimentary Section Data
Detrital zircon data from the Aertashi section can be compared to the modern river potential source signatures (compare Figures 5 and 6). In comparison with the modern river data, key points to note in the Aertashi rocks are as follows:
1. The>1800 Ma population and the 200–300 Ma and 400–500 Ma double peak, characteristic of the WKL (see Figure 5 and section above) are well represented in the lower part of the Aertashi section. However, two changes occur upsection. First, the>1800 Ma population, although prevalent in the lowest samples at Aertashi, decreases in prominence upsection by ~29–27 Ma. Second, the distinctive 200–300 Ma and 400–500 Ma double peak is characteristic of the Aertashi rocks until 15 Ma, after which time the 400–500 Ma peak becomes considerably less prominent.
2. The ~100 Ma peak seen in the South Pamir and Yarkand Rivers is recorded in the Aertashi detritus by sparse ~100 Ma grains in the<11 Ma sample.
3. The Aertashi rocks contain uncommon Paleogene aged grains in the section until 26 Ma, and then again in samples dated 15 Ma and≤14 Ma. Grains of such age are not recorded in any of the modern river samples draining to the Tarim basin, bar one grain in a Kunlun modern river sample from Rittner et al. [2016]. However, grains of such age are recorded in the west draining Central Pamir Rivers [Lukens et al., 2012] (Figure 5).
4. The 15 Ma zircon peak that is prevalent in the modern Muztagata drainage is represented by a few grains, in the<11 Ma sample in the Aertashi section.
5. The modern Yarkand River shows elements of similarity with the WKL (400–500 Ma peak), South Pamir (100 Ma peak), and the Cenozoic domes (Neogene grains).
To gain a more robust comparison of the zircon U-Pb age spectra, the data were plotted as a Multidimensional Scaling (MDS) Map (Figure 7), which is a configuration of points based on calculated Kolmogorov-Smirnov distances between age spectra [Vermeesch, 2013]. Points to note are that the Aertashi rocks>14 Ma plot in close correspondence to rivers from the WKL. Data from Aertashi samples <14 Ma and younger are displaced from the WKL pole toward the rivers of the North Pamir. The modern Yarkand River today drains upland regions of the WKL, North Pamir, South Pamir, and gneiss domes, reflected in its position on the plot.
6.5. Zircon Fission Track Data, Double Dated With U-Pb Ages
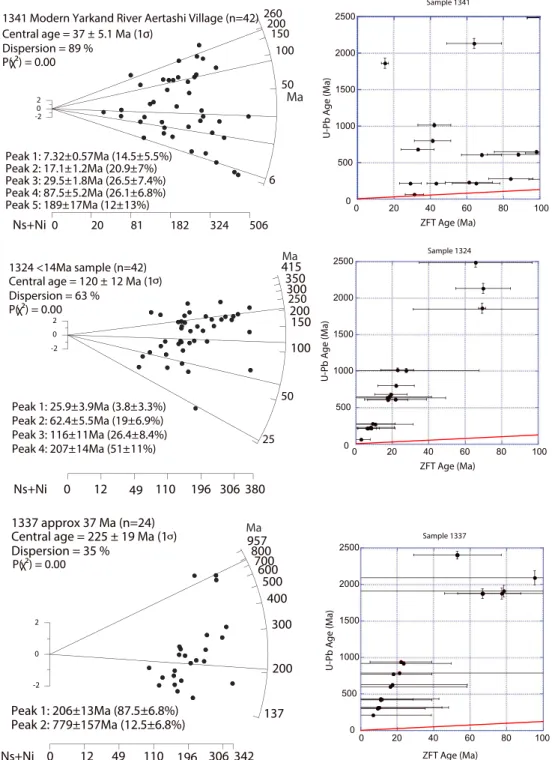
Data are presented in Figure 8 and Data Set S6. The majority of our samples were not suitable for zirconfission track (ZFT) dating due to their small grain size. About 60% of grains from the Yarkand River sample have Cenozoic ZFT ages. Double dating shows that some of the Cretaceous population and a minority of the Cenozoic grains are of volcanic or shallow intrusive origin, as indicated by their U-Pb age and ZFT age overlap-ping within error. By contrast, the grains from the samples collected from the Xiyu conglomerate (≤14 Ma) and from near the base of our studied section (~37 Ma) are near-exclusively (bar one grain in the Xiyu Formation) pre-Cenozoic in age, with double dating indicating that the ages are exhumational rather than magmatic.
6.6. Summary of Provenance Changes
1. A subtle shift in provenance is detected at ~25 Ma, just below the start of the lower conglomerate stringers. This is evidenced by a declining importance of the>1800 Ma zircon population, a shift to more negative εNd values, and a subtle petrographic/mineralogical shift to greater input from very
Figure 6. U-Pb detrital zircon data shown as normalized kernel density plots for rocks from the Aertashi section. The shaded bars represent the populations diagnostic of WKL provenance (200–300 Ma and 400–500 Ma), with the 100 Ma bar typical of South Pamir provenance. Ma in brackets provides the depositional age of the sample. The color-coded KDE plots relate to samples of similar provenance.
low grade/low-grade metamorphic sources. Paleogene grains appear to become less prominent, but the low numbers of such grains throughout the section in total make such an assessment tentative. 2. At≤14 Ma, at the start of the major conglomeratic unit, there is a dras-tic change in provenance. There is a shift in εNd signature to more juvenile values, petrography and heavy minerals show an increase in input from metavolcanic rocks, and the 400–500 Ma zircon popula-tion loses its prevalence. The MDS plot shows the poles starting to pull toward the North Pamir, although there is still considerable similarity with the WKL.
3. At<11 Ma, petrography and heavy minerals show dominant influx from a penecontemporaneous volcanic unit. The sample at <11 Ma shows an increased resemblance to the modern Yarkand River, in terms of the first sparse occurrence of Cretaceous aged zircons, yet the petrography remains distinct.
7. Interpretations
7.1. Pre-Cenozoic and Early Cenozoic Times
We interpret our oldest samples (from 40 Ma) as southerly derived, deposited by rivers draining the WKL, based on the combination of the palaeocurrent data, and the presence of the distinctive ~200–300 Ma and 400–500 Ma double peak and conspicuous ~800 Ma and >1800 Ma populations in these rocks. While, as noted in section 6.4.1, such zircon age spectra can be found in individual metasedimentary bedrocks from both the North Pamirs and WKL, the spectrum is typical of the larger“averaged” drainage basins of the WKL but dissimilar to that of the North Pamir (Figures 5 and 9).
This southerly sourced interpretation is consistent with the fact that the U-Pb age spectrum for these samples is very similar to that of the southerly derived detritus from the coeval Sanju section (Figure 9). This section is located on the southern fringe of the Tarim basin (Figure 1), distant from the Pamirs to the west, and is thus clearly southern (WKL) rather than western (Pamir) derived, as also evidenced by palaeocurrent data (section 3.3). The provenance of Sanju has previously been compared to a southern WKL source (the Songpan-Ganzi; section 3.3) with which it correlates very well [Cao et al., 2015, their Figure 7].
The source of the Paleogene grains remains unresolved. Although Sun et al. [2016] ascribe such grains in the Oytag section to derivation from the Kohistan island arc and Karakoram, we note that similar aged grains are found in the Miocene Sanju section, which is far removed from the Kohistan island arc. Bershaw et al. [2012] suggested that the source of the Paleogene grains lay in the Central/South Pamir (section 3.1). This is an attractive idea in view of the documentation of such grains in the western part of the Central Pamir by Lukens et al. [2012]; section 6.4.1 and Figure 5), and documentation of igneous rocks of suitable age in the Central Pamir by Budanov et al. [1999] and Ratschbacher (unpublished data) as quoted in Bershaw et al. [2012]. Similar aged igneous bodies are recorded in the northern part of the Qiangtang terrane [Long et al., 2015], which is potentially correlated with the Central Pamir [Cowgill, 2010; Robinson et al., 2012; Schwab et al., 2004]. Such a source would be more suitable than a Kohistan arc source for the southerly derived grains of the Sanju section, since the Qiangtang terrane, or its correlatives, lies south of the WKL (Figure 1a) and in
Figure 7. A multidimensional scaling map [Vermeesch, 2013] displays the similarities/dissimilarities between the individual sample age spectra. Aertashi at>14 Ma and WKL samples plot together because they have similar age distributions. Aertashi samples at≤14 Ma and younger, pull away from the WKL pole, toward the North Pamir, indicating additional contribution from this region at this time.
some correlations the Central Pamir is correlated with the Songpan-Ganzi of the WKL (see Cowgill [2010], and references therein). This would be consistent with the suggestion of Cao et al. [2015] that such grains in the Kekeya and Sanju sections (deposited<25 Ma) are derived from regions to the south, which are currently incompletely characterized (section 3.3). A single Paleogene grain has been recorded by Rittner et al. [2016] in a modern river sediment draining the WKL (Tb35), but more data would be required before such a source could be robustly confirmed in the region.
The prominent ZFT population with exhumational ages of ~200 Ma is similar to that recorded in Cenozoic sedimentary sections along the southern margin of the Tarim basin at Sanju and Kekeya, and like Cao et al.
Figure 8. Zirconfission track radial plots and ZFT-U-Pb age double dating plots for zircons from the Aertashi section rocks and from the modern Yarkand River at Aertashi.
[2015], we interpret the northern margin of Tibet to have been an emergent exhuming area at ~200 Ma, subsequent to subduction and closure of the palaeo-Tethys, which was occurring at this time [Cao et al., 2013; Liu et al., 2015; Zhang et al., 2015; Pullen et al., 2008; Meng and Zhang, 1999].
The ZFT data for the sample deposited at ~37 Ma show only pre-Cenozoic ages. This indicates that rocks of this age do not show any evidence for source region exhumation sufficient to exhume rocks from depths below the zircon partial annealing zone to surface. This is consistent with the conclusion of Cao et al. [2015] from their much more extensive ZFT data set. Apatitefission track (AFT) data from similar-aged strata at Aertashi also show old, albeit partially reset, AFT ages [Sobel and Dumitru, 1997], confirming the lack of evidence for strong exhumation in the source area at this time.
7.2. Late Oligocene (~25 Ma)
The provenance shift occurring at ~25 Ma, just below the facies change recorded by the lower conglomerate stringers, is subtle; the dominant signature remains that of the WKL regions to the south, as evidenced by the zircon U-Pb data (Figures 7 and 9) and palaeocurrents (Figure 2). The shift is recorded most clearly in the
Figure 9. A summary of U-Pb KDE plots for Aertashi divided into age bins of documented provenance change, compared to data from the Sanju sedimentary section and pooled data from the various source regions (WKL, North, South, Central Pamir, and gneiss domes). The color scheme aligns with Figures 5 and 6.
move to more negativeεNd bulk rock values but is also reflected in the increasing input of very low grade and low-grade metamorphic detritus, decreasing prominence of the>1800 Ma zircon population, and perhaps a reduction of the Paleogene zircon population (two samples contain no Paleogene grains, but the youngest sample in the interval before the next provenance change, at 15 Ma, again contains these uncommon grains). The disappearance of the Paleogene zircon population also occurred in the Oytag section around this time, but not in the Sanju and Kekeya sections where grains of such age continue to be recorded up-section (section 3). A provenance change is also recorded by changing Sm-Nd bulk rock data and petrography in the Oytag section around this time (section 3.1).
This period is proposed to be the time of initiation of the bounding faults along the Kunlun’s northern margin, with movement of the KYTS and Tiklik Faults (section 2.2) and consequent basinward expansion of the north-ern margin of Tibet and initiation of indentation of the Pamir salient. We propose that changes in the prove-nance signature at both Oytag and Aertashi reflect this tectonism. Uplift of the North and South Kunlun may have progressively, but not completely, cut off the more southerly, Palaeogene zircon bearing, source of the Songpan-Ganzi/Central Pamir terranes. A greater effect of the uplift of these terranes may have been felt farther west, closer to the Pamir salient, as reflected in the elimination (at Oytag) and reduction (at Aertashi) of the Palaeogene zircon population in the more western areas only. Proximity to the now moving KYTS may also explain the more proximal conglomerate stringer facies observed at Aertashi at this time.
7.3. After the Early-Mid-Miocene (≤14 Ma)
At≤14 Ma, the ~400–500 Ma U-Pb zircon age peak is no longer prominent in the sedimentary section, leaving the ~200–300 Ma peak dominant. While the zircon age spectrum still reflects dominance of a WKL-like source, Figure 7 shows that samples of this age and younger are pulling away from the WKL pole toward the North Pamir. Input from the North Pamir is also reflected in the shift in εNd values to become more similar to the North Pamir than the WKL signature at this time (Figure 4); this change to more positive values is consistent with the increase of metavolcanic detritus recorded in this interval). Cretaceous, Paleogene, and Neogene (14 Ma) zircons are sparse. The overwhelming majority of the ZFT ages are pre-Cenozoic. This indicates that either the source regions were still undergoing predominantly thin-skinned exhumation or that not enough time had elapsed to exhume young zircons to the surface.
The major reduction in prominence of the ~400–500 Ma zircon U-Pb population (Figure 9) is significant. As discussed above, while the North Pamir and WKL are correlated (section 2.2), and thus broadly share similar lithological characteristics, Palaeozoic igneous intrusions comprise a considerably higher proportion of lithologies in the WKL compared to the North Pamir (Figure 1) as reflected in the modern river data draining these terranes (Figure 9). We therefore interpret the considerable reduction in the 400–500 Ma zircon population in Aertashi rocks at≤14 Ma, coupled with the shift in εNd values toward a signature more similar to the North Pamir, to reflect the time when the Pamir indenter had propagated sufficiently far north that the North Pamir began to contribute detritus to the Aertashi region, i.e., ~200 km north of the northern margin of Tibet. Such proximity to the salient is supported by our palaeocurrent data and change in facies; while the NW-directed palaeocurrents prior to 14 Ma indicate a lack of topography to the west of the basin during this period, the onset of major conglomerates after≤14 Ma documents a proximal exhuming hinterland at this time.
Recurrence of rare Paleogene grains, from 15 Ma, now accompanied by sparse Cretaceous grains, may hint at limited derivation from the Central/South Pamir at this time. The uncommon Neogene zircon grains hint at a possibility of minor input from the gneiss domes, such as the Shatput and Muztagh Ata, which had begun to exhume by this time [Robinson et al., 2007; Stearns et al., 2015; Thiede et al., 2013]. Any domal input was not prominent, however, as shown by the petrography, and such zircons could also be ascribed to volcanic sources. The occurrence of magmatism in this region, albeit of a mafic composition, is evidenced by the major influx of fresh mafic volcanic detritus in the samples at <11 Ma. This mafic detritus may be sourced from the 13–8 Ma Tashkorgan igneous complex, which outcrop in the eastern central Pamir [Stearns et al., 2015, and references therein].
Between<11 Ma and modern day, the provenance signal changes again. A minor ~100 Ma peak, character-istic of the South Pamir isfirst recorded in the<11 Ma sample but only becomes prominent in the modern Yarkand River (Figures 6 and 9). Thus, although a palaeo-Yarkand may have been identified earlier in the
sedimentary record in other regions [Cao et al., 2014] (section 3.2), we see no evidence of it following its cur-rent drainage pattern until very recently. In contrast to samples from the Aertashi sedimentary record (young-est sample analyzed for ZFT has a depositional age at<14 Ma), there is also a substantial population of Neogene ZFT ages from the modern Yarkand River sample indicating exhumation from depth in the source region; 30% of the double-dated grains have Neogene ZFT ages, and double dating with U-Pb shows these ages to be exhumational rather than magmatic.
The petrographic signature of the Yarkand River indicates a mixed input from a number of terranes, consis-tent with the modern day drainage pattern. Likewise, the shift back to a more negativeεNd signature in modern times at Aertashi reflects expansion of the Yarkand drainage basin, with values consistent with input from upland regions of the Yarkand catchment draining the South Pamirs, Central Pamirs, and gneiss domes today (Figure 4).
8. Summary and Conclusions: The Palaeogeographic Model
Based on our results in the context of the regional review presented above, we propose a conceptual model of palaeogeographic evolution, as follows:
1. At ~35 Ma (Figure 10a), the WKL is a topographic feature which is likely to have been elevated since ~200 Ma; its early uplift was associated with closure of the palaeo-Tethys. Prior to the indentation of the Pamir with respect to Tarim, the WKL and the North Pamir likely formed an east-west trending belt with higher topography than the basin to the north. The resulting paleotopographic gradient resulted in northwardflowing rivers as our provenance data indicate.
2. At ~25 Ma (Figure 10b), movement along the WKL bounding faults such as the Tiklik Fault and KYTS accommodated northward basinward expansion of the range and the beginning of Pamir indentation. Uplift of the northern plateau margin changed the palaeodrainage pattern within the Kunlun, progres-sively cutting off the more distal southerly hinterlands of the rivers draining north to Aertashi. The western region, closer to the Pamir salient and KYTS, was more affected than the eastern region.
3. It was not until after 14 Ma (Figure 10c) that an additional new, westerly, North Pamir source was provided to the basin, as attested to by the provenance data and the abrupt change to proximal facies. Nevertheless, a WKL source continued to contribute detritus from the south (Figure 7).
4. Thus, although the KYTS was active since ~25 Ma (Figure 10b), accommodating northward indentation of the Pamir, we interpret that it is not before 14 Ma that the indenter had propagated sufficiently far north,
Figure 10. Model of the evolution of the Pamir salient (modified from Bande et al. [2015]) and palaeodrainage pattern (in blue) interpreted from the sedimentary record at Aertashi. The red arrows indicate the direction of movement. (a) The Songpan-Ganzi terrane forms raised topography such that the Aertashi section receives sediment from northwardflowing rivers. (b) Basinward expansion of the NW margin of Tibet, and initiation of Pamir indentation as the North and South Kunlun terranes exhume as the KYTS and Tiklik Thrusts initiate. This results in a subtle shift in the drainage to Aertashi, with abundance of material from more distal sources declining as the more proximal Kunlun terranes are exhumed. (c) Indentation of the Pamir Salient was now sufficiently proximal to Aertashi that a new North Pamir source contributed to the Aertashi drainage and the proximal location to the new source resulted in a major sequence of conglomerate deposition in Aertashi. However, the southern palaeodrainage from the Kunlun was not yet cut off. (d) The catchment area of the modern Aertashi River. The embryonic establishment of the modern drainage initiated after 11 Ma (Figure 10d). AT = Aertashi section, KYTS = Kashgar Yecheng Transfer System, SYF = Shache-Yangdaman Fault, TFF = Talas-Fergana Fault, MPT = Main Pamir Thrust, PFT = Pamir Frontal Thrust.