HAL Id: hal-03013454
https://hal.archives-ouvertes.fr/hal-03013454
Submitted on 23 Nov 2020
HAL is a multi-disciplinary open access
archive for the deposit and dissemination of
sci-entific research documents, whether they are
pub-lished or not. The documents may come from
teaching and research institutions in France or
abroad, or from public or private research centers.
L’archive ouverte pluridisciplinaire HAL, est
destinée au dépôt et à la diffusion de documents
scientifiques de niveau recherche, publiés ou non,
émanant des établissements d’enseignement et de
recherche français ou étrangers, des laboratoires
publics ou privés.
triggers fatal autoimmunity to a cross-presented
self-antigen
Christian Wohn, Valentin Le Guen, Odessa Voluzan, Frédéric Fiore, Sandrine
Henri, Bernard Malissen
To cite this version:
Christian Wohn, Valentin Le Guen, Odessa Voluzan, Frédéric Fiore, Sandrine Henri, et al.. Absence
of MHC class II on cDC1 dendritic cells triggers fatal autoimmunity to a cross-presented self-antigen.
Sci. Immunol, 2020, 5. �hal-03013454�
A D A P T I V E I M M U N I T Y
Absence of MHC class II on cDC1 dendritic cells triggers
fatal autoimmunity to a cross-presented self-antigen
Christian Wohn1, Valentin Le Guen1, Odessa Voluzan1, Frédéric Fiore2,
Sandrine Henri1*†, Bernard Malissen1,2*†
Conventional dendritic cells expressing the XCR1 chemokine receptor (cDC1s) excel at cross-presentation. Here, we developed and used a mouse model in which a Cre recombinase is expressed under the control of the Xcr1 gene while preserving XCR1 expression. We used it to generate mice with conditional deletion of MHC class II (MHCII) molecules on cDC1s. By preventing cDC1s to receive suppressive regulatory T cell inputs via MHCII-restricted interactions, the objective of the present study was to gauge whether MHCII-deficient cDC1s lose their capacity of tolerizing autoreactive CD8+ T cells. Whereas MHCII+ cDC1 readily cross-tolerized strongly autoreactive CD8+ T cells specific for a keratinocyte-derived self-antigen, MHCII-deficient cDC1s converted them into potent effectors capable of triggering a fast-onset lethal autoimmunity associated with severe skin histopathological manifestations. Pre-venting egress of such pathogenic self-reactive CD8+ T cell effectors from the cutaneous draining lymph nodes abrogated the autoimmune condition. Therefore, our results revealed that the cross-tolerizing capacity of cDC1s is not a property fully acquired at the time they undergo homeostatic maturation but needs to be enforced via MHCII-restricted, suppressive interactions with regulatory T cells.
INTRODUCTION
Dendritic cells (DCs) can be subdivided into conventional type 1 (cDC1), conventional type 2 (cDC2), and plasmacytoid (pDC) DCs (1). cDC residing in steady-state tissues sample self-antigens (Ags) and undergo a terminal differentiation program—referred to as homeo-static maturation—enabling their migration to draining lymph nodes (LNs) and execution of tolerogenic function. It consists of continuously displaying self-Ags to induce anergy or to delete of strongly self-reactive T cells that have escaped central tolerance and to maintain the suppres-sive function of Foxp3+ regulatory T (Treg) cells (2, 3). In contrast,
when microbes breach tissue barriers, cDCs undergo immunogenic maturation, leading to the production of proinflammatory cytokines that relieve Treg cell suppressive action and promote clonal expansion
of effector T cells specific for microbial Ags.
cDC1s excel in loading exogenous Ags on major histocompatibil-ity complex class I (MHCI) molecules, a process called Ag cross- presentation. It allows them to trigger CD8+ T cells specific for Ags
in which they do not synthesize themselves including those of self- and foreign origins (4). K5.mOVA transgenic mice express a cell membrane– bound form of ovalbumin (OVA) in skin keratinocytes, the outer root sheath of the hair follicles, the esophagus epithelium, and medul-lary thymic epithelial cells (5). They have been used to study the mechanisms leading to the tolerization of adoptively transferred OT-I CD8+ T cells, the T cell receptor (TCR) of which has a high affinity for an OVA-derived peptide presented by H-2Kb MHCI molecules.
After migration into draining cutaneous LNs (CLNs), dermal cDC1s were solely capable of cross-presenting keratinocyte-derived OVA to OT-I T cells (6, 7). As a result, OT-I T cells underwent an initial proliferation burst that was followed by their deletion over a period of 6 weeks (5, 8).
The Cre-loxP system has been extensively used for conditional gene knockout in cell types of interest. cDC1s can be identified across tissues by expression of the XC chemokine receptor 1 (XCR1) that binds to a single chemokine known as XCL1 (1, 9–11). Accordingly, we developed a mouse model in which a Cre recombinase and a fluorescent reporter were coexpressed under the control of the Xcr1 gene, in a manner that maintains XCR1 expression and preserves the XCL1-mediated cross-talk that occurs between natural killer (NK) cells, pDCs, CD8+ memory T cells, and cDC1s (11–14). It differs from
a former model in which a Cre recombinase replaced the entire cod-ing sequence of the Xcr1 gene (15). We exploited this model to gen-erate mice that are specifically lacking MHCII molecules on cDC1s and evaluated whether they remained capable of cross-tolerizing CD8+ T cells that weakly or strongly react to self-Ags.
RESULTS
A mouse model permitting specific gene ablation in cDC1s does not affect XCR1 expression
To evaluate the role of candidate genes in cDC1 physiology, we gen-erated gene-edited mice called Xcr1Cre-mTFP1 and containing in the
3′ untranslated region of their Xcr1 gene an internal ribosomal entry site (IRES)–driven cassette comprising a codon-improved Cre recom-binase (iCre) and a bright version of the monomeric teal fluorescent protein 1(mTFP1) cyan fluorescent reporter protein (see Materials and Methods). The resulting gene modification had no effect on XCR1 expression at cDC1 surface (fig. S1A), and cDCs isolated from Xcr1Cre-mTFP1 mice coincidently expressed XCR1 and mTFP1 (fig. S1B).
To demonstrate that Cre activity was restricted to cDC1s, we crossed
Xcr1Cre-mTFP1 mice to Rosa26LSL-tdRFP mice in which Cre-mediated
excision of a loxP-flanked transcriptional STOP element triggers expression of a red fluorescent protein (RFP). Analysis of DC subsets in the spleen, CLN, and skin of the resulting Xcr1RFP mice showed that
all cDC1s were RFP+, regardless of their anatomical location and ex-pression of CD8, whereas cDC2s and Langerhans cells (LCs) expressed little (<2%) or no detectable RFP, respectively (fig. S1, C to G). As 1Centre d’Immunologie de Marseille-Luminy, Aix Marseille Université, INSERM,
CNRS, 13288 Marseille, France. 2Centre d’Immunophénomique, Aix Marseille
Uni-versité, INSERM, CNRS, 13288 Marseille, France.
*Corresponding author. Email: bernardm@ciml.univ-mrs.fr (B.M.); henri@ciml.univ-mrs. fr (S.H.)
†These authors contributed equally to this work.
Copyright © 2020 The Authors, some rights reserved; exclusive licensee American Association for the Advancement of Science. No claim to original U.S. Government Works by guest on March 14, 2020 http://immunology.sciencemag.org/ Downloaded from
expected, splenic B cells (CD19+CD45R+), CD8+ T cells (CD3+CD8+), NK cells (CD11bintNK1.1+), neutrophils (CD11b+Ly-6G+), and pDCs
(CD45R+PDCA-1+) were RFP− (fig. S1H). Unexpectedly, a small fraction (<1%) of CD4+ T cells from the spleen of Xcr1RFP mice
ex-pressed RFP (fig. S1, H and I). However, they did not express the XCR1 protein at their surface (fig. S1J), suggesting that Xcr1-driven Cre was transiently expressed in their progenitors. Unwanted germ-line deletion often occurs in Cre/loxP-based mouse models, the magnitude of which depends on floxed alleles (16). Analysis of mice resulting from inter- or backcrosses of Xcr1RFP mice revealed that
the Xcr1Cre-mTFP1 allele can sporadically delete the Rosa26lsl-tdRFP allele
in the germ line, resulting in ubiquitous RFP expression. Accordingly, blood cells from Xcr1RFP mice were systematically analyzed for
ad-ventitious RFP expression (see Materials and Methods), and mice with germline deletion were excluded from further study. Therefore,
Xcr1Cre-mTFP1 mice permit specific gene ablation in cDC1s without
affecting XCR1 expression.
Absence of MHCII on cDC1 triggers increased CD40 expression on cDC1
To generate mice with a cDC1-specific ablation of MHCII mole-cules (Xcr1Ab1 mice), we crossed Xcr1Cre-mTFP1 mice to mice
ex-pressing a loxP-flanked H-2Iab allele (17). Consistent with a recent report (18) and our previous analysis of Xcr1RFP mice, a high
fre-quency of Xcr1Ab1 mice were found to have deleted the H-2Iab allele
in a promiscuous manner outside of cDC1s and excluded from fur-ther study (see Materials and Methods). Analysis of DC subsets, B cells, and neutrophils found in the peripheral lymphoid (spleen and CLN) and nonlymphoid (intestine, skin, and lung) tissues of the properly deleted Xcr1Ab1 mice showed that MHCII molecule
expres-sion was retained on B cells and cDC2s found in the spleen (Fig. 1A), intestine (Fig. 2B), skin (including LC; Fig. 2G), CLN (fig. S3A), and lung (including alveolar macrophages; fig. S3G). In contrast, MHCII molecule expression was lost on cDC1s across all tested organs of Xcr1Ab1
mice (Figs. 1A and 2, B and G, and fig. S3, A and G). Xcr1Ab1 mice followed for up to 52 weeks showed no weight loss (Fig. 2A) or neu-trophilia (Figs. 1B and 2, C and H, and fig. S3, B and H) and no sign of inflammation or pathological changes in the skin or intestine (Fig. 2, F and K). cDC1s undergo homeostatic maturation and can therefore be divided into CCR7− (“immature”) and CCR7+ (“mature”)
cells. In Xcr1Ab1 mice, the numbers of splenic CCR7+ cDC1s and of immature and mature cDC2s remained unaffected, whereas a slight reduction was noted in splenic CCR7− cDC1s number (Fig. 1B). Ab-sence of MHCII expression by cDC1 was also without impact on the absolute numbers of cDC1s and cDC2s found in the intestine (Fig. 2C), skin (Fig. 2H), CLN (fig. S3B), and lung (fig. S3H). cDC1 from the spleen (Fig. 1C and fig. S2A), intestine (Fig. 2D and fig. S2B), skin (Fig. 2I and fig. S2B), CLN (figs. S2C and S3C), and lung (fig. S2C and S3I) of Xcr1Ab1 mice expressed increased surface levels of CD40 as compared with control (CTRL) mice. In contrast, cDC2s, which remained MHCII+ in Xcr1Ab1 mice, expressed normal levels of CD40. Therefore, under steady- state conditions, specific deletion of MHCII molecules on cDC1s did not impair their homeostatic maturation and only led to increased CD40 expression.
Absence of MHCII on cDC1 results in higher numbers
of effector memory CD8+ T cells
The spleen of Xcr1Ab1 mice showed normal percentages of
conven-tional CD4+ T cells with a naïve to effector memory ratio
compara-ble with that of CTRL mice (Fig. 1D). Unchanged percentages of natural (Nrp1+) and peripherally induced (Nrp1−) T
reg cells were also
present in the spleen (Fig. 1E) of Xcr1Ab1 mice. In addition, Treg
cells from Xcr1Ab1 mice were as effective as those from CTRL
mice in suppressing proliferation of conventional CD4+ T cells (Fig. 1F). The sole feature specific to T cells from Xcr1Ab1 mice
was an increase in CD62L−CD44+ and in programmed cell death protein 1–positive (PD-1+) effector memory CD8+ T cells in the
spleen (Fig. 1, G and H), CLN (fig. S3, E and F), intestine (Fig. 2E), skin (Fig. 2J), and lung (fig. S3J). Therefore, under steady-state conditions, specific deletion of MHCII molecules on cDC1s led to a significant increase in CD8+ T cells with an effector memory
phenotype but was without measurable impact on the composition of the CD4+ T cell compartment.
MHCII-deficient cDC1s show enhanced cross-presentation of a self-Ag expressed in keratinocytes
To demonstrate the importance of cDC1s for cross-tolerizing strongly autoreactive OT-I T cells, we first crossed Xcr1Cre-mTFP1 mice to Rosa26lsl-DTA mice in which Cre-mediated excision of a loxP-flanked
transcriptional STOP element triggers expression of diphtheria toxin fragment A (DTA) and results in the constitutive ablation of cDC1s (fig. S4). The resulting Xcr1DTA mice were further crossed to K5. mOVA mice to obtain K5.mOVA Xcr1DTA mice. Whereas adoptively
transferred OT-I T cells proliferated in the CLNs of K5.mOVA CTRL mice (Fig. 3A), their proliferation was almost fully abrogated in K5.mOVA Xcr1DTA mice (Fig. 3A), confirming that cross-presentation of keratinocyte-expressed OVA primarily depends on dermal migratory cDC1s (7).
Considering that Treg cells exert a TCR-MHCII–dependent brake
on steady-state cDCs (19, 20), we sought to determine whether lifting this brake via MHCII ablation enhanced the capacity of OVA-laden cDC1s to activate OT-I T cells. Adoptive transfer of OT-I T cells into K5.mOVA Xcr1Ab1 mice led to elevated numbers of proliferating
OT-I T cells in the CLNs as compared with transfer into K5.mOVA mice (Fig. 3B). Moreover, upon transfer into K5.mOVA Xcr1Ab1 mice,
OT-I T cells achieved a higher number of cell divisions (Fig. 3C) and showed increased percentage of interferon- (IFN-)–producing cells (Fig. 3D) as compared with transfer into K5.mOVA mice. Therefore, absence of MHCII molecules on cDC1s enhanced their cross-priming capacity toward a self-Ag and increased Ag-induced production of IFN- by autoreactive CD8+ T cells.
Absence of MHCII molecules on cDC1s leads to an early-onset lethal autoimmunity toward a self-Ag expressed
in keratinocytes
In view of the exacerbated OT-I T cell activation resulting from OVA cross-presentation by MHCII-deficient cDC1s, we tested next whether autoimmunity ensues in K5.mOVA Xcr1Ab1 mice as compared with K5.mOVA mice. All the K5.mOVA Xcr1Ab1 mice that had received
OT-I T cells showed a rapid decrease in survival (Fig. 4A), associated with marked weight loss (Fig. 4B) and skin lesions (Fig. 4D) as compared with K5.mOVA CTRL mice. The severe weight loss manifested by K5.mOVA Xcr1Ab1 mice as early as day 8 after
OT-I T cell transfer was likely due to the expression of OVA in the esophagus epithelium of K5.mOVA mice (5), triggering marked esophageal lesions (Fig. 4C) and, in turn, impaired feeding. Eight days after adoptive transfer, OT-I T cells were 25 times more numerous in the CLNs of K5.mOVA Xcr1Ab1 mice as compared
by guest on March 14, 2020
http://immunology.sciencemag.org/
B A MHCII xa m f o % FMO Xcr1Ab1 CTRL
MHCII expression (median fluoresence)
cDC2 cDC1 B cells CTRL Xcr1Ab1 D C CD40 expression (median fluoresecnece) CCR7 + CCR7 – CCR7 + CCR7 – cDC2 cDC1 % of CD4 + cell s 0 20 40 60 80 CD62 L+ CD44 – CD62 L– CD44 + Foxp 3+ CD25 + set yc on elp s f o % 0 5 10 15 CD4 + T cell s E 0 1 2 3 4 5 % of splenocytes nTreg 0.0 0.1 0.2 0.3 0.4 0.5 iTreg G F % Divided CD 4 + cells CTRL Xcr1Ab1 CTV % of max Xcr1Ab1 CTRL 1:0 1:1 1:2 1:4 1:8 1:16 1:0 1:1 1:2 1:4 1:8 1:16 0 50 100 150 No anti-CD3 No T reg1:1 1:21:4 1:81:161:1 1:21:4 1:81:16 H 0 5 10 15 ** % of CD44 + PD-1 + CD 8 + cell s PD-1 CD44 3.6 10.5 Xcr1Ab1 CTRL 0 20 40 60 80 100 % of CD 8 + cell s CD62 L+ CD44 – CD62 L+ CD44 + CD62 L– CD44 + *** 0.0 2.5 5.0 7.5 10.0 12.5 set yc on elp s f o % CD8 + T cell s 0 2 4 6 8 10 CD62L –CD44 +CD8 +T cells per spleen ( 1 × 10 7) ** 100 1000 10,000 **** 0 500 1000 1500 2000 ** *** Cells per spleen ( 1 × 10 6) 0 2 4 6 CCR7 + CCR7 – CCR7 + CCR7 – cDC2 cDC1 Neutro * 8 10 n.s. n.s. n.s. n.s. n.s. cDC2 cDC1 B cells
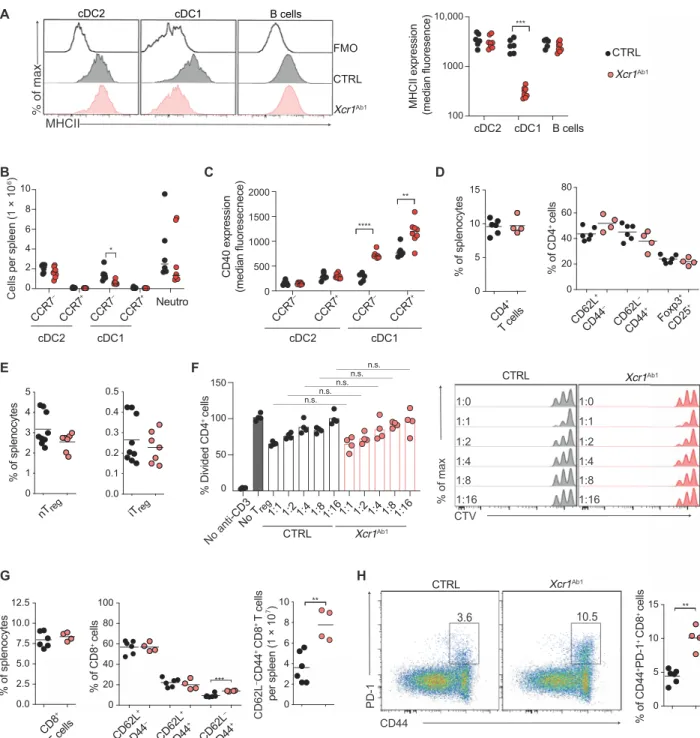
Fig. 1. Absence of MHCII on cDC1s results in higher frequency of effector memory CD8+ T cells in the spleen. (A) MHCII expression on cDC2s (Lin−CD19−Ly-6G−
CD11c+CD11b+), cDC1s (Lin−CD19−Ly-6G−CD11c+XCR1+), and B cells (Lin−CD19+) from Xcr1Ab1 (Xcr1+/−Ab1fl/fl) (red) and CTRL (Xcr1−/−Ab1fl/fl) (gray) spleen. A fluorescence
minus one (FMO) control without the anti-MHCII antibody is shown. Median fluorescence levels of MHCII molecules are also shown in the right. Data are representative of five experiments with n ≥ 4 mice per group. (B) Absolute number of CCR7− and CCR7+ cells among cDC2s and cDC1s and of neutrophils in the spleen of Xcr1Ab1 and CTRL
mice. Data are pooled from two independent experiments with n ≥ 3 animals per group. (C) Median fluorescence levels of CD40 on CCR7− and CCR7+ cDC2s and cDC1s
found in the spleen of Xcr1Ab1 and CTRL mice. Gating strategy for spleen B cells, CCR7− and CCR7+ cDC1s and cDC2s, and neutrophils is shown in fig. S2A. (D) Percentage of
CD4+ T cells among total splenocytes and of CD62L+CD44−, CD62L−CD44+, and FoxP3+CD25+ subsets among splenic CD4+ T cells of the specified mice. (E) Frequency of
natural (Nrp1+FoxP3+) and peripherally induced (Nrp1−FoxP3+) T
reg cells among splenocytes of the specified mice. (F) Treg cells from CTRL or Xcr1Ab1 mice were cultured
at the indicated ratio with CTV-labeled conventional CD4+ T cells from CTRL mice in the presence of anti-CD3, and the percentage of conventional CD4+ T cells that have
divided was evaluated after 60 hours of culture. n.s., not significant. (G) Percentage of CD8+ T cells among total splenocytes and of CD62L+CD44−, CD62L+CD44+, and
CD62L−CD44+ subsets among splenic CD8+ T cells. The absolute number of CD62L−CD44+ CD8+ T cells in Xcr1Ab1 and CTRL mice is also shown. (H) PD-1 and CD44
expres-sion on CD8+ T cells from Xcr1Ab1 and CTRL spleen. Also shown is the percentage of CD44+PD-1+CD8+ T cells. In (D), (E), (G), and (H), data are representative of three
exper-iments with n ≥ 3 mice per group. (F) Each dot corresponds to a single measurement and the corresponding mean (horizontal bar) is indicated; data are representative of two experiments. Samples were analyzed with one-way ANOVA with Sidak correction for multiple testing. In (A) to (E), (G), and (H), each dot corresponds to a mouse and the means (horizontal bar) are indicated, and samples were compared using two-tailed Student’s t test with Welch’s correction. *P < 0.05, **P < 0.01, ***P < 0.001.
by guest on March 14, 2020
http://immunology.sciencemag.org/
with those of K5.mOVA mice (Fig. 4E). The CD44/CD62L pro-file of OT-I T cells found in the CLNs of K5.mOVA Xcr1Ab1
and K5.mOVA mice corresponded to effector cells, and increased
percentage of CD62L−CD44+ T cells were found in K5.mOVA Xcr1Ab1 CLN as compared with those of K5.mOVA mice (Fig. 4F).
Consistent with the view that high expression of the T cell factor 1
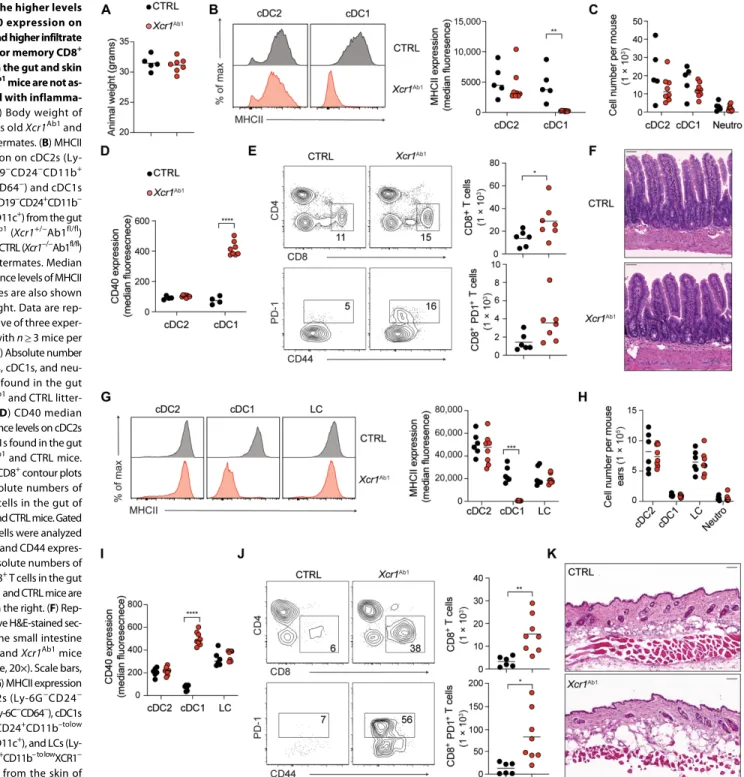
Fig. 2. The higher levels of CD40 expression on cDC1s and higher infiltrate of effector memory CD8+ T cells in the gut and skin of Xcr1Ab1 mice are not as-sociated with inflamma-tion. (A) Body weight of
52 weeks old Xcr1Ab1 and
CTRL littermates. (B) MHCII expression on cDC2s (Ly- 6G−CD19−CD24−CD11b+
Ly-6C−CD64−) and cDC1s
(Ly-6G−CD19−CD24+CD11b−
XCR1+CD11c+) from the gut
of Xcr1Ab1 (Xcr1+/−Ab1fl/fl)
(red) and CTRL (Xcr1−/−Ab1fl/fl)
(gray) littermates. Median fluorescence levels of MHCII molecules are also shown in the right. Data are rep-resentative of three exper-iments with n ≥ 3 mice per group. (C) Absolute number of cDC2s, cDC1s, and neu-trophils found in the gut of Xcr1Ab1 and CTRL
litter-mates. (D) CD40 median fluorescence levels on cDC2s and cDC1s found in the gut of Xcr1Ab1 and CTRL mice.
(E) CD4+CD8+ contour plots
and absolute numbers of CD8+ T cells in the gut of Xcr1Ab1 and CTRL mice. Gated
CD8+ T cells were analyzed
for PD-1 and CD44 expres-sion. Absolute numbers of PD1+CD8+ T cells in the gut
of Xcr1Ab1 and CTRL mice are
shown in the right. (F) Rep-resentative H&E-stained sec-tion of the small intestine of CTRL and Xcr1Ab1 mice
(objective, 20×). Scale bars, 50 m. (G) MHCII expression on cDC2s (Ly-6G−CD24− CD11b+Ly-6C−CD64−), cDC1s (Ly-6G−CD24+CD11b–tolow XCR1+CD11c+), and LCs (Ly- 6G−CD24+CD11b– to lowXCR1−
CD11c+) from the skin of Xcr1Ab1 (red) and littermate
CTRL (gray) mice. Median fluorescence levels of MHCII molecules are also shown in the right. (H) Absolute numbers of cDC2s, cDC1s, LCs, and neutrophils found in the skin of Xcr1Ab1 and CTRL littermates. (I) CD40 median fluorescence levels on cDC2s, cDC1s, and LCs found in the skin of Xcr1Ab1 and CTRL mice. (J) CD4+CD8+ contour plots
and absolute numbers of CD8+ T cells in the skin of Xcr1Ab1 and CTRL mice. Gated CD8+ T cells were analyzed for PD-1 and CD44 expression. Absolute numbers of
PD1+CD8+ T cells in the gut of Xcr1Ab1 and CTRL mice are shown in the right. (K) Representative H&E-stained section of the back of the skin of CTRL and Xcr1Ab1 mice
(objective, 20×). Scale bars, 100 m. Gating strategies for cDC1s, cDC2s, neutrophils in the gut and skin and LC in the skin are detailed on fig. S2B. Each dot corresponds to a mouse and the means (horizontal bar) are indicated, and data are pooled from two independent experiments with n ≥ 3 animals per group. Samples were compared using two-tailed Student’s t test with Welch’s correction. *P < 0.05, **P < 0.01, ***P < 0.001, ****P < 0.0001.
by guest on March 14, 2020
http://immunology.sciencemag.org/
(TCF1) transcription factor counteracts the differentiation of effector CD8+ T cells (21) and that the SLAM Family Member 6 (SLAMF6) surface receptor (also known as Ly108 or CD352) inhibits T cell responses (22), OT-I T cells found in K5.mOVA Xcr1Ab1 CLN expressed
diminished levels of both TCF1 (Fig. 4G) and SLAMF6 (Fig. 4H) as compared with their counterpart found in K5.mOVA mice. Moreover, histological analysis of the back skin of K5.mOVA Xcr1Ab1 mice 8 days after OT-I T cell transfer revealed severe epidermal erosion, perifollicular infiltra-tion, and degeneration of the hair shafts, whereas no histopathological manifesta-tions were observed in K5.mOVA mice that received the same numbers of OT-I T cells (Fig. 4I). Last, a significant increase (P < 0.05) of OT-I T cell was found in the skin of untreated K5.mOVA Xcr1Ab1
mice as compared with K5.mOVA CTRL mice (Fig. 4J). Therefore, the effector OT-I T
cells elicited in the CLN of K5.mOVA Xcr1Ab1 mice triggered a fatal early-onset autoimmunity resembling toxic epidermal necrolysis.
Sequestration of autoreactive OT-I T cells in the CLN of K5.
mOVA Xcr1Ab1 mice rescues them from lethal autoimmunity
T cell egress from LN requires the sphingosine-1 phosphate recep-tor (S1PR), and the FTY-720 (fingolimod) immunosuppressant
inhibits such emigration via down-regulation of S1PR (23). To establish a causal link between the activation of OT-I in the CLNs of K5.mOVA Xcr1Ab1 mice and the occurrence of skin lesions, we adoptively transferred K5.mOVA Xcr1Ab1 mice with OT-I T cells
and then treated them with FTY-720 or left them untreated (Fig. 5A). The numbers of OT-I T cells expanding in the CLNs of FTY-720–treated K5.mOVA Xcr1Ab1 mice were almost similar C D CTV % of max CTRL K5.mOVA Xcr1DTA K5.mOVA CTRL 0.5 0.0 1.0 1.5 2.0 2.5 ** ** * CTV low OT-I per LN ( 1 × 10 6) B Xcr1Ab1 CTRL K5.mOVA Xcr1Ab1 K5.mOVA CTRL CTV % of max CTRLXcr1Ab1 0.0 0.5 1.0 1.5 CTV low OT-I per LN ( 1 × 10 4) 0 20 40 60 Expansion inde x OT-I * K5.mOVA CTRLXcr1Ab1 K5.mOVACTRLXcr 1Ab1 WT 0 10 20 30 40 Cell divisions
%OT-I in division cycl
e 1 2 3 4 5 6 7 8 0 * * * * * * K5.mOVA CTRL K5.mOVA Xcr1Ab1 IFN-CTV 8.6 0.1 89.2 1.7 18.3 0.01 80.8 0.3 K5.mOVA Xcr1Ab1 K5.mOVA CTRL 0 10 20 30 40 % of IFN-+ CTV low OT -I * K5.mOVA CTRLXcr1 Ab1 0 1 2 3 4 5 *
Proliferation index
OT-I K5.mOVA CTRLXcr1Ab1 Cutaneous LN analysis D3 OT-I T cells i.v.
Cutaneous LN analysis
D3 OT-I T cells i.v.
0 20 40 60 Replication index OT-I * K5.mOVA CTRLXcr1Ab1 CTRL K5.mOVACTRLXcr 1DTA WT A
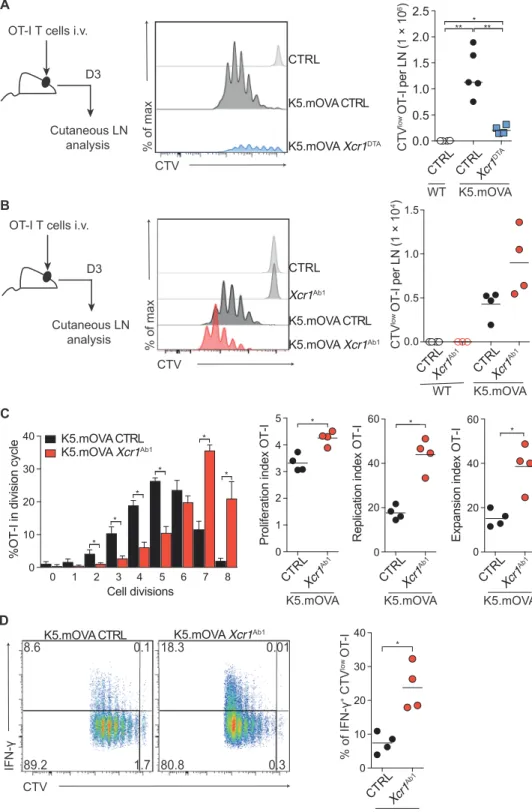
Fig. 3. MHCII-deficient cDC1s show enhanced cross-priming capacity toward a keratinocyte- expressed self-Ag. (A) CTV-labeled OT-I T cells
(1 × 10⁶) were transferred into CTRL, K5.mOVA,
or K5.mOVA Xcr1DTA hosts. CTV profiles and
ab-solute numbers of proliferating CTVlow OT-I T cells
found in the CLN 60 hours after transfer. In the plot shown in the right, each dot corresponds to a mouse and the means (horizontal bar) are indicated. Data are representative of three inde-pendent experiments with four mice per group. i.v., intravenously. (B) CTV profiles and absolute numbers of CTVlow proliferating OT-I T cells in
the CLN of CTRL, Xcr1Ab1, K5.mOVA, or K5.mOVA Xcr1Ab1 mice 60 hours after adoptive transfer.
(C) On the basis of the data shown in (B), the per-centage of proliferating CTVlow OT-I T cells in
each division cycle and the index of OT-I proliferation, replication, and expansion were calculated. (D) Pro-duction of IFN- by CTV-labeled OT-I T cells iso-lated from K5.mOVA and K5.mOVA Xcr1Ab1 mice
60 hours after adoptive transfer and after ex vivo restimulation. Also shown is the percentage of IFN-+CTVlow OT-I T cells. (B to D) Each dot
corre-sponds to a mouse and the means (horizontal bar) are indicated. Data are representative of three independent experiments with at least four mice per group. Samples were compared using two-tailed Student’s t test with Welch’s correction. *P < 0.05, **P < 0.01.
by guest on March 14, 2020
http://immunology.sciencemag.org/
to those of K5.mOVA Xcr1Ab1 mice (Fig. 5B). A large infiltrate of OT-I T cells was found in the skin of untreated K5.mOVA Xcr1Ab1
mice as compared with K5.mOVA mice. It was associated with
increased numbers of total CD4+ T cells that included FoxP3+CD4+ T cells and a massive infiltrate of monocytes and neutrophils (Fig. 5, C and D). FTY-720 treatment markedly decreased the
Fig. 4. Absence of MHCII mol-ecules on cDC1s results in le-thal autoimmune syndromes to keratinocyte-derived self- Ag. (A) Experimental outline
and percentage of disease- free K5.mOVA CTRL (black line) and K5.mOVA Xcr1Ab1 (red line)
mice after adoptive transfer of OT-I T cells. Disease-free mice correspond to mice show-ing no weight loss and no sign of skin lesions. (B) Changes in body weight of K5.mOVA CTRL (black line) and K5.mOVA Xcr1Ab1
(red line) mice after OT-I T cell transfer. Each line corresponds to one individual mouse. (C) Representative H&E-stained section of the esophagus of K5.mOVA CTRL and K5.mOVA Xcr1Ab1 mice that received
OT-I T cells (objective, 20×; scale bars, 100 m). (D) Mac-roscopic manifestations of the skin pathology developing in K5.mOVA Xcr1Ab1 mice after
OT-I T cell transfer as com-pared with K5.mOVA mice. In (B) to (E), data are represent-ative of n ≥ 3 independent experiments with n ≥ 3 mice per group. (E) Absolute num-bers of CTVlow proliferating
OT-I T cells in the CLNs of the specified mice. (F) CD62L versus CD44 expression of prolifer-ating OT-I T cells found in the CLNs of the specified mice and corresponding percentages of CD62L+CD44+ and CD62L−CD44+
cells among proliferating OT-I T cells. (G) TCF1 expression among proliferating OT-I T cells from the CLNs of the specified mice. Also shown is the percentage of TCF1− cells. (H) Ly108/SLAMF6
expression on proliferating OT-I T cells and percentage of Ly108− cells among
prolif-erating OT-I cells. (I) Represent-ative H&E-stained sections of the back of the skin of K5.mOVA CTRL and K5.mOVA Xcr1Ab1
mice that received OT-I T cells (objective, 20×; scale bars, 100 m). (J) Absolute
num-bers of skin-infiltrating OT-I T cells (Lin−TCR+CD3+CD5+CD8+V2+V5.1/2+) in 12-mm punch biopsies of back skin of the specified mice. In (B), Disease-free survival curves
were compared using log rank (Mantel-Cox) test. In (E) to (H) and (J), samples were compared using two-tailed Student’s t test with Welch’s correction. *P < 0.05, **P < 0.01. Data are representative of two independent experiments with n ≥ 3 mice per group.
by guest on March 14, 2020
http://immunology.sciencemag.org/
numbers of skin- infiltrating OT-I T cells, including those producing IFN-, CD4+ T cells, monocytes, and neutrophils as compared with untreated K5. mOVA Xcr1Ab1 mice (Fig. 5, C and D). As a result, FTY-720–treated K5.mOVA Xcr1Ab1 mice presented
neither a marked weight loss (Fig. 5E) nor skin lesions (Fig. 5F) as compared with untreated K5.mOVA Xcr1Ab1 mice. Therefore, the potent OT-I effector T cells that are induced in the draining LN of K5. mOVA Xcr1Ab1 mice in response to OVA cross- presented by MHCII-deficient cDC1s account for the early-onset and fatal autoimmunity observed in those mice. DISCUSSION
Original mouse models aiming at assessing the role of MHCII molecules in vivo led to their conditional deletion on B cells, DCs, macrophages, and thymic epithelial cells (24). A more recent study revealed that direct TCR-MHCII interactions between suppressive CD4+ T cells and CD11c+ cells were essential for
in-duction of peripheral CD8+ T cell tolerance (19). Considering that the MHCII+CD11c+ cells comprised
cDC2s, monocyte-derived DCs, macrophages, and pDC in addition to cDC1s, we generated mice in which cDC1s are specifically deprived of MHCII and analyzed whether they remained capable of tolerizing CD8+ T cells that
were either weakly or strongly autoreactive. Most of naïve T cells circulating in the periphery have been selected during thymic selection to be weakly autoreactive and continuously engage their TCR with self-peptide MHC complexes expressed by cDCs to maintain a state of heightened Ag sensitivity to foreign Ags (25–27). It has been argued that the need for such weak “tonic” TCR signals creates a potential threat that cannot be constrained by negative regulatory A Body weight Days 0 5 10 −60 −40 −20 0 20 % Change of bodyweight K5.mOVA Xcr1Ab1
OT-I T cells i.v.
Kinetics (0–11 days) K5.mOVA Xcr1Ab1 + FTY-720 FTY-720 i.p. Days 2, 4, 6, 8, and 10 Skin lesion IFN- + OT-I K5.mOVA Xcr1Ab1 + FTY-720 K5.mOVA Xcr1Ab1 K5.mOVA Monocytes Neutrophils 0 0.5 1.0 1.5 IFN -+ OT-I
per ear pair
( 1 × 10 5) *** ** No lesion K5.mOVA Xcr1Ab1 + FTY-720 K5.mOVA Xcr1Ab1 K5.mOVA lesion **** * Monocytes
per ear pair
( 1 × 10 5) 0 10 20 30 40 50 **** * Neutrophil s
per ear pair
( 1 × 10 5) 2 4 6 8 0 10 OT-I K5.mOVA Xcr1Ab1 + FTY-720 K5.mOVA Xcr1Ab1 K5.mOVA K5.mOVA Xcr1Ab1 + FTY-720 K5.mOVA Xcr1Ab1 K5.mOVA 12 74 62 19 56 19 CD8 CD4 87 17 14 Va2 CD45.1 28 CD8 IFN-γ CD11b Ly-6C 57 20 40 CD11b Ly-6G 1 8 3 0 2 4 6 8 10 12 *** ** OT-I
per ear pair
( 1 × 10 5 ) 0 5 10 15 20 OT-I per CLN ( 1 × 10 25 ** CD 4+ T cell s
per ear pair
( 1 × 10 4) 0 5 10 15 20 ** FoxP3+ CD4 T cells 40 31 29 CD4 FoxP3 2 4 6 8 FoxP3 + CD4 T cells
per ear pair(
1 × 10 4) 0 * F C D E 6)
B Fig. 5. Sequestering autoreactive OT-I T cells in the CLN of
K5.mOVA Xcr1Ab1 mice prevents unfolding of the lethal auto-immune syndrome. (A) Experimental outline. From day 2
post-adoptive transfer of OT-I T cells, mice were treated with FTY-720 to impair T cell egress from the CLNs. i.p., intraperitoneally. (B) Absolute numbers of OT-I T cells (Lin−TCR+CD3+CD8+
V2+CD45.1+) in the CLNs of the specified mice. (C) FACS
plots and absolute numbers of CD4+ T cells (Lin−TCR+CD3+CD4+),
OT-I T cells (Lin−TCR+CD3+CD8+V2+CD45.1+), and IFN-+ OT-I
T cells found in the ear skin of the specified mice. (D) FACS plots and absolute numbers of monocytes (Ly-6G−Lin−CD24−
CD11b+Ly-6C+CD64lowto+) and neutrophils (Lin−CD11b+Ly-6G+) in
the ear skin of the specified mice. (E) Changes in body weight of FTY-720–untreated K5.mOVA Xcr1Ab1 (red line) and FTY-720–
treated K5.mOVA Xcr1Ab1 (black line) mice after OT-I T cell transfer.
Each line corresponds to one individual mouse. (F) Presence of macroscopic skin lesions in K5.mOVA CTRL, FTY-720–untreated K5.mOVA Xcr1Ab1, and FTY-720–treated K5.mOVA Xcr1Ab1 mice
that received OT-I T cells. In (B) to (D), samples were compared using two-tailed Student’s t test with Welch’s correction. *P < 0.05, **P < 0.01, ***P < 0.001, ****P < 0.0001. Data are pooled from two independent experiments with n ≥ 2 mice per group.
by guest on March 14, 2020
http://immunology.sciencemag.org/
mechanisms intrinsic to conventional naïve T cells and that such risk is buffered by the suppressive action of Treg cells (28, 29).
Accordingly, after homeostatic maturation, cDCs serve as information- transmission platform favoring the encounter of Treg cells and naïve
T cells (30). As a result, Treg cells down-regulate the levels of CD80/
CD86 ligands available on cDCs via transendocytosis, thereby in-creasing the threshold above which TCR signals must rise to trigger a productive response in naïve T cells (20, 29, 31, 32). Treg cells can
also consume interleukin-2 (IL-2) to suppress activation of neigh-boring naïve CD8+ T cells and suppress naïve CD4+ T cells using
pathways other than IL-2 consumption (28).
By depriving cDC1s of MHCII molecules and preventing them from receiving suppressive Treg cell inputs, the first objective of the present
study was to determine whether cDC1s lose their tolerogenicity and instead trigger the differentiation of the weakly self-reactive naïve CD8+ T cells that populate the periphery into effector cells capable
of inducing autoimmunity. A twofold increase in the percentage of CD62L−CD44+PD-1+ effector memory CD8+ T cells was noted in
mice containing MHCII-deficient cDC1s, which did not, however, result in inflammation or autoimmunity when mice were analyzed for up to 52 weeks. Treg cells isolated from mice with MHCII-deficient
cDC1s were as effective as Treg cells isolated from CTRL mice in
sup-pressing proliferation, suggesting that expression of MHCII on cDC2s sufficed to select and maintain normal numbers of Treg cells with
intact suppressive capacity. In support of that view, mice lacking MHCII on both cDC1s and cDC2s exhibited profound intestinal inflammation (33) and thus markedly differed from mice with MHCII-deficient cDC1s. Peptide MHCI tetramer-based studies showed that central tolerance is much less complete than previously anticipated in that strongly autoreactive CD8+ T cells specific for the Y chromosome–encoded
selected mouse cDNA on Y (SMCY) Ag are found in the periphery of male individuals. They showed a threefold lower frequency as compared with female individuals and had a TCR affinity distribution overlapping that of female individuals (34). Considering that such strongly autoreactive CD8+ T cells are likely under control of Ag-specific Treg cells (31, 35), the second objective of the present work was to
assess whether MHCII- deficient cDC1s maturing under homeostatic conditions were capable of tolerizing strongly autoreactive CD8+ T cells.
In the case where mice specifically lack MHCII molecules on cDC1s, CD8+ T cells with a strong affinity for self-Ag presented on both cDC1s
and cDC2s will undergo both cDC2-mediated tolerizing encounters and cDC1- mediated nontolerizing encounters. On the basis of previous experiments using bone marrow chimeras (19), it can be surmised that tolerization will constitute the net result. In contrast, provided that cDC1s lack MHCII molecules and that the strongly au-toreactive CD8+ T cells recognize self-Ag that are solely presented
on cDC1s, only cDC1-mediated nontolerizing encounters will en-sue, resulting in cytotoxic T lymphocyte-mediated autoimmunity. To model this last condition, we exploited the fact that the cDC1s found in K5.mOVA mice are the sole skin cDCs capable of cross-tolerizing strongly reactive OT-I CD8+ T cells toward keratinocyte-expressed OVA (6, 7). Note that, in our model, the frequency of OT-I precursors achieved upon adoptive transfer overrides CD4+ T cell help (36, 37), making cDC1s only sensitive to Treg cell input. When K5.mOVA mice
were adoptively transferred with OT-I T cells, their MHCII+ cDC1 were capable to cope with such frequency of strongly autoreactive T cell pre-cursors in that their skin showed only transient microscopic lesions that contained apoptotic keratinocytes and resolved upon time (5). In contrast, MHCII-deficient cDC1s cross-primed OT-I T cells into
effectors responsible for lethal autoimmunity. Supporting the view that it is the lack of Treg cell inputs on OVA-laden, MHCII-deficient
cDC1s that accounted for the ensuing fatal autoimmunity, the skin lesions observed in these animals closely resembled those of athymic K5.mOVA mice adoptively transferred with OT-I T cells in absence of Treg cells (38).
In conclusion, we established that, under homeostatic conditions, tissue-resident cDC1s mature and migrate to draining LN irrespective of CD4+ T cell–cDC1 interactions. However, proper execution of their tolerogenic function in the draining LN requires MHCII-restricted interactions with Treg cells. The need for Treg cell–cDC interaction
was found particularly important for tolerizing the strongly auto-reactive CD8+ T that escape thymic selection (34). Further studies will be necessary to test whether our observation extends to models other than the K5.mOVA OT-I model used in the present study. Therefore, consistent with recent studies (9, 39), cDC maturation should not be viewed as a binary “on-off” event but rather as an extended, multistep process that initiates in tissue parenchyma and continues in tissue-draining LN via the integration of extrinsic sig-nals that are delivered by Treg cells and CD4+ helper T cells (40) and
determines the final capacity of a given DC to perform tolerogenic or immunogenic functions, respectively. Future studies should help to further define at the system levels, the transcriptional, translational, and posttranslational changes that occur in cDC1s as a result of their interaction with Treg cells.
MATERIALS AND METHODS Study design
The objective of the present study was to determine whether pre-venting cDC1s to receive suppressive Treg inputs abolishes their
capacity of tolerizing autoreactive CD8+ T cells. Accordingly, we
developed a mouse model in which cDC1s specifically lacked MHCII and backcrossed it to K5.mOVA transgenic mice that express a cell membrane–bound form of OVA in skin keratinocytes. Experiments were designed to validate the model and gauge whether OVA-laden, MHCII-deficient cDC1s lose their capacity of cross-tolerizing adoptively transferred CD8+ T cells specific for OVA. The number of mice per
experimental group and the number of repetitions of the experi-ments are indicated in the individual figure legends.
Mice
Generation of Xcr1Cre-mTFP1 mice is described below. H2-Ab1fl (B6.129X1-H2-Ab1tm1Koni/J), Rosa26LSL-DTA [B6.129P2-Gt(ROSA) 26Sortm1(DTA)Lky/J], Rosa26LSL-tdRFP [Gt(ROSA)26Sortm1Hjf], and K5.mOVA mice were previously described (5, 17, 41, 42). All mice were main-tained on C57BL/6 (B6) background. OT-I mice (43) were kept on a CD45.1/CD45.2 B6 background. CD45.1 B6 mice were from Charles River. Mice were housed under specific pathogen-free con-ditions, and in vivo procedures were performed following protocols approved by the Ethics Committee of Marseille in accordance with institutional, national, and European directives for animal care (approval APAFIS 779-2015 0605 10534083).
Generation of Xcr1-IRES-iCre-GSG-2A-mTFP1 mice
A targeting construct was designed to introduce an IRES-iCre-GSG-2A-mTFP1 cassette in the 3′ untranslated region of the Xcr1 gene, 29–base pair (bp) downstream of the stop codon. IRES corre-sponds to an IRES, iCre to a sequence coding for a iCre (44), 2A to
by guest on March 14, 2020
http://immunology.sciencemag.org/
the sequence coding for a self-cleaving 2A peptide, and mTFP1 to a sequence coding for a monomeric, bright, and photostable version of Clavularia cyan fluorescent protein (45). JM8.F6 C57BL/6N embryonic stem (ES) cells (46) were electroporated with the targeting vector. After selection in G418, ES cell clones were screened for proper homologous recombination by polymerase chain reaction and Southern blot. Properly recombined ES cells were injected into FVB blastocysts. After germline transmission, excision of the frt-neor-frt
cassette was achieved through crossing with mice expressing an FLP recombinase (47). Two pairs of primers were used to distinguish the wild-type (WT) and edited Xcr1 alleles. The first pair (sense, 5′-TCCTGAAAACTGGAATCATC-3′; antisense, 5′-TTTTCTTTCT-GTAGCTGCTAAG-3′) amplified a 635-bp band in case of the WT Xcr1 allele, whereas the second pair (sense, 5′-TCTACGAGATA-CACCTCAAG-3′; antisense, 5′-TTTTCTTTCTGTAGCTGCTAAG-3′) amplified a 775-bp band in the case of the Xcr1-IRES-iCre-GSG-2A-mTFP1 allele.
Detection of germline deletion in Xcr1RFP and Xcr1Ab1 mice
In both Xcr1RFP and Xcr1Ab1 models, mice with adventitious
germ-line deletion were excluded from our study. Accordingly, flow cytometry analysis was used to check whether RFP was ubiquitously expressed in blood cells of Xcr1RFP mice or whether MHCII mole-cules were lacking at the surface of B cells from the blood of Xcr1Ab1
mice. Germline deletion in Xcr1Ab1 mice was further tested by tail DNA genotyping using sense (5′-AAGCCAGGAAGGGACCA-GAGCCTCT-3′) and antisense (5′-TTGCCAGTTTCTGCTAC-CCCACCC-3′) primers, allowing to detect a 4642-bp band and a 398-bp band corresponding loxP-flanked and floxed H2-Ab1fl alleles, respectively.
Cell preparations and isolation from tissues
Cells were isolated from the ear skin as described (48). Briefly, ears were incubated for 105 min at 37°C in RPMI 1640 containing Liberase TL (0.25 mg/ml; Roche Diagnostic Corp.) and deoxyribonuclease I (DNase I) (0.5 mg/ml; Sigma-Aldrich). Digested tissue was homo-genized using Medicons and Medimachine (BD Biosciences). To isolate cells from the skin of the mouse back, the skin was digested in RPMI with Liberase TL and DNase and homogenized using C tube and gentleMACS Dissociator (Miltenyi Biotec). For isolation of cells from the spleen and LN, organs were cut into small pieces and digested for 25 min at 37°C with type II collagenase (Worthington Biochemical) and DNase I in 2% fetal bovine serum (FBS) RPMI. Red blood cells of the spleen were lysed using the Red Blood Cell Lysis Buffer (eBioscience). For isolation of cells from the lamina propria of the large intestine, the intestinal tissue was opened longi-tudinally, cut into pieces, and washed in Hanks’ balanced salt solu-tion (HBSS). The epithelial cell layer was isolated by two consecutive incubations of 20 and 30 min, respectively, in HBSS containing 2 mM EDTA. Then, pieces of intestinal tissue were washed twice in HBSS and digested in RPMI medium containing 10% FBS, collage-nase 8 (1 mg/ml; Sigma-Aldrich), and DNAse I (30 ng/ml). Tissue was homogenized in C tube and gentleMACS Dissociator. Light density cells were purified by centrifugation on a 70 to 40% Percoll gradient. For isolation of cells from the lung, perfused organs were cut into small pieces and digested for 40 min at 37°C with a mixture of type IV collagenase (Worthington Biochemical) and DNase I in RPMI medium containing 2% FBS on a shaker. Tissue was homo-genized in C tube and gentleMACS Dissociator.
Flow cytometry
For surface staining, cells were preincubated with anti-Fc receptor antibody (clone 2.4G2) and stained with appropriate antibodies in phosphate-buffered saline containing 5 mM EDTA and 2% FBS at 4°C for 25 min. Viability was assessed by staining with 4′,6-diamidino- 2-phenylindole (Thermo Fisher Scientific) or Fixable LIVE/DEAD Blue or Aqua Cell Stain (Molecular Probes). For intracellular cyto-kine staining, cells were stained with antibodies against surface markers and then fixed with 2% (w/v) paraformaldehyde for 12 min at 25°C and permeabilized using Permeabilization Buffer (Invitrogen). Cells were subsequently stained with anti–IFN- antibody for 60 min at 4°C. For intranuclear staining, cells were stained with antibodies against the specified surface markers, and fixation-permeabilization was performed using the Transcription Factor Kit (Invitrogen) according to the manufacturer’s instructions. Flow cytometry was performed on fluorescence-activated cell sorting (FACS) LSRII or LSRFortessa X-20 systems (BD Biosciences), and data were ana-lyzed with FlowJo software (FlowJo LLC). Doublets and dead cells were excluded from analyses. For the analysis of DCs, neutrophils, B cells, T cells, and NK cells were gated out using a Lin− gate (CD3−,
CD19−, CD161−, and Ly-6G−). For the analysis of skin T cells, MHCII+ cells, CD11b+ myeloid cells, neutrophils, and NK cells were
systematically gated out using a Lin− gate (MHCII−, CD11b−, CD161−, and Ly-6G−). Antibodies used are listed in table S1. Biotin-conjugated
antibodies were detected using streptavidin-conjugated Brillant UltraViolet 395 (BUV395), R-phycoerythrin-CF594 (PE-CF594) or R-phycoerythrin-cyanine dye Cy7 (PE-Cy7) (BD Biosciences). The gating strategies for DC subsets, B cells, and neutrophils on Figs. 1 and 2 (B to D and G to I) and fig. S3 (A to C and G to I) are shown in fig. S2 (A and B).
OT-I T cell transfer and analysis of OT-I proliferation
OT-I naïve CD8+ T cells were isolated from LNs and the spleen of 6- to 12-week-old CD45.1/CD45.2 OT-I mice, using a negative CD8 isolation kit (Invitrogen). T cells were stained with 5 M CellTrace Violet (CTV; Molecular Probes). To analyze OVA cross-presentation in the K5.mOVA model, 1 × 10⁶ or 2.5 × 10⁶ naïve OT-I T cells were transferred intravenously. Proliferation of OT-I T cells in CLNs (corresponding to a pool of inguinal, auricular, and brachial LN unless specified) and skin infiltration were analyzed either 60 hours or 8 to 11 days later using flow cytometry. OT-I T cells were identified on the basis of their Lin−TCR+CD5+CD8+V2+V5.1/2+ CD45.1+CD45.2+
phenotype. Proliferation, replication, and expansion indexes were calculated using FloJo software (FlowJo LLC).
Assay for the in vitro suppressive capacity of Treg cells
Mouse LN and spleen single-cell suspensions were enriched for CD4+ T cells by negative CD4 isolation (Invitrogen). Cells were stained
with monoclonal antibody (mAb) to CD5, CD4, and CD25, as detailed above. CD4+CD25+ T
reg cells from CTRL and Xcr1Ab1 mice
and conventional CD4+CD25− T cells (responder) were sorted using a FACSAria Special Order Research Product (BD Biosciences). Cell purity was >98%. CD4+CD25− T cells were labeled with 5 M CTV (Molecular Probes). CD4+CD25− WT T cells (5 × 10⁴ cells per well)
were cultured in 96-well U-bottom plates with or without Treg cells
at responder to Treg ratios of 1:0, 1:1, 1:2, 2:1, 4:4, 8:1, and 16:1 in
the presence of irradiated (25 gray) syngeneic T cell–depleted spleno-cytes (5 × 10⁴ cells per well) (Corning) and anti-CD3 mAb (0.5 g/ml;
clone 145-2C11, EXBIO). Cells were collected after 60 hours, and
by guest on March 14, 2020
http://immunology.sciencemag.org/
cell division was measured by assessing relative CTV dilution on a Fortessa X20 systems (BD Biosciences).
Ex vivo restimulation of OT-I T cells
For intracellular cytokine staining, cells from the CLN or skin were isolated 60 hours or 8 to 11 days after adoptive transfer of OT-I T cells. Cells were cultured for 4 hours in RPMI 1640 plus 10% FBS con-taining OVA peptide (257 to 264) (1 g/ml). Brefeldin A (10 mg/ml) was added after the first hour of culture. Then, cells were surface stained to identify OT-I (Lin−TCR+CD5+CD8+V2+V5.1/2+CD45.1+CD45.2+)
cells and subsequently stained intracellularly with anti–IFN- antibody.
Lymphocyte sequestration in the CLN
Mice received an intraperitoneal injection of 100 g of FTY-720 (Cayman Chemical Company) as specified.
Histology
Biopsies from the skin of the back or the esophagus were incubated for 45 min at 4°C with Antigenfix (Diapath) washed with 0.1 M phosphate-buffered saline (pH 7.4) for 45 min at 4°C and subsequently with 30% (w/v) sucrose for 12 hours at 4°C and subsequently em-bedded in Tissue-Tek optimum cutting temperature (O.C.T., Sakura), snap-frozen, and stored at −20°C until use. Eight-micrometer cryo-sections of the skin were cut using a cryostat (Jung Frigocut CM35000 S, Leica). Sections were stained with hematoxylin and eosin (H&E).
Small intestine biopsies were fixed in 10% neutral buffered formalin (Microm Microtech) for 24 hours, dehydrated, and embedded in paraffin (Thermo Fisher Scientific). Microtome sections (Leica RM2245, Leica) of 3.5 m were stained (H&E) staining using Leica Autostainer XL (Leica). Slides were mounted with Entellan (VWR) and kept at room temperature.
Statistical analyses
Statistical significance was determined using two-tailed Student’s t tests with Welch’s correction, one- or two-way analysis of variance (ANOVA) test, with or without Sidak correction for multiple testing, or log rank (Mantel-Cox) as specified in individual figure legends. Points in graphs indicate either individual mice or a quadruplicate well, and lines indicate means or medians. In bar graphs, bars indi-cate means, and error bars indiindi-cate SD. Analysis was performed using GraphPad Prism software. P < 0.05 was considered statistically significant.
SUPPLEMENTARY MATERIALS
immunology.sciencemag.org/cgi/content/full/5/45/eaba1896/DC1
Fig. S1. Expression of the mTFP1 fluorescent reporter and Cre activity are restricted to cDC1 of Xcr1Cre-mTFP1 mice.
Fig. S2. Gating strategies used for identifying the myeloid cell subsets found in the spleen, gut, skin, CLN, and lung.
Fig. S3. Absence of MHCII on cDC1s results in a higher frequency of effector memory CD8+ T cells in the CLN and lung.
Fig. S4. Xcr1DTA mice permit constitutive cDC1 ablation. Table S1. List of antibodies used in the study. Data file S1. Raw data.
References (49–51)
View/request a protocol for this paper from Bio-protocol. REFERENCES AND NOTES
1. M. Guilliams, C.-A. Dutertre, C. L. Scott, N. McGovern, D. Sichien, S. Chakarov, S. Van Gassen, J. Chen, M. Poidinger, S. De Prijck, S. J. Tavernier, I. Low, S. E. Irac, C. N. Mattar,
H. R. Sumatoh, G. H. L. Low, T. J. K. Chung, D. K. H. Chan, K. K. Tan, T. L. K. Hon, E. Fossum, B. Bogen, M. Choolani, J. K. Y. Chan, A. Larbi, H. Luche, S. Henri, Y. Saeys, E. W. Newell, B. N. Lambrecht, B. Malissen, F. Ginhoux, Unsupervised high-dimensional analysis aligns dendritic cells across tissues and species. Immunity 45, 669–684 (2016).
2. D. S. Leventhal, D. C. Gilmore, J. M. Berger, S. Nishi, V. Lee, S. Malchow, D. E. Kline, J. Kline, D. J. Vander Griend, H. Huang, N. D. Socci, P. A. Savage, Dendritic cells coordinate the development and homeostasis of organ-specific regulatory T cells. Immunity 44, 847–859 (2016).
3. A. G. Levine, S. Hemmers, A. P. Baptista, M. Schizas, M. B. Faire, B. Moltedo, C. Konopacki, M. Schmidt-Supprian, R. N. Germain, P. M. Treuting, A. Y. Rudensky, Suppression of lethal autoimmunity by regulatory T cells with a single TCR specificity. J. Exp. Med. 214, 609–622 (2017).
4. V. Durai, K. M. Murphy, Functions of murine dendritic cells. Immunity 45, 719–736 (2016). 5. H. Azukizawa, H. Kosaka, S. Sano, W. R. Heath, I. Takahashi, X. H. Gao, Y. Sumikawa,
M. Okabe, K. Yoshikawa, S. Itami, Induction of T-cell-mediated skin disease specific for antigen transgenically expressed in keratinocytes. Eur. J. Immunol. 33, 1879–1888 (2003).
6. S. Bedoui, P. G. Whitney, J. Waithman, L. Eidsmo, L. Wakim, I. Caminschi, R. S. Allan, M. Wojtasiak, K. Shortman, F. R. Carbone, A. G. Brooks, W. R. Heath, Cross-presentation of viral and self antigens by skin-derived CD103+ dendritic cells. Nat. Immunol. 10, 488–495 (2009).
7. S. Henri, L. F. Poulin, S. Tamoutounour, L. Ardouin, M. Guilliams, B. de Bovis, E. Devilard, C. Viret, H. Azukizawa, A. Kissenpfennig, B. Malissen, CD207+ CD103+ dermal dendritic cells cross-present keratinocyte-derived antigens irrespective of the presence of Langerhans cells. J. Exp. Med. 207, 189–206 (2010).
8. J. Waithman, R. S. Allan, H. Kosaka, H. Azukizawa, K. Shortman, M. B. Lutz, W. R. Heath, F. R. Carbone, G. T. Belz, Skin-derived dendritic cells can mediate deletional tolerance of class I-restricted self-reactive T cells. J. Immunol. 179, 4535–4541 (2007). 9. L. Ardouin, H. Luche, R. Chelbi, S. Carpentier, A. Shawket, F. Montanana Sanchis,
C. Santa Maria, P. Grenot, Y. Alexandre, C. Gregoire, A. Fries, T.-P. Vu Manh,
S. Tamoutounour, K. Crozat, E. Tomasello, A. Jorquera, E. Fossum, B. Bogen, H. Azukizawa, M. Bajenoff, S. Henri, M. Dalod, B. Malissen, Broad and largely concordant molecular changes characterize tolerogenic and immunogenic dendritic cell maturation in thymus and periphery. Immunity 45, 305–318 (2016).
10. K. Crozat, R. Guiton, V. Contreras, V. Feuillet, C.-A. Dutertre, E. Ventre, T.-P. Vu Manh, T. Baranek, A. K. Storset, J. Marvel, P. Boudinot, A. Hosmalin, I. Schwartz-Cornil, M. Dalod, The XC chemokine receptor 1 is a conserved selective marker of mammalian cells homologous to mouse CD8+ dendritic cells. J. Exp. Med. 207, 1283–1292 (2010). 11. B. G. Dorner, M. B. Dorner, X. Zhou, C. Opitz, A. Mora, S. Güttler, A. Hutloff, H. W. Mages,
K. Ranke, M. Schaefer, R. S. Jack, V. Henn, R. A. Kroczek, Selective expression of the chemokine receptor XCR1 on cross-presenting dendritic cells determines cooperation with CD8+ T cells. Immunity 31, 823–833 (2009).
12. Y. O. Alexandre, S. Ghilas, C. Sanchez, A. Le Bon, K. Crozat, M. Dalod, XCR1+ dendritic cells promote memory CD8+ T cell recall upon secondary infections with Listeria
monocytogenes or certain viruses. J. Exp. Med. 213, 75–92 (2016).
13. J. P. Böttcher, E. Bonavita, P. Chakravarty, H. Blees, M. Cabeza-Cabrerizo, S. Sammicheli, N. C. Rogers, E. Sahai, S. Zelenay, C. Reis e Sousa, NK cells stimulate recruitment of cDC1 into the tumor microenvironment promoting cancer immune control. Cell 172, 1022–1037.e14 (2018).
14. A. Brewitz, S. Eickhoff, S. Dähling, T. Quast, S. Bedoui, R. A. Kroczek, C. Kurts, N. Garbi, W. Barchet, M. Iannacone, F. Klauschen, W. Kolanus, T. Kaisho, M. Colonna, R. N. Germain, W. Kastenmüller, CD8+ T cells orchestrate pDC-XCR1+ dendritic cell spatial and functional cooperativity to optimize priming. Immunity 46, 205–219 (2017).
15. T. Ohta, M. Sugiyama, H. Hemmi, C. Yamazaki, S. Okura, I. Sasaki, Y. Fukuda, T. Orimo, K. J. Ishii, K. Hoshino, F. Ginhoux, T. Kaisho, Crucial roles of expressing dendritic cells and the XCR1-XCL1 chemokine axis in intestinal immune homeostasis. Sci. Rep. 6, 23505 (2016).
16. B. Becher, A. Waisman, L.-F. Lu, Conditional gene-targeting in mice: Problems and solutions. Immunity 48, 835–836 (2018).
17. K. Hashimoto, S. K. Joshi, P. A. Koni, A conditional null allele of the major histocompatibility IA-beta chain gene. Genesis 32, 152–153 (2002).
18. S. Mundt, D. Mrdjen, S. G. Utz, M. Greter, B. Schreiner, B. Becher, Conventional DCs sample and present myelin antigens in the healthy CNS and allow parenchymal T cell entry to initiate neuroinflammation. Sci. Immunol. 4, eaau8380 (2019).
19. S. Muth, K. Schutze, H. Schild, H. C. Probst, Release of dendritic cells from cognate CD4+ T-cell recognition results in impaired peripheral tolerance and fatal cytotoxic T-cell mediated autoimmunity. Proc. Natl. Acad. Sci. U.S.A. 109, 9059–9064 (2012). 20. H. A. Bolton, E. Zhu, A. M. Terry, T. V. Guy, W.-P. Koh, S.-Y. Tan, C. A. Power, P. Bertolino,
K. Lahl, T. Sparwasser, E. Shklovskaya, B. Fazekas de St Groth, Selective Treg reconstitution during lymphopenia normalizes DC costimulation and prevents graft-versus-host disease. J. Clin. Invest. 125, 3627–3641 (2015).
21. M. Danilo, V. Chennupati, J. G. Silva, S. Siegert, W. Held, Suppression of Tcf1 by inflammatory cytokines facilitates effector CD8 T cell differentiation. Cell Rep. 22, 2107–2117 (2018).
by guest on March 14, 2020
http://immunology.sciencemag.org/
22. N. Wang, M. Keszei, P. Halibozek, B. Yigit, P. Engel, C. Terhorst, Slamf6 negatively regulates autoimmunity. Clin. Immunol. 173, 19–26 (2016).
23. M. Matloubian, C. G. Lo, G. Cinamon, M. J. Lesneski, Y. Xu, V. Brinkmann, M. L. Allende, R. L. Proia, J. G. Cyster, Lymphocyte egress from thymus and peripheral lymphoid organs is dependent on S1P receptor 1. Nature 427, 355–360 (2004).
24. L. Madsen, N. Labrecque, J. Engberg, A. Dierich, A. Svejgaard, C. Benoist, D. Mathis, L. Fugger, Mice lacking all conventional MHC class II genes. Proc. Natl. Acad. Sci. U.S.A. 96, 10338–10343 (1999).
25. K. Hochweller, G. H. Wabnitz, Y. Samstag, J. Suffner, G. J. Hämmerling, N. Garbi, Dendritic cells control T cell tonic signaling required for responsiveness to foreign antigen. Proc. Natl. Acad. Sci. U.S.A. 107, 5931–5936 (2010).
26. K. A. Hogquist, S. C. Jameson, The self-obsession of T cells: How TCR signaling thresholds affect fate 'decisions' and effector function. Nat. Immunol. 15, 815–823 (2014). 27. I. Stefanová, J. R. Dorfman, R. N. Germain, Self-recognition promotes the foreign antigen
sensitivity of naive T lymphocytes. Nature 420, 429–434 (2002).
28. T. Chinen, P. Y. Volchkov, A. V. Chervonsky, A. Y. Rudensky, A critical role for regulatory T cell–mediated control of inflammation in the absence of commensal microbiota. J. Exp. Med. 207, 2323–2330 (2010).
29. J. Yi, J. Jung, S.-W. Hong, J. Y. Lee, D. Han, K. S. Kim, J. Sprent, C. D. Surh, Unregulated antigen-presenting cell activation by T cells breaks self tolerance. Proc. Natl. Acad. Sci. U.S.A. 116, 1007–1016 (2019).
30. J. Liu, X. Cao, Regulatory dendritic cells in autoimmunity: A comprehensive review. J. Autoimmun. 63, 1–12 (2015).
31. Y. Maeda, H. Nishikawa, D. Sugiyama, D. Ha, M. Hamaguchi, T. Saito, M. Nishioka, J. B. Wing, D. Adeegbe, I. Katayama, S. Sakaguchi, Detection of self-reactive CD8+ T cells with an anergic phenotype in healthy individuals. Science 346, 1536–1540 (2014). 32. O. S. Qureshi, Y. Zheng, K. Nakamura, K. Attridge, C. Manzotti, E. M. Schmidt, J. Baker,
L. E. Jeffery, S. Kaur, Z. Briggs, T. Z. Hou, C. E. Futter, G. Anderson, L. S. K. Walker, D. M. Sansom, Trans-endocytosis of CD80 and CD86: A molecular basis for the cell-extrinsic function of CTLA-4. Science 332, 600–603 (2011).
33. J. Loschko, H. A. Schreiber, G. J. Rieke, D. Esterházy, M. M. Meredith, V. A. Pedicord, K.-H. Yao, S. Caballero, E. G. Pamer, D. Mucida, M. C. Nussenzweig, Absence of MHC class II on cDCs results in microbial-dependent intestinal inflammation. J. Exp. Med. 213, 517–534 (2016).
34. W. Yu, N. Jiang, P. J. R. Ebert, B. A. Kidd, S. Müller, P. J. Lund, J. Juang, K. Adachi, T. Tse, M. E. Birnbaum, E. W. Newell, D. M. Wilson, G. M. Grotenbreg, S. Valitutti, S. R. Quake, M. M. Davis, Clonal deletion prunes but does not eliminate self-specific CD8+ T lymphocytes. Immunity 42, 929–941 (2015).
35. F. P. Legoux, J.-B. Lim, A. W. Cauley, S. Dikiy, J. Ertelt, T. J. Mariani, T. Sparwasser, S. S. Way, J. J. Moon, CD4+ T cell tolerance to tissue-restricted self antigens is mediated by antigen-specific regulatory T cells rather than deletion. Immunity 43, 896–908 (2015). 36. J. K. Broom, A. M. Lew, H. Azukizawa, T. J. Kenna, G. R. Leggatt, I. H. Frazer,
Antigen-specific CD4 cells assist CD8 T-effector cells in eliminating keratinocytes. J. Invest. Dermatol. 130, 1581–1589 (2010).
37. J. D. Mintern, G. M. Davey, G. T. Belz, F. R. Carbone, W. R. Heath, Cutting edge: Precursor frequency affects the helper dependence of cytotoxic T cells. J. Immunol. 168, 977–980 (2002). 38. H. Azukizawa, S. Sano, H. Kosaka, Y. Sumikawa, S. Itami, Prevention of toxic epidermal
necrolysis by regulatory T cells. Eur. J. Immunol. 35, 1722–1730 (2005).
39. B. Vander Lugt, J. Riddell, A. A. Khan, J. A. Hackney, J. Lesch, J. DeVoss, M. T. Weirauch, H. Singh, I. Mellman, Transcriptional determinants of tolerogenic and immunogenic states during dendritic cell maturation. J. Cell Biol. 216, 779–792 (2017).
40. T. Ahrends, A. Spanjaard, B. Pilzecker, N. Babala, A. Bovens, Y. Xiao, H. Jacobs, J. Borst, CD4+ T cell help confers a cytotoxic T cell effector program including coinhibitory receptor downregulation and increased tissue invasiveness. Immunity 47, 848–861.e5 (2017). 41. H. Luche, O. Weber, T. Nageswara Rao, C. Blum, H. J. Fehling, Faithful activation
of an extra-bright red fluorescent protein in "knock-in" Cre-reporter mice ideally suited for lineage tracing studies. Eur. J. Immunol. 37, 43–53 (2007).
42. D. Voehringer, H.-E. Liang, R. M. Locksley, Homeostasis and effector function of lymphopenia-induced “memory-like” T cells in constitutively T cell-depleted mice. J. Immunol. 180, 4742–4753 (2008).
43. K. A. Hogquist, S. C. Jameson, W. R. Heath, J. L. Howard, M. J. Bevan, F. R. Carbone, T cell receptor antagonist peptides induce positive selection. Cell 76, 17–27 (1994). 44. D. R. Shimshek, J. Kim, M. R. Hübner, D. J. Spergel, F. Buchholz, E. Casanova, A. F. Stewart,
P. H. Seeburg, R. Sprengel, Codon-improved Cre recombinase (iCre) expression in the mouse. Genesis 32, 19–26 (2002).
45. H.-w. Ai, J. N. Henderson, S. J. Remington, R. E. Campbell, Directed evolution of a monomeric, bright and photostable version of Clavularia cyan fluorescent protein: Structural characterization and applications in fluorescence imaging. Biochem. J. 400, 531–540 (2006). 46. S. J. Pettitt, Q. Liang, X. Y. Rairdan, J. L. Moran, H. M. Prosser, D. R. Beier, K. C. Lloyd,
A. Bradley, W. C. Skarnes, Agouti C57BL/6N embryonic stem cells for mouse genetic resources. Nat. Methods 6, 493–495 (2009).
47. C. I. Rodriguez, F. Buchholz, J. Galloway, R. Sequerra, J. Kasper, R. Ayala, A. F. Stewart, S. M. Dymecki, High-efficiency deleter mice show that FLPe is an alternative to Cre-loxP. Nat. Genet. 25, 139–140 (2000).
48. N. Bouladoux, C. Hennequin, C. Malosse, B. Malissen, Y. Belkaid, S. Henri, Hapten-specific T cell-mediated skin inflammation: Flow cytometry analysis of mouse skin inflammatory infiltrate. Methods Mol. Biol. 1559, 21–36 (2017).
49. A. Bachem, E. Hartung, S. Güttler, A. Mora, X. Zhou, A. Hegemann, M. Plantinga, E. Mazzini, P. Stoitzner, S. Gurka, V. Henn, H. W. Mages, R. A. Kroczek, Expression of XCR1 characterizes the Batf3-dependent lineage of dendritic cells capable of antigen cross-presentation. Front. Immunol. 3, 214 (2012).
50. L. Bar-On, T. Birnberg, K. L. Lewis, B. T. Edelson, D. Bruder, K. Hildner, J. Buer, K. M. Murphy, B. Reizis, S. Jung, CX3CR1+ CD8+ dendritic cells are a steady-state population related to plasmacytoid dendritic cells. Proc. Natl. Acad. Sci. U.S.A. 107, 14745–14750 (2010). 51. B. Malissen, S. Tamoutounour, S. Henri, The origins and functions of dendritic cells
and macrophages in the skin. Nat. Rev. Immunol. 14, 417–428 (2014).
Acknowledgments: We thank H. Azukizawa for the K5.mOVA mice; N. Philippe for blastocyst microinjection; K. Djenad, H. Luche, and S. Tamoutounour for help in characterizing Xcr1Cre-mTFP1 mice; C. Pierini-Malosse for technical assistance; the CIML flow cytometry facility;
and L. Chasson for histology. Funding: This work was supported by CNRS, INSERM, PHENOMIN-CIPHE, the European Research Council (ERC) under the European Union’s Horizon 2020 research and innovation program [grant agreement no. 787300 (BASILIC) to B.M.], ERA-NET Infect-ERA (ABIR: ANR-13-IFEC-0005-03 to B.M.), the DCBIOL LabEx (grants ANR-11-LABEX-0043 and ANR-10-IDEX-0001-02 PSL), the A*Midex project (ANR-11-IDEX-0001-02), and by the Fondation ARC pour la recherche sur le cancer (grant PJA 20161205004 to S.H.). C.W. is supported by a fellowship from Fondation ARC pour la recherche sur le cancer. V.L.G. is supported by a fellowship from Takeda Pharmaceuticals. Author contributions: C.W., S.H., and B.M. conceived the project. F.F. and B.M. developed the Xcr1Cre-mTFP1 mouse model. C.W. and V.L.G. performed the experiments with the technical assistance of O.V. C.W. and S.H. did the statistical analysis. C.W., S.H., and B.M. wrote the manuscript. Competing interests: The authors declare that they have no competing financial interests. Data and materials availability: All data needed to evaluate the conclusions of the paper are present in the paper or the Supplementary Materials. The Xcr1Cre-mTFP1 mice strain is
available to interested investigators upon request. Submitted 12 November 2019
Accepted 18 February 2020 Published 13 March 2020 10.1126/sciimmunol.aba1896
Citation: C. Wohn, V. Le Guen, O. Voluzan, F. Fiore, S. Henri, B. Malissen, Absence of MHC class II on cDC1 dendritic cells triggers fatal autoimmunity to a cross-presented self-antigen. Sci. Immunol. 5, eaba1896 (2020).
by guest on March 14, 2020
http://immunology.sciencemag.org/
DOI: 10.1126/sciimmunol.aba1896 , eaba1896.
5
Sci. Immunol.
homeostatic maturation but requires MHCII-restricted interactions with regulatory T cells.
lethal autoimmune response. The ability of cDC1s to enforce cross-tolerization is not completely acquired during T cells that caused a +
T cells but instead converted them into effector CD8 +
could not cross-tolerize autoreactive CD8
chemokine receptor (XCR1) to generate mice that are specifically lacking MHCII on cDC1 cells. MHCII-deficient cDC1s cells. They developed a mouse model in which Cre recombinase is expressed under control of the cDC1 marker XC
T + now show that MHCII on cDC1s is required for cross-tolerization of CD8
et al.
process of cross-presentation. Wohn
T cells through the +
Conventional type 1 dendritic cells (cDC1s) present exogenous antigen on MHCI to CD8
Cross-tolerization tale
ARTICLE TOOLS http://immunology.sciencemag.org/content/5/45/eaba1896
MATERIALS
SUPPLEMENTARY http://immunology.sciencemag.org/content/suppl/2020/03/09/5.45.eaba1896.DC1
REFERENCES
http://immunology.sciencemag.org/content/5/45/eaba1896#BIBL
This article cites 51 articles, 19 of which you can access for free
Terms of Service
Use of this article is subject to the
is a registered trademark of AAAS.
Science Immunology
New York Avenue NW, Washington, DC 20005. The title
(ISSN 2470-9468) is published by the American Association for the Advancement of Science, 1200
Science Immunology
Science. No claim to original U.S. Government Works
Copyright © 2020 The Authors, some rights reserved; exclusive licensee American Association for the Advancement of
by guest on March 14, 2020
http://immunology.sciencemag.org/