H. P. KRAYENBUEHL, J. SCHNEIDER, M. TURINA AND A. SENNING
Medical Policlinic, Cardiology, Institute of Pathology and Surgical Clinic A, University Hospital, Zurich, Switzerland
KEY WORDS: Left ventricular function, aortic valve replacement, myocardial hypertrophy and fibrosis.
Left ventricular (LV) micromanometry, cine-angiography and endomyocardial biopsies were performed in 13 patients with aortic valve disease {A VD) before and 12 to 28 months after successful valve replacement. (A VR). Patients with coronary artery disease were excluded. In nine patients (Group I: five AS, four AT) postoperative LV ejection fraction (EF) and total pressure Vmax were normal (EF> 0-61; Vmax^ 1-50 ML/s). In four patients (Group II: three AS, one AT) postoperative EF (0-41) and Vmax (121 ML/s) were depressed. Pre-operative muscle fiber diameter (MFD; normal < 20 n) was 31 /x in Group I and 38 n in Group II (P < 0-01). After A VR MFD decreased to 27 \i in Group I (P < 0005) and to 28 n in Group II (P < 002). Prior to surgery EF and Vmax showed no significant correlation with the LV fibrous content (FC in g/m2; FC = interstitial fibrosis in percent x LV angiographic muscle mass/100) in the 13 patients with AVD. After AVR, however, FC was related inversely to EF (P < 0-07, r = —0-69) and to Vmax (P < 0-025, r = —0-63). It is concluded that: (1) in A VD massive pre-operative fiber hypertrophy heralds impaired postoperative LV function; (2) fiber hyper-trophy regresses following A VR regardle'ssjyf the.LVfunctional state, and (3) the content of fibrous tissue appears to be a determinant of postoperative LV function.
Left ventricular (LV) myocardial hypertrophy is a fundamental adaptive process in patients with chronic pressure or volume overload from aortic valve disease. Following successful aortic valve replacement, pre-operatively depressed LV function generally improves and angiographic LV muscle mass de-creases'1"51. There are, however, occasional patients with postoperative residual LV dysfunction despite good valve function'1"3-5-61. The question then arises whether in these patients irreversible structural altera-tions of the myocardium have taken place and if so, whether there are pre-operative indicators of the un-favorable outcome. In order to gain insight into the relations between function and structure of the left ventricle before and after removal of the hemo-dynamic burden we have studied invasively 13 patients before and after valve replacement and have carried out endomyocardial biopsies at both catheterizations.
Requests for reprints to: H. P. Krayenbuehl, M.D., Medical
Poli-clinic, Cardiology, University Hospital, CH-8091 Zurich, Switzerland. * Supported by a grant from the Swiss National Science Foundation.
Since this series is small the results are only pre-liminary.
Material and methods
Among the 13 patients with aortic valve disease were eight with pure or predominant aortic stenosis (AS) the mean aortic valve area amounting to 0-75 cm2 (0-45-1 -1). Five patients had a pure or pre-dominant aortic insufficiency (AI) with a mean aortic regurgitation fraction of 0-57 (0-43-0-80). In 11 of the 13 patients coronary artery disease was excluded by selective arteriography. In two patients both below 40 years of age coronary arteriography was, in the absence of anginal symptoms, not carried out. Four-teen patients with a functional systolic murmur (n = 8) or atypical chest pain (n = 6) served as con-trols. No biopsies were performed in these patients. LV high-fidelity pressure measurements and left ventriculography were carried out as reported pre-viously'3-71.
The 13 patients with aortic valve disease were
150 H. P. Krayenbuehl et al.
catheterized 18-2 months (12-28) after successful aortic valve replacement. All patients were asked by letter for the consent to undergo a second catheteriza-tion. Surgery consisted in the implantation of a bio-prosthesis either of the Carpentier-Edwards (n = 7) or the Angell-Shiley (n = 2) type or of a Bjork-Shiley valve (n = 4). The postoperative aortic pressure gradients were small (3-10 mm Hg). Minimal aortic regurgitation was present in two patients.
The following hemodynamic measurements were carried out before and after valve replacement: total pressure Vmax and Vpm were calculated from the LV high-fidelity pressure curves'71 and LV volumes, ejec-tion fracejec-tion (EF) and muscle mass (LMMI) were determined from the RAO cine-angiograms[3].
The LV endomyocardial biopsy specimens'81 were fixed in glutaraldehyde, embedded in epon and evaluated by light-microscopy in semi-thin sections (1 fi) stained by methyleneblue-azur II. From several sections of two biopsies of each catheterization muscle fiber diameter (MFD) and interstitial fibrosis (IF) were determined using a mechanical-optical pen (MOP-AM 03, Kontron Messgerate GmbH, Zurich). For determining MFD at least 100 single measure-ments were carried out. IF was estimated using the point counting system'81. All intersection points of the counting grid overlying interstitial non-muscular tis-sue were referred to as interstitial fibrosis. This is somewhat incorrect; but since fibrous tissue is the largely predominant component of the interstitial space the term 'fibrosis' was used in this context. LV fibrous content (FC) was calculated as the product of IF in percent x angiographic muscle mass/100. Normal values for morphometric measurements were obtained from necropsy specimens. Normal MFD is < 20 fi and normal interstitial tissue amounts to less than 5%.
Results
In the 13 patients with aortic valve disease LV peak systolic pressure decreased from 171 to 137 mm Hg
(P < 0005) and LV end-diastolic pressure from 17 to
11 mm Hg (P < 005) following valve replacement. LV end-diastolic volume decreased from 175 to 114 ml/m2 (P < 0005) and LMMI from 180 to 115 g/m2 (P<0005). EF (56 and 61%), Vmax (1-57 and 1 64
muscle lengths/s) and Vpm (1-24 and 1-30 muscle lengths/s) remained unchanged. MFD decreased from 331 to 27-5 fi (P <0001) and IF increased from 17 to 27% (P< 005). FC remained unchanged (28 and 32 g/m2).
For the analysis of the relationship between func-tion and structure the patients were grouped
accord-ing to the functional status after valve replacement. In Group I there were nine patients (five AS, four AI) with normal postoperative LV function as evaluated by the EF (^61%) and total pressure Vmax (^1-50 ML/s). In Group II there were four patients (three AS, one AI) with depressed postoperative LV function the EF averaging 0-41 and Vmax 1-21 ML/s. All except one of these patients had depressed LV
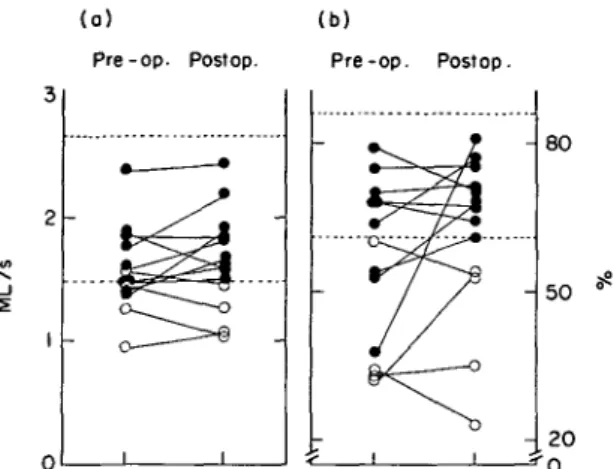
(a) Pre-op. Postop. (b) Pre-op. Postop. - 80 _ i
Figure 1 (a) Total pressure Vmax and (b) left ventricular monoplane (RAO) ejection fraction (EF) in 13 patients with aortic valve disease pre- and postoperatively. = Upper and lower limit of Vmax and EF respectively, determined in 14 control patients; ML = muscle lengths; • = postoperative normal LV function (Group I, n = 9); O = postoperative depressed LV function (Group II, n = 4).
45
3 5
2 5
15
Pre-op. Postop. Pre-op- Postop.
P'OOO'b /><OO2
Figure 2 Muscle fiber diameter before and after surgery in nine patients with aortic valve disease and normal post-operative left ventricular function (# = Group I) and in four patients with depressed postoperative contractile function (O = Group II). The dashed horizontal line indicates the upper limit of normal as determined in myocardial necropsy specimens from patients without heart disease. The arrows indicate the mean values. NS = not significant.
2 0
Figure 3 Interstitial fibrosis in nine patients with normal postoperative left ventrical function ( • = Group I) and four patients with depressed postoperative contractile function (O = Group II). Abbreviations as in Fig. 2.
U-tU 100 50 o 100 50 o - la) -_ - Ib) -t < 0 1 . 1 0 x- - 0 90 n= 13 P< 0 001
°
i r = -0 49 n= 13 NS 10 20 30 4 0 Muscle fiber diameter (^50
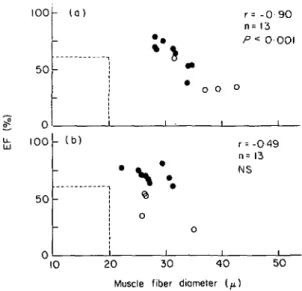
Figure 4 Correlation between left ventricular ejection fraction (EF) and muscle fiber diameter at the pre-operative (a) and the postoperative (b) investigation. • = Group I; O = Group II; = the lower limit of normal of the ejection fraction and the upper limit of muscle fiber diameter in normal necropsy specimens. Whereas there was a signifi-cant inverse relationship between EF and muscle fiber dia-meter before surgery EF and muscle fiber diadia-meter did not correlate after valve replacement, r = Correlation co-efficient; n = number of patients; NS = not significant.
function prior to surgery whereas in Group I only three of the nine patients had abnormal LV function at the pre-operative evaluation (Fig. 1). Following surgery MFD (Fig. 2) decreased significantly in both groups. There was no significant difference of the
post-100 50 -- (b) • _ -i 0 0 1 0 o r= - 0 69 n= 13 P<0 01 i i o 1 5 0 100 Fibrous content ( q / m )
Figure 5 Correlation between left ventricular ejection frac-tion (EF) and fibrous content at the pre-operative (a) and the postoperative (b) investigation. Postoperatively there was a significant correlation between EF and fibrous content. This was not the case at the pre-operative study. Abbrevia-tions as in Fig. 4.
operative fiber thickness in the two groups. In no instance did postoperative MFD reach the upper limit of normal (20 n). The pre-operative MFD was sig-nificantly larger in the patients with an unfavorable postoperative result (38 n) than in those with normal postoperative LV function (31 n). IF (Fig. 3). showed variable changes in Group I after surgery. In Group II IF increased in all instances; this increase was, how-ever, not significant due to the large scatter in the extent of increase and the small number of observa-tions. Astonishingly pre-operative IF was smaller in Group II than in Group I whereas after surgery it tended to be greater in Group II than in Group I. FC did not change significantly in the two groups following surgery.
At the pre-operative study there was a close inverse correlation (r = -0-90) between EF and MFD (Fig. 4a) whereas at the postoperative study EF did not correlate with MFD (Fig. 4b). When EF was cor-related to LVFC there was no significant correlation for the pre-operative data (Fig. 5a). In contrast, the postoperative data showed a significant inverse cor-relation between EF and FC (Fig 5b). There were no significant correlations between EF and IF, neither pre-operatively nor postoperatively.
The comparison of the individual changes of MFD with those of LMMI occurring following valve replacement (Fig. 6) showed that except' in one case, reductions in fiber diameter were accompanied by
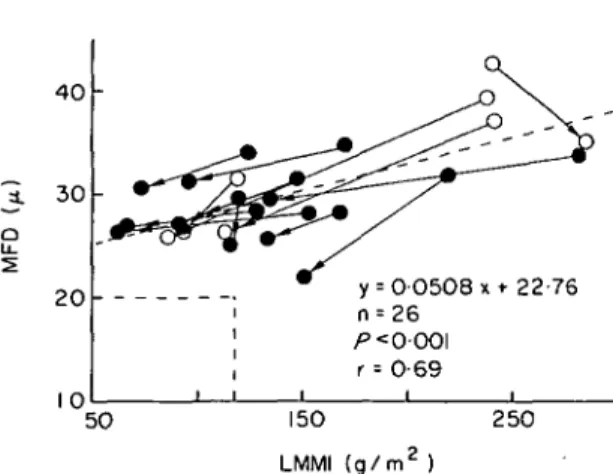
152 H. P. Krayenbuehl et at. 40 30 -2 0 10 y i n
1
p i r i i i = 0 0 5 0 8 x * 22-76 = 26 < 0-001 = 0-69 i i 5 0 150 LMMI ( g / m2 ) 2 5 0Figure 6 Correlation between individual muscle fiber dia-meter (MFD) and left ventricular angiographic mass (LMMI) before and after surgery. Except in one patient, reduction of MFD was associated with a decrease of LMMI. Note that despite normalization of the angiographic mass (decrease below 117 g/cm2) in nine of 13 patients post-operative MFD remained above the upper limit of normal (20 ft) in all instances. The dashed quadrangle indicates the upper limits of normality of MFD and LMMI. The ascending dashed line is the regression line through all pre-and postoperative data points. Abbreviations as in Fig. 4.
reductions of angiographic mass. It is noteworthy, however, that despite normalization of the angio-graphic mass, i.e. a decrease below the upper limit of normality (117 g/m2) in nine of 13 patients, postoperative myocardial fiber thickness remained above the upper limit of normal (20 ft) in all instances.
Discussion
Although generally left ventricular function im-proves considerably following aortic valve replace-ment in patients with pre-operatively depressed con-tractility""591 there are patients with persistent LV dysfunction despite good prosthetic valve func-tion'1"3'5-61. In these patients irreversible damage of the myocardium appears to exist and hence the 'myocardial factor' becomes the major determinant of the prognosis. In patients with aortic valve disease Schwarz and coworkers'91 have correlated pre-operative LV function parameters with structural alterations evaluated from transmural LV biopsies which they performed at surgery. They found no significant relationship between the extent of intersti-tial myocardial fibrosis and pre-operative depression of LV function. The ultrastructural degenerative cell changes present in 13 of 15 patients were, however, felt to explain the pre-operative impairment of con-tractile function. Since LV ejection performance
became normal six months after aortic valve replace-ment it was speculated that the ultrastructural myo-cardial changes are fully reversible.
More recently Schwarz and coworkers'101 have confirmed the lack of correlation between pre-operative EF and the amount of interstitial fibrosis in patients with AS. A reduction of myofibrils was found in the patients with decompensated aortic stenosis and advanced hypertrophy. The authors con-cluded that the deficit of myofibrils represents the 'myocardial factor' in chronic pressure overload. No data were presented which would support the con-cept that this deficit of myofibrils may also be responsible for continuing LV dysfunction late after aortic valve replacement.
In the present study we have found that in patients with aortic valve disease pre-operative interstitial fibrosis and fibrous content are not indicators of postoperative LV function. In contrast excessive pre-operative fiber hypertrophy was shown to herald per-sistent impairment of left ventricular contractility. Whereas fiber diameter regressed to similar values in patients with normal and depressed postoperative LV function interstitial fibrosis increased in all four patients with compromised postoperative LV func-tion. Hence one may speculate that reduction in size of excessively hypertrophied cells following removal of the hemodynamic burden is associated with an on-going process of fibrosis which ultimately may deter-mine postoperative functional impairment. In this respect it is noteworthy that at the postoperative evaluation EF was correlated inversely to fibrous content. Finally this study shows that postoperative normalization of angiographic mass as a measure of chamber hypertrophy does not necessarily imply a normalization of fiber thickness, i.e. hypertrophy at the cellular level.
References
[1] Kennedy JW, Doces J, Stewart DK. Left ventricular function before and following aortic valve replacement. Circulation 1977; 56: 944-50.
[2] Smith N, McAnulty JH, Rahimtoola SH. Severe aortic stenosis with impaired left ventricular function and clinical heart failure: Results of valve replacement. Circulation 1978; 58: 255-64.
[3] Krayenbuehl HP, Turina M, Hess OM, Rothlin M, Senning A. Pre- and postoperative left ventricular con-tractile function in patients with aortic valve disease. Br Heart J 1979; 41: 204-13.
[4] Schwarz F, Flameng W, Langebartels F, Sesto M, Walter P, Schlepper M. Impaired left ventricular func-tion in chronic aortic valve disease: Survival and function after replacement by Bjork-Shiley prosthesis. Circulation 1979; 60: 48-58.
replacement. Circulation 1981; 64: 456-63. Cardiol 1978; 41: 661-9.
[7] Krayenbuehl HP, Rutishauser W, Wirz P, Amende I, [10] Schwarz F, Schaper J, Kittstein D, Flameng W, Mehmel H. High-fidelity left ventricular pressure Walter P, Schaper W. Reduced volume fraction of measurements for the assessment of cardiac contractility myofibrils in myocardium of patients with decom-in man. Am J Cardiol 1973; 31: 415-27. pensated pressure overload. Circulation 1981; 63:1299-[8] Hess OM, Schneider J, Koch R, Bamert C, Grimm J, 304.