Estimation of left ventricular volume from apical
orthogonal 2-D echocardiograms*
R. JENNI, A. VIELI, O. HESS, M. ANLIKER AND H. P. KRAYENBUEHL
Department of Internal Medicine, Medical Policlinic, Cardiology and Institute ofBiomedical Engineering, University of Zurich and Federal Institute of Technology (ETH), Switzerland
KEY WORDS: Two-dimensional ultrasonic echocardiography, 'RAO equivalent' view, left ventricular ejection fraction, biplane cine-angiography.
In 42 consecutive patients undergoing biplane left ventricular cine-angiography, left ventricular volumes were first determined ultrasonically using a phased array transducer. To this end, two orthogonal apical long axis views were recorded, one illustrating all four chambers, the other being the 'RA O equivalent' view. Left ventricular volumes were estimated by applying the area-length method to both two-dimensional echocardiograms and cine-angiograms, consistently including in the former the left ventricular outflow tract of the 'RAO equivalent' view.
The echocardiographic approach employed was shown to yield good predictions of the angiographic results. For the end-diastolic volume the correlation is characterized by r=0'98 and SEE 21 ml or 9'7% of the angiographic mean and for the end-systolic volume by r = 0 97 and SEE 17 ml or 18'1% of the mean. The correlation for the ejection fraction showed an r value of &87 and a SEE of 5'4%. Equally good correlations were obtained in the subgroup with wall motion disorders for which the r values of the end-diastolic and end-systolic volumes were both 0 98 and that of the ejection fraction was 0-89.
Recently, attempts have been made to determine the left ventricular volume and ejection fraction from various 2-D tomographic images ['-••]. Whereas the echocardiographic ejection fraction compared favourably with the ejection fraction estimated from mono-!3! and biplanel1'2) cine-angiograms the
left ventricular volumes were smaller than those obtained cine-angiographically. This systematic underestimation by 2-D echo was noted when a long axis view was combined with one or two short axis views to calculate volumes!1-3! as well as when
the parasternal short axis and the apical two-chamber views were used for biplane volumetry!2!.
It appeared to us that two strictly orthogonal views obtained with the same transducer location and transecting the left ventricle longitudinally would probably produce more realistic determi-nations of its volume. To assess this, we initiated a prospective study involving patients with and with-out localized wall motion disorders. In each case we calculated the volumes by a modified procedure Received for publication 18 December 1980.
Requests for reprints w R. Jenni, M.D., Medical Policlinic, Cardiology, 8091 Zurich, Switzerland.
•This work was supported by a grant from the Swiss National Science Foundation.
from the classical apical four-chamber view and the 'RAO equivalent' view!5], orthogonal to the former.
Thereafter, we determined the volumes from bi-plane right (RAO) and left (LAO) anterior oblique cine-angiograms. Our echocardiographic approach differs from that of Silverman et a/.!4! in paediatric
patients insofar as the plane of our 'RAO equiv-alent' view transects the true anterior and the inferior walls of the left ventricle and does not contain portions of the right ventricle.
Methods
Fifty-four patients undergoing routine catheteriz-ation and biplane cine-angiography were studied by 2-D echocardiography the day before the invasive procedure. Forty-two patients had satis-factory investigations with both methods and form the material of the present study (Table 1). Twelve patients were excluded because the 2-D echoes were not satisfactory, because of ectopic beats during cine-angiography, or the heart rate differed more than ± 15 b.p.m. between the two investiga-tions. All patients were in sinus rhythm.
ECHOCARDIOGRAPHIC IMAGES
Two-dimensional echocardiograms were
Table 1 Clinical data in 42 patients studied by 2-D echo and biplane cine-angiography
Mean age (years) (range 16 to 65) Male
Female Diagnoses:
Valvular disease
CAD with wall motion abnormalities Hypertrophic cardiomyopathy AV canal
Constrictive pericarditis Persistent ductus arterious
45 34 8 21 14 4 1 1 1 Abbreviations: CAD = coronary artery disease; AV = atrioventricular.
tained using an ultrasonic phased array sector scanner equipment (Varian V3000) with a 2 2 MHz 32 element or a 35 MHz 20 element transducer. The angle of the echo sector was always 84' and the image depth 21 cm. All images contained 1 cm markers in both horizontal and vertical directions. The echocardiogram and a peripheral lead of the electrocardiogram were recorded on a one inch video tape (Grundig recorder BK 204) for later playback, frame by frame or stop action analysis. For playback, a high resolution TV monitor (Tektronix 632) was used.
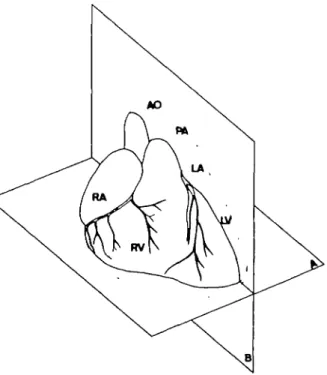
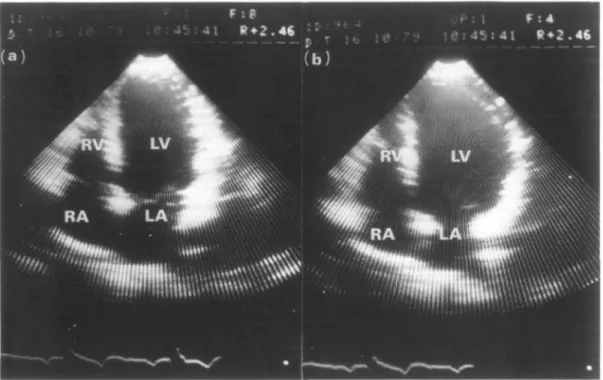
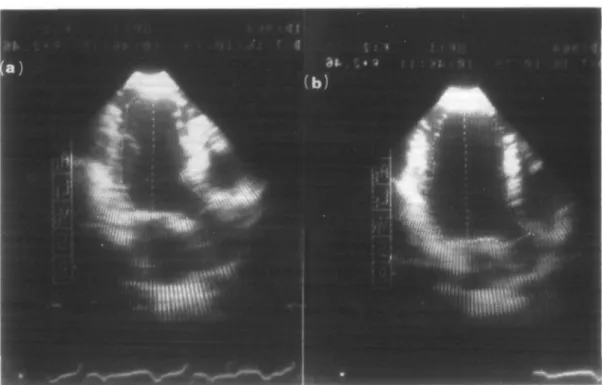
The echocardiograms were carried out in the left lateral decubitus position with the echotransducer placed at the site of the apical impulse. Two ortho-gonal apical views were obtained (Fig. 1). First, the classical apical four-chamber view was recorded in the plane of both mitral and tricuspid valves (Fig. 2a,b). Then, from the same transducer location, the imaging plane was rotated counter-clockwise through 90' to obtain the orthogonal apical long axis view (Fig. 3a,b). The landmarks of this view were the appearance of the aorta and the left ventricular (LV) outflow tract of the bottom right and of the left atrium at the bottom left. This plane runs parallel to the septum and transects the anterior free wall (displayed to the right) and the inferior wall (displayed to the left). It then lies between the ordinary apical long axis view, the imaging plane of which passes through the septum and the posterior wall, and the so-called apical two-chamber viewt2). This particular orthogonal
apical long axis view is the 'RAO equivalent' viewl'l. It is felt that this view deserves the designation 'RAO equivalent' much more than does the apical two-chamber view!2' which
certainly is not strictly comparable to the RAO
cine-angiogram since the LV outflow tract is not visualized. The inclusion of the outflow tract in the LV silhouette appears essential for the accurate determination of volume.
For quantitative evaluation, the 2-D echocardio-graphic images were replayed on the Tektronix monitor in stop mode and the endocardial border of the left ventricle was traced with a light pen connected to a microprocessor unit (Varian). Calibration was carried out by means of the markers in the horizontal and vertical direction. End-diastolic images were defined as those occur-ring at the peak of the R-wave of the ECG and end-systolic images were traced at the end of the T-wave (Figs 4 and 5). Parallax errors were avoided by having the observer keep his head at a constant height in front of the Tektronix monitor. If portions of the endocardium could not be visualized properly in the stopped frame, slow motion or frame by frame viewing was helpful in defining the internal LV boundaries. The papillary muscles intruding into the LV cavity were excluded by tracing through their base. The ventricular long
Figure I Diagram of the two orthogonal imaging planes
for estimation of left ventricular volumes. A-plane: apical four-chamber view. B-plane: apical "RAO equivalent". Abbreviations: AO = aorta: PA = pulmonary artery: RV = right ventricle; LV = left ventricle: LA = left atrium; RA = right atrium.
Figure 2 (a) End-systolic and (b) end-diastolic frames of the left ventricle in the apical four-chamber view (plane
A in Fig. 1) in a patient with severe aortic insufficiency. The left ventricular apex is at the top of the fan. Abbreviations: LA = left atrium; LV = left ventricle; RV = right ventricle; RA = right atrium.
Figure 3 (a) End-systolic and (b) end-diastolic frames of the left ventricle in the 'RAO equivalent' view of the
same patient as in Fig. 2 (plane B in Fig. I). The apex is at the top of the fan. Abbreviations: as in Fig. 2; AO = ascending aorta.
Figure 4 (a) End-systolic and (b) end-diastolic light-pen tracing of the ventricular silhouette in the four-chamber
view. The long axis from the apex to the midpoint of the mitral valve is also shown (same patient as in Fig. 2).
Figure 5 (a) End-systolic and (b) end-diastolic light-pen tracing of the ventricular silhouette in the 'RAO
equiv-alent" view. The long axis from the-apex.to the^midpoint of the mitral valve is also shown (same patient as in Fig. 3),
axis was inscribed at end-diastole and end-systole in both the apical four-chamber as well as in the orthogonal 'RAO equivalent' view from the apex to the midpoint of the mitral valve. The ventricular long axis is the same in the two planes and represents their line of intersection.
All echocardiograms were traced by one of us (R.J.) without knowing the results of angiographic volumetry. In the first 20 patients the 2-D tomo-graphic images were traced in four consecutive cardiac cycles. The volumes calculated from these four individual cycles agreed within ± 4%. It was, therefore, decided subsequently to use only the first cycle for the presentation of the results of the entire group (42 patients).
VOLUMETRIC CALCULATIONS FROM 2-D ECHOS For the calculation of volume the left ventricle was assumed to be an ellipsoid. It was defined by the two orthogonal ellipses whose long axis was the same and whose short axes were obtained by applying the area-length technique to the two orthogonal LV images. The LV outflow tract was always included in the LV silhouette of the 'RAO equivalent' view. All calculations were carried out by the microprocessor unit once the following raw data had been entered by the light pen tracing:
L, = LV long axis common to both apical orthogonal views,
A, = LV endocardial surface in the apical four-chamber view,
A2 = LV endocardial surface in the 'RAO
equivalent' view.
The LV volume (V) was obtained as: V = 8 A, A2
in L,
MODEL EXPERIMENT TO TEST THE ACCURACY OF THE ECHO-LIGHT PEN-MICROPROCESSOR SYSTEM
Waterfilled plastic spheres with volumes of 54 and 160 ml respectively, were immersed in a waterbath and their 2-D echocardiographic images were recorded in various portions of the 84* echo fan. Two observers traced the contours of the two spheres 10 times with the light pen. For the small sphere the mean values of the two observers differed 1 ml (19%) and 0 1 ml (-02%) from the true volume, and for the large sphere the differences were 1 9 ml ( - 1 -2%) and 4 4 ml (-27%), respec-tively. Intraobserver variability for individual determinations was —2'2 to +8% (small sphere) and — 36 to +2-l% (large sphere) for observer 1 and
— 5 to+ 48% and —64 to + 26%, respectively, for observer 2. Thus the echo-light pen-microprocessor system appeared to be acceptably accurate.
CINE-ANGIOGRAPHY
Quantitative analysis of the biplane RAO and LAO LV cine-angiograms was carried out according to the area-length technique!6]. In
con-trast to the evaluation of the 2-D echos the long ventricular axis was inscribed from the aorto-mitral junction to the apex of the left ventricle since, at least in a normally shaped ventricle, this line separates the LV silhouette better in two approximately equal parts than the more eccen-trically located axis from the midpoint of the mitral valve to the apex. The extent of regional wall shortening of superior and inferior hemiaxes is greatly influenced by the position of the long ventricular axis. The angiographic volumetric measurements are, however, not invalidated because for any silhouette-area a somewhat shorter
Table 2 Comparison between echo (y) and angio (x) data
Parameter Slope Intercept SEE Meanangj0 % A of means
SEE in % of mean angio EDV(ml) ESV(ml) EF(%) EDV(ml) ESV(ml) EF(%) 094 0-90 080 0-93 0-89 0-81 -3-7 +7-2 +9-4 098 097 087
(a) All Patients (n = 42)
21 17 54 200 92 57 217 94 59 - 7 8 - 2 1 - 3 4
(b) Subgroup of 14 patients with regional wall motion disorders
- 8 0 +2-8 +8-3 098 0-98 089 22 18 6 4 220 116 51 246 128 53 - 1 0 6 - 9 4 - 3 8 97 181 92 8 9 141 121
Abbreviations: EDV = biplane left ventricular end-diastolic volume; ESV = biplane left ventricular end-systolic volume; EF = biplane left ventricular ejection fraction; r = correlation coefficient; SEE = standard error of estimate.
Angiography Echocardiography R A O ' R A O equivalent'view
** • L A O '—• * 1 F o u r - c h a m b e r view Long axis (cm) Short axis (cm) Area (cm2) Short axis (cm) Long axis (cm) Short axis (cm) Area (cm2) Short axis (cm)
E D ES E D ES E D ES E D ES E D ES E D ES E D ES E D ES 10-8 ±1-3* ± 9-2 1-5* 6-2 ±1-2*" 4 ±1 1 • 3 " ± 54 16 • 9 " •4 31 ±16 •4f •9 6- ±1-It 2 4-4t ±1-1 100 ±1-7* ± 7- 1-9 6* ± 6 0 1-3'" 4-4 ± 51 18 • 2 " •6 30-4t ±13-3 ± 5-9t 11 4-4f ±1-2
Abbreviations:ED = end-diastolic axis; ES = end-systolic axis; R A O = right anterior oblique; L A O = left anterior oblique. * />< 0 0 0 1 ; **P<0-005; * * * / > < 0 0 5 .
t N S = not significant.
Table 4 Comparison of the echo-angio correlations in the paediatnc patients of Silverman et al.M with those of the present study (area-length calculations)
SEE in % Slope Intercept (ml) r SEE (ml) Mean K^o (ml) Mean a ngj0 (ml) % A of means meana n gjo
EDV( S l|v e r m a n ) 0 9 5
EDV( J e n n i ) 0 9 4
ESV (Silverman) 1 1 5
ESV( J e n n i ) 0 9 0
Abbreviations: as in Table 2.
Note: The data of Silverman in this table were obtained by recalculation using their raw data. +114 -3-74 +1-68 + 7 1 8 094 098 091 0-97 15 21 7 17 52 200 20 92 53 217 16 94 -1-9 -7-8 +25 - 2 1 28-3 9-7 43-7 181
650 550 ~ 450
t
| 350 2 5 0 150 50 150 250 350 450 550 650 EDV angio (ml)Figure 6 Biplane angiographic (angio) end-diastolic
volumes (EDV) plotted against biplane echocardiographic (echo) end-diastolic volumes in 42 patients. The line of identity is shown. y = 094 x —374, n = 42, r = 098, SEE = 21. 5 0 0 4 0 0 E 3 0 0 2 0 0 100 100 2 0 0 300 4 0 0 500 ESV ongio (ml.)
Figure 7 Biplane angiographic (angio) end-systolic
volumes (ESV) plotted against biplane echocardiographic (echo) end-systolic volumes in 42 patients. The line of identity is shown, y = 0 9 0 x + 7 1 8 , n = 42, r = 0 9 7 , SEE = 1 7 .
length of the axis from the mitral midpoint to the apex is compensated by a correspondingly larger short ellipsodial axis defined by the area-length concept. Thus the different definition of the long •ventricular axis in the angio and echo calculations should not have invalidated the volumetric comparison.
End-diastolic and end-systolic angiographic silhouettes were traced at the peak of the R-wave of the ECG and at the end of the T-wave, respectively. Synchronization between the ECG and the angio-graphic frames was achieved by a numerical code with marker intervals of 001 s. Care was taken to ensure that the patients were rotated to exactly the same position during cine-angiography as they were during 2-D echocardiography the previous day.
Results
The results are summarized in Tables 2 and 3. The comparison between the echocardiographic and angiographic volumetric measurements yielded excellent correlation coefficients which amounted to 098 for the end-diastolic (EDV) and 097 for the end-systolic (ESV) volumes. Both linear regressions are shown in Figs 6 and 7. The mean values showed a significant (f<0001) but small underestimation of EDV by echocardiography of 8%. The mean
values of ESV showed no significant difference. When the data of the subgroup of patients with wall motion disorders where compared separately, the correlation coefficients for EDV and ESV were
20 30 40 50 60 70 80
EF angio (%)
Figure 8 Biplane angiographic (angio) ejection fraction
(EF) is plotted against the biplane echocardiographic (echo) ejection fraction in 42 patients. The line of identity is shown, y = 080 x + 940. n = 42. r = 087. SEE = 536.
similar to those of the whole group of 42 patients. The echocardiographic ejection fraction cor-related with the angiographic ejection fraction giving a correlation coefficient of 0'87. A system-atic deviation (P <0'01) from the line of identity was observed (Fig. 8). In the patients with regional wall motion disorders a similar good correlation between the echo and angiographic ejection frac-tion was obtained (r = O89), without a systematic deviation from the line of identity.
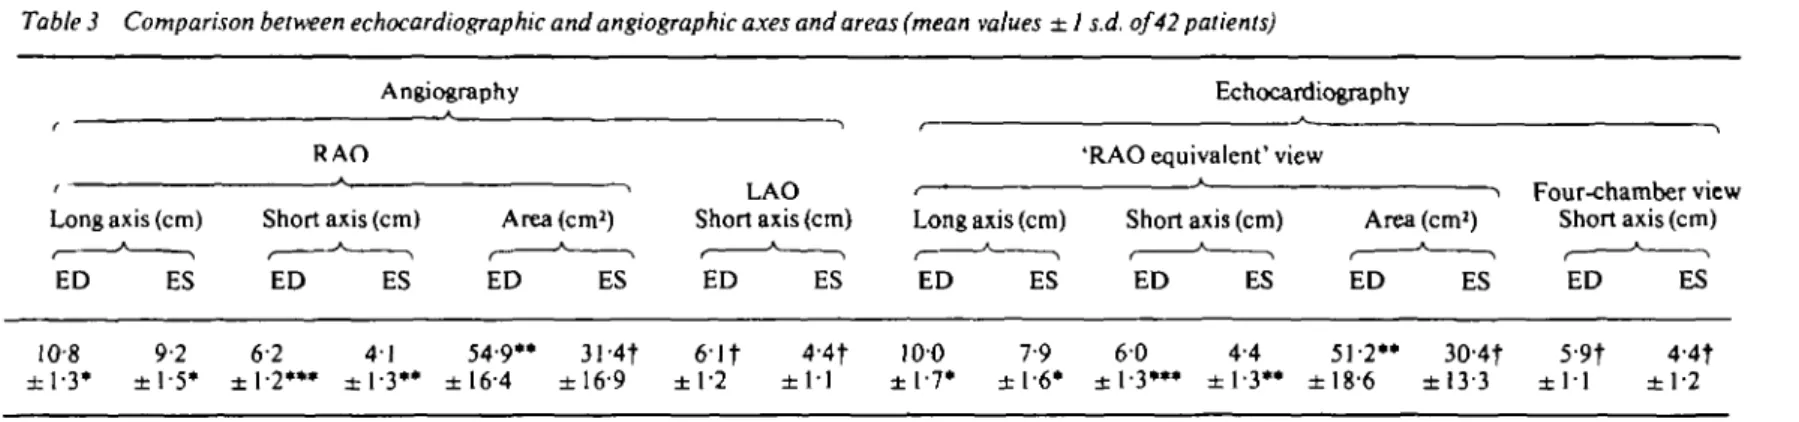
The comparisons between the angiographic (RAO long- and short axis and LAO short axis) and the echocardiographic axes ('RAO equivalent' long- and short axis, four-chamber view short axis) are summarized in Table 3. In the 'RAO equiv-alent' view, the long axis is underestimated (7 resp. 14%, P <0"001). The short axis in this view is also underestimated at end-diastole (30%, P < 0 0 5 ) but overestimated at end-systole (7%, P< 0-005). The comparison of the short axis in the four-chamber view with the short axis in the LAO-projection yielded no significant differences. The comparison of the area in the 'RAO equivalent' view with the area in the angio RAO-projection yielded a significant underestimation at end-diastole (7%, P<0005). At end-systole there was no significant difference between the two areas.
Discussion
The comparison of volumetric measurements from 2-D echo and cine-angiography is hampered by the fact that the raw data, namely the echo-cardiographic cross-sectional images and the angio-graphic silhouettes, generally do not provide the same information. In contrast to the echo images, which yield information from one given plane and not more, the angiographic silhouettes represent the maximal boundaries of the ventricle perpen-dicular to the X-ray beams. It is obvious that the areas of biplane echocardiographic ellipses tend to be smaller than the corresponding angiographic biplane silhouettes and hence lead to an under-estimation of volumes. In the particular situation where the line of intersection of the two orthogonal views coincides with the true long axis of the LV ellipsoid the underestimation should however be minimized. The two orthogonal images we have chosen, i.e. the classical apical four-chamber view and the 'RAO equivalent' view, appear to fulfill this requirement because the lengths of the long ventricular axes in both echocardiographic views were practically identical and, most importantly.
these axes differed only by about 10% from the long axis obtained from the RAO angiographic sil-houettes. Thus we feel that we have, by the choice of the two orthogonal apical views, eliminated the major cause responsible for the lack of agreement between 2-D echo and angio volumes in the past. The correlation coefficients we have obtained for the volumetric comparisons were indeed excellent (0-98 for EDV and 097 for ESV) and there was only a small deviation from the line of identity for EDV (Fig. 6). The scatter of the individual data that remained is most likely due to the non-simultaneous recording of the 2-D echos and cine-angiograms and the difference in individual heart rates (up to 15 b.p.m.), both of which may have led to true differences in left ventricular volume. Another factor which has to be considered is the interobserver variability in tracing echo- and angio-graphic contours and hence in estimating volumes. In the model experiment where contours of a defined geometrical shape (circles) were evaluated, the interobserver differences were small. The maximal individual difference of the two observers (intraobserver variability) amounted to 6 and 8%, respectively, of the true cross-sectional images. The interobserver variability is larger. In one study!4! it
was reported to be ± 10%. It is clear that the inter-observer variability in evaluating angiographic silhouettes must also be taken into account. We have found!7! that 88% of the dimensional
measure-ments from angiographic silhouettes agree within the 10% limits. Larger differences were observed especially in the evaluation of end-systolic frames. Thus some of the scatter in the regression analyses in Figs 6 to 8 and Table 2 must certainly be attributed to angiographic interobserver variability. The findings of the present study are difficult to compare with other echo-angio volumetric com-parisons since in these investigations different tomographic images!'"3! or monoplane
cine-angiographyt3! were used. Of interest, however, is
the study of Silverman et a/.!4! in paediatric patients
which is based on similar two orthogonal apical echo views and in which biplane cine-angiograms in the RAO and LAO projection were also available. In Table 4 their data obtained by the area-length method are compared with those of the present study; the similarity of the cor-relation coefficients for EDV and ESV are note-worthy. On the other hand SEE as a percentage of the angiographic mean values was, however, sizablv larger in the paediatric population than in our adult patients. Thus it appears that the
reli-ability of 2-D echocardiographic volumes was superior in our study.
In summary, it is concluded that 2-D apical orthogonal views provide suitable raw data for non-invasive left ventricular volumetry and that the application of an ellipsoidal model to these data in combination with area-length calculations yield volumes which are close to those obtained by biplane cine-angiography.
The authors wish to thank Miss M. T. Brunner and Mrs M. Brunner for technical assistance and secretarial work and Miss R. Messmer for preparing the figures.
References
[1] Carr KW, Engler RL, Forsythe JR, Johnson AD, Gosink B. Measurement of left ventricular ejection fraction by mechanical cross-sectional echocardio-graphy. Circulation 1979; 59: 1196-206.
[2] Schiller NB, AcquateUa H, Ports TA, el al. Left ventricular volume from paired biplane
two-dimensional echocardiography. Circulation 1979; 60: 547-55.
[3] Folland ED, Parisi AF, Moynihan PF, Jones DR, Feldman CL, Tow DE. Assessment of left ventricular ejection fraction and volumes by real-time, two-dimensional echocardiography. A comparison of cine-angiographic and radionuclide techniques. Circulation 1979; 60: 760-6.
[4] Silverman NH, Ports TA, Snider AR, el al. Determination of left ventricular volume in children: echocardiographic and angiographic comparisons. Circulation 1980; 62: 548-57.
[5] Tajik AJ, Seward JB, Hagler DJ, Mair DD, Lie JT. Two-dimensional real-time ultrasonic imaging of the heart and great vessels. Mayo Clin Proc 1978; 53:271-303.
[6] Dodge HT, Sandier H, Baxley WA, Hawley RR. Usefulness and limitations of radiographic methods for determining left ventricular volume. Am. J. Cardiol 1966; 18: 10-24.
[7] Steiger U.KrayenbuehlHP, Brunner HH, Schonbeck M, Rutishauser W. Einfache quantitative Kineangio-cardiographie zur Bestimmung von Ventrikelfunk-tionsparametem. Schweiz Med Wochenschr 1973; 50: 1778-80.