The peripheral benzodiazepine binding site in the brain in multiple sclerosis : Quantitative in vivo imaging of microglia as a measure of disease activity
17
0
0
Texte intégral
(2) 2322. R. B. Banati et al.. Abbreviations: BP ⫽ binding potential; CR3 ⫽ complement receptor 3; EAE ⫽ experimental allergic encephalitis; EDSS ⫽ Expanded Disability Status Scale; GFAP ⫽ glial fibrillary acid protein; PBBS ⫽ peripheral benzodiazepine binding site; PMA ⫽ phorbol myristate acetate; PP ⫽ primary progressive; RR ⫽ relapsing–remitting; SP ⫽ secondary progressive; SRCC ⫽ Spearman’s rank correlation coefficient; TAC ⫽ time–activity curve(s). Introduction In brain lesions without direct damage to the blood–brain barrier, the predominant cell type expressing binding sites for the isoquinoline PK11195 is activated microglia, the brain’s intrinsic macrophage (Banati et al., 1997). Originally discovered as an additional binding site of certain benzodiazepines, such as diazepam, the binding site for PK11195 is abundantly expressed in peripheral organs and haematogenous cells and is often referred to as the ‘peripheral benzodiazepine binding site’ (PBBS) (for review, see Hertz, 1993), although it is structurally and functionally unrelated to the central benzodiazepine receptor associated with GABAregulated channels. Labelled with carbon-11, PK11195 has previously been used in a small number of patients to image focal accumulations of brain macrophages by PET (Benavides et al., 1988; Ramsay et al., 1992; Banati et al., 1999). There is increasing awareness that microglia are early sensors of brain pathology (Kreutzberg, 1996), and [11C](R)-PK11195 PET offers the prospect of measuring microglial activation in the living human brain in diseases such as multiple sclerosis, in which activated microglia may contribute to tissue destruction and disease progression (Cuzner, 1997; Sriram and Rodriguez, 1997). However, a number of fundamental methodological issues have so far limited the interpretation of [11C](R)PK11195 imaging data in brain inflammation. Whereas there is evidence that areas with increased PK11195 binding contain activated microglia (Dubois et al., 1988; Myers et al., 1991a; Stephenson et al., 1995; Conway et al., 1998), the cell type itself has not yet been shown directly (i.e. by double-labelling in situ) at the single-cell level to express the [11C](R)PK11195 binding site in inflammatory tissue. It is also not yet established whether an increase in microglial PK11195 binding would reflect a rise in the number of binding sites or a change in their affinity. Furthermore, unlike the situation with other ligands used in PET, the near absence of significant PK11195 binding in the normal brain makes it difficult to establish a typical or normal pattern of PK11195 binding and predict its change in CNS disease. To this end, in vitro data from experimental allergic encephalomyelitis (EAE), an animal model of multiple sclerosis, and from post-mortem CNS tissue of multiple sclerosis patients are used to interpret in vivo data of [11C](R)-PK11195 binding in multiple sclerosis patients. The kinetic behaviour of [11C](R)-PK11195 in disease tissue is quantitatively assessed by a method that accounts for, for example, regional blood flow-dependent changes in ligand delivery, as they may be expected in inflammatory pathology, and is relevant to the issues that arise from the unstable stable behaviour of the ligand in. the vascular (plasma) compartment and the absence of an anatomically definable reference tissue in multiple sclerosis.. Material and methods Human post-mortem issue Post-mortem brain and spinal cord tissue from 11 patients with clinically and histopathologically confirmed multiple sclerosis (mean age 57 years, range 35–63 years; mean disease duration 18 years, range 1–28 years; mean interval from death to snap-freezing 41 h, range 21–61 h) and nine control subjects without neurological disease (mean age 55 years, range 37–72 years; mean interval from death to snap-freezing 38 h, range 14–82 h) were obtained from the Multiple Sclerosis Society Tissue Bank at the Institute of Neurology. Immunostaining, histological grading and film autoradiography were performed on a total of 52 tissue blocks from different areas of brain and spinal cord.. Adoptive transfer of EAE Adult female Lewis rats (190–220 g) were purchased from Charles River (Margate, Kent, UK) and housed in pairs in a standard animal facility for at least 1 week before experimentation. EAE was adoptively transferred to naı¨ve animals by intraperitoneal injection of 4 ⫻ 107 splenocytes cultured for 3 days with myelin basic protein (MBP) taken from animals 11 days after sensitization with MBP and complete Freund’s adjuvant (Hewson et al., 1995).. Histology and immunocytochemistry Histopathological evaluation of snap-frozen multiple sclerosis tissue samples was carried out using cresyl violet, haematoxylin–eosin and oil red O. For immunocytochemistry, 10 µm cryostat sections of human CNS and rat brain and rat lumbar spinal cord (between levels L3 and L5) were processed and stained with a panel of antibodies using the avidin–biotin– horseradish peroxidase method as described (Smith et al., 1996). For human tissue the following antibodies were used at appropriate dilutions: EBM11 (1 : 100) (Dako, High Wycombe, UK) and HLA class II DQ (1 : 500) (a gift from Professor F. Vartdal and Dr S. Funderud, Oslo, Norway) as markers of microglia/macrophages; CD2 for lymphocytes (1 : 100) (Dako); polyclonal anti-GFAP (glial fibrillary acidic protein) for astrocytes (1 : 400) (Dako); and 14E for oligodendrocytes and a reactive astrocyte subpopulation (1 : 10 supernatant) (Newcombe and Cuzner, 1988). Rat CNS sections were stained with markers for microglia [OX-42 recognizing.
(3) Peripheral benzodiazepine binding in CNS pathology CR3 complement receptor (1 : 3000), Dako], macrophages [ED1 (1 : 500), Dako] and astrocytes [polyclonal anti-GFAP (1 : 400)]. Controls included omission of the primary antibody and replacement with a control IgG1 (Dianova, Hamburg, Germany).. Autoradiography Film autoradiography and photoemulsion microautoradiography (Banati et al., 1997) were performed on unfixed cryostat sections of snap-frozen CNS tissue from human post-mortem material and animals with EAE, using customsynthesized single enantiomer [3H]R-PK11195 (Amersham, UK), which in previous studies has been shown to possess higher affinity for the PBBS than the commonly used racemate of PK11195 (Shah et al., 1994). Tritium standards (Amersham International, Little Chalfont) co-exposed on each film were used to quantify the autoradiographically measured binding. If not specified otherwise, mean binding values were derived from at least 10 sampled areas. The cell type binding [3H](R)PK11195 was identified by further immunohistochemistry carried out immediately after the development of the microautoradiographic label using markers for microglia and macrophages (for human brain, EBM11; for rat brain, OX-42) and astrocytes (GFAP).. In vitro radioligand binding To assess whether increased ligand binding reflects an increase in the number of binding sites or a change in the affinity of the binding site, additional measurements of in vitro radioligand binding with [3H](R)-PK11195 (1 nM, specific activity 84 Ci/mmol) in the presence of unlabelled PK11195 (concentration range 0.3 nM to 1 µM) were carried out on standard membrane preparations (15 mg/ml) of an immortalized cell line with properties of activated microglial cells (Bocchini et al., 1992), applying established binding protocols (Itzhak et al., 1993). Maximal binding (Bmax) and affinity (pKi) were measured before and after maximal stimulation with 1 mM PMA (phorbol myristate acetate).. Subjects of imaging study Twelve patients with multiple sclerosis according to the criteria of Poser and colleagues (Poser et al., 1983) (eight women, four men; age range 28–66 years, average age 46.3 years; for diagnosis, disease duration, disability scores and treatment at the time of investigation, see Table 1) and eight healthy normal volunteers (three women, five men; age range 34–70 years, average age 51.75 years) were studied. Eight patients were considered to have relapsing–remitting (RR) multiple sclerosis, i.e. they had stable disability between relapses. One patient had secondary progressive (SP) multiple sclerosis with increased disability over 6 months without superimposed relapses. Three patients had progressive disease without intermittent remission and were classified as having. 2323. primary progressive (PP) multiple sclerosis (Lublin and Reingold, 1996). Except for one patient (Patient 5), who received interferon β-1b treatment, none of the patients was under any concurrent anti-inflammatory or immunosuppressive therapy. Informed written consent was obtained from all subjects. Ethical approval and permission was given by the Hammersmith Hospital ethics committee and the Administration of Radioactive Substances Advisory Committee of the Department of Health (ARSAC), UK.. MRI Close to the time of the PET study (i.e. within 7 days), each subject underwent a three-dimensional T1-weighted MRI scan [voxel size 1 ⫻ 1 ⫻ 1.3 mm; 128 contiguous slices; repetition time (TR) 35 ms, echo time (TE) 6 ms, flip angle 35°]. These were obtained from a 1.0 T Picker HPQ MRI scanner for the purpose of co-registration with the PET image (Studholme et al., 1997) and exclusion of incidental pathology. In the 12 multiple sclerosis patients, additional 2D proton density spinecho (TR 2500 ms, TE 20 ms) and T2-weighted spin echo images (TR 2500/TE 80) were acquired. The T1-weighted 3D spin echo images were repeated after contrast enhancement with intravenous dimeglumine gadopentate (Gd-DPTA, 0.1 mmol/kg).. PET Data acquisition The PET study was performed on a CTI/Siemens ECAT 953B PET scanner operated in 3D acquisition mode. [11C](R)-PK11195 was injected as a bolus 30 s after the acquisition scan started. The mean tracer dose was 360 ⫾ 30 MBq with a specific activity of 37 ⫾ 1 GBq/mmol. Dynamic data were collected over 60 min as 18 temporal frames. Attenuation correction factors were determined using a 15 min transmission scan acquired before the dynamic scan. Scatter correction was achieved using a dual-energy window method (Grootoonk et al., 1996). Data were reconstructed with a ramp filter at Nyquist cut-off, producing an image resolution of 5.8 mm (full-width at half maximum) at the centre of the field of view.. Kinetic modelling and analysis As the kinetic behaviour of [11C](R)-PK11195 in the plasma compartment was found to be unstable, probably because of high and variable plasma protein binding, the regional uptake of [11C](R)-PK11195, extraction of which into the brain is similar in areas with and without blood–brain barrier (Price et al., 1990; Cremer et al., 1992), was assessed by using a basis function implementation of a simplified reference tissue model (Lammertma and Hume, 1996; Gunn et al., 1997; Banati et al., 1999) and calculating the following rate constants: RI, the ratio of delivery of radioligand between.
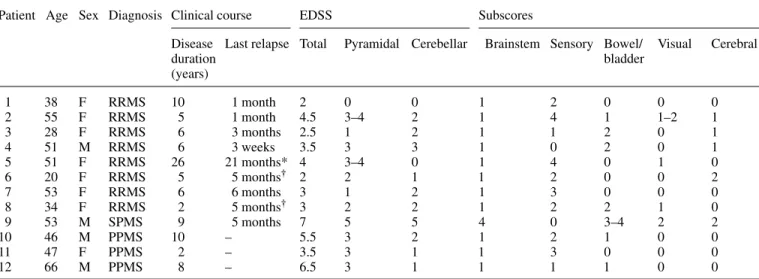
(4) 2324. R. B. Banati et al.. Table 1 Patient data Patient Age Sex Diagnosis Clinical course. 1 2 3 4 5 6 7 8 9 10 11 12. 38 55 28 51 51 20 53 34 53 46 47 66. F F F M F F F F M M F M. RRMS RRMS RRMS RRMS RRMS RRMS RRMS RRMS SPMS PPMS PPMS PPMS. EDSS. Subscores. Disease Last relapse Total duration (years). Pyramidal Cerebellar. 10 5 6 6 26 5 6 2 9 10 2 8. 0 3–4 1 3 3–4 2 1 2 5 3 3 3. 1 month 1 month 3 months 3 weeks 21 months* 5 months† 6 months 5 months† 5 months – – –. 2 4.5 2.5 3.5 4 2 3 3 7 5.5 3.5 6.5. 0 2 2 3 0 1 2 2 5 2 1 1. Brainstem Sensory Bowel/ Visual bladder 1 1 1 1 1 1 1 1 4 1 1 1. 2 4 1 0 4 2 3 2 0 2 3 1. 0 1 2 2 0 0 0 2 3–4 1 0 1. 0 1–2 0 0 1 0 0 1 2 0 0 0. Cerebral. 0 1 1 1 0 2 0 0 2 0 0 0. *Interferon β-1b treatment for 20 months; †in relapse at time of scan. RRMS⫽ relapsing–remitting multiple sclerosis; SPMS ⫽ secondary progressive multiple sclerosis; PPMS ⫽ primary progressive multiple sclerosis.. the target and reference tissues; k2, the efflux rate constant from the target tissue; and the binding potential (BP) which is a measure of ligand binding. In the reference tissue model, the reference input kinetic is usually derived from an anatomical structure that is devoid of specific ligand binding, such as the cerebellum. However, in multiple sclerosis, the often widespread tissue pathology may not allow the anatomical definition of unequivocally normal reference tissue. Therefore, cluster analysis (Ashburner et al., 1996; Gunn et al., 1998) was employed as an alternative, ‘dataled’ approach for the extraction of a normal ligand kinetic to serve as the reference input function. In brief, voxels in the raw dynamic data were segmented into 10 clusters distinguished by the shape of their concentration time– activity curves (TACs), thereby associating each dynamic image voxel with one of the cluster curves according to the likelihood with which the TAC of the voxel belongs to a given cluster (Gunn et al., 1998). In normal brain, the majority (~90%) of the voxels segregated into two clusters, one representing the TAC mainly from the skull and scalp and one representing the TAC of voxels mostly located in the cerebral cortex (Fig. 1). The latter cluster was compared with a normalized mean TAC (population input kinetic) previously created from the normal ligand kinetics identified by cluster analysis in 14 healthy subjects (eight males and six females; age range 32–80 years, mean age 57.3 years). Whether a TAC extracted by cluster analysis from the raw dynamic data of a patient was suitable to serve as the patient’s normal ligand kinetic was assessed by testing for dissimilarity with the previously established normal population input kinetic (χ2 test, P ⬍ 0.05) (Fig. 1).. Definition of volumes of interest To allow anatomical localization of the regional [11C](R)PK11195 binding, the binding potential images were co-. registered and overlaid onto the individuals’ own MRIs (Studholme et al., 1997). For the calculation of regional mean BP values, the following volumes of interest (VOIs) were defined anatomically on the individuals’ volumetric MRI and applied to their parametric BP image: right and left thalamus; brainstem (between the upper and lower borders of the pons); and right and left hemisphere excluding the thalamus. The cerebellum, seen within the restricted field of view (10.65 cm) of the PET camera only to a varying extent, was excluded from formal analysis. Additional VOIs were determined for the multiple sclerosis patients according to the volume of pathological tissue revealed by proton-density, T2-weighted and T1-weighted MRI. Analyze™ software (Robb and Hanson, 1991) was used to outline MRI lesions (Fig. 6E and F) by a local threshold technique and for the calculation of volume (mm3). The definition of the MRI-defined lesions followed established criteria (Filippi et al., 1998). The MRI lesion mask for the lesions seen in the T1-weighted image volume included all hypointense voxels, except those with signal intensity close to that of cerebrospinal fluid. The latter were included in a mask of ‘black holes’ (Truyen et al., 1996) (Fig. 6B). The mean percentage difference (i.e. inter-rater variability of the MRI lesion load calculation) between three raters, who were blinded to the clinical data, was ⬍6% for the T2-weighted lesion loads and ⬍5% for the T1-weighted lesion loads. Comparison of the intensity distribution of the voxels included in the group of black holes against the remaining hypointensities of the T1-weighted MRI showed that both lesion types were separated accurately, i.e. they were significantly different with essentially no overlap (P ⬍ 0.0001). By analogy with the MRI lesion loads, hemispheric [11C](R)-PK11195 lesion loads for both hemispheres were calculated as described previously (Banati et al., 1999) by.
(5) Peripheral benzodiazepine binding in CNS pathology. 2325. Fig. 1 The majority of the time–activity curves extracted by cluster analysis from the dynamic [11C](R)PK11195 PET data of a normal brain fell into two clusters, one localizing to extracerebal structures (A) and the other to healthy brain tissue (B). The latter represents the normal reference kinetic that would have been obtained from an anatomically defined mask similar to that seen in B. The population input kinetic (solid line, with standard deviations) was used to decide whether an individual dynamic data set (here from Patient 9) contained a time–activity curve suitable to serve as the individual’s reference input function (dotted line and arrow).. including only those voxels in the CNS that had a value above a threshold BPT (BP ⬎ BPT ⫽ 2 SD of background). While the MRI lesion loads are reported as absolute volumes (cm3) to allow comparison with published values, the hemispheric [11C](R)-PK11195 lesion loads are reported as relative volumes of pathology [i.e. as a percentage of the sampled hemispheric volume, excluding thalamus and brainstem, which were measured separately (see above)], thus accounting for the different field of view of the PET camera compared with the MRI, and hence the different absolute sampling volume.. Statistics Spearman’s rank correlation coefficient (SRCC) was used to calculate correlations between disability scores, disease duration and total [11C](R)-PK11195 lesion load (mm3) or the [11C](R)-PK11195 lesion load (mm3) within the VOIs defined as being abnormal by MRI (referred to as ‘[11C](R)PK11195 overlap’). Student’s t-test was used to determine the significance of the differences in mean BP values between normal control subjects and patients. Z-values were calculated to determine the significance of increased [11C](R)-PK11195 binding in brains of individual. patients compared with the group of normal control brains. As [11C](R)-PK11195 binding shows a unidirectional change, i.e. it only increases, a Z-value of 1.6 in a one-tailed Z-test represents a level of significance of P ⬍ 0.05 (Snedecor and Cochran, 1980).. Results Human post-mortem studies: [3H](R)-PK11195 binding in normal control and multiple sclerosis tissue The correlation of histopathological lesion grading with measured [3H](R)-PK11195 binding values and the expression of immunocytochemical markers for macrophages and activated microglia is summarized in Fig. 2. Briefly, [3H](R)PK11195 binding was slightly higher in normal control cortical and central grey matter than in normal white matter. Maximal [3H](R)-PK11195 binding, of more than four times above normal control white matter, was reached within those areas of multiple sclerosis plaques that contained oil red Opositive macrophages. Even within or around oil red Onegative but EBM11-positive areas, binding was more than three times above the normal level. Regions of increased [3H](R)-PK11195 binding were also seen in histologically.
(6) 2326. R. B. Banati et al..
(7) Peripheral benzodiazepine binding in CNS pathology. 2327. normal-appearing multiple sclerosis white matter and central grey matter where the increased [3H](R)-PK11195 binding co-localized with EBM11-positive parenchymal microglia (Fig. 3K and L). Apart from some binding to infiltrating cells in perivascular cuffs, no obvious binding to any other cell type or structure was found.. [mean background value 0.19 ⫾ 0.02 (SD)]. In normal brains, an average 5.2 ⫾ 3.1% (SD) of all voxels (sampled from the total volume of both hemispheres without thalamus) had values above the threshold BPT. Some constitutive binding was seen in normal brainstem [mean BP 0.38 ⫾ 0.05 (SD)] and in the normal thalami [mean BP 0.40 ⫾ 0.05 (SD)].. Animal studies: [3H](R)-PK11195 binding in EAE. Multiple sclerosis brain. In longitudinally cut spinal cords (Fig. 4) from rats with the typical disease course of EAE, autoradiographs showed normal [3H](R)-PK11195 binding along the spinal grey and white matter columns up to day 4. At the peak of clinical disease, [3H](R)-PK11195 binding increased in white and grey matter and reached maximal values in small foci. [3H](R)-PK11195 binding, similar to that seen in the spinal cord, was also found in the midbrain (Fig. 4C). After clinical recovery, binding returned to normal in white matter but remained increased in grey matter (Fig. 4D). OX-42 immunohistochemistry demonstrated that the elevated regional binding co-localized with perivascular infiltrates or the cytoplasmic processes of non-phagocytic and still ramified activated microglia along normal-appearing white matter tracts. At this level of single-cell resolution, there was no indication of [3H](R)-PK11195 binding to any other glial cell type.. In vitro radioligand binding The in vitro experiments in which [3H](R)-PK11195 was displaced by unlabelled PK11195 (concentration range 0.3 nM to 1 µM) before and after maximal stimulation with PMA (1 mM) of a murine brain macrophage/microglia cell line demonstrated a significant (P ⬍ 0.001) increase in Bmax [unstimulated, 5.54 pM/µM (SEM 1.27, n ⫽ 3); stimulated, 9.21 pM/µM (SEM 0.53, n ⫽ 3) and no change in affinity [unstimulated, pKi ⫽ 8.6 ⫾ 0.12 (SD); stimulated, pKi ⫽ 8.5 ⫾ 0.12 (SD)] (Fig. 5).. Imaging studies Normal brain Binding of [11C](R)-PK11195 in the hemispheres (excluding the thalamus) of normal brains was minimal, with poor contrast among the grey matter, white matter and ventricles. Highly focal binding and regionally circumscribed increases in [11C](R)-PK11195 binding were observed in the brains of multiple sclerosis patients (data are summarized in Tables 2 and 3). In multiple sclerosis brain, the mean BP of brainstem was 0.49 ⫾ 0.07 (SD) while the mean BP of the thalami was 0.56 ⫾ 0.25 (SD), which is significantly higher than in the normal control brains (P ⬍ 0.001 for brainstem, P ⬍ 0.05 for thalami). Unlike in normal brain, [11C](R)-PK11195 binding to multiple sclerosis thalami was frequently asymmetrical. In most multiple sclerosis patients (except Patients 4 and 8), at least one thalamus and/or the brainstem had significantly increased signal compared with controls. This also applied to Patients 11 and 12, who had PP multiple sclerosis and normal MRI of the brain. Patient 11 had an additional, clinically silent area of increased [11C](R)PK11195 binding in the right frontal lobe. The average hemispheric [11C](R)-PK11195 lesion load in the group of multiple sclerosis brains was approximately twice that of normal brain [10 ⫾ 5.8% (SD)], ranging from 4 to 30%. Due to the highly regional binding pattern and the large sampling volume, i.e. a full hemisphere, the [11C](R)PK11195 lesion load per hemisphere is a greatly diluted measure and was significantly increased in only four patients (Patients 5, 7, 8 and 10). In the multiple sclerosis brains, the additionally sampled areas of MRI-defined pathology (data are summarized in Table 3) showed varying amounts of overlap with the areas of increased [11C](R)-PK11195 binding: the highest overlap was seen with gadolinium-enhancing lesions (present in Patients 6, 8 and 9), in whom 30% of the gadoliniumenhancing volume had significantly increased [11C](R)PK11195 binding (Fig. 6G). For the group of patients with RR multiple sclerosis who were not in relapse, the following values for percentage overlap between MRI-defined pathology and increased [11C](R)-PK11195 binding were calculated: hyperintense areas in T2-weighted MRI, 10 ⫾ 3.5% (SD); hypointense areas in T1-weighted MRI. Fig. 2 [3H](R)-PK11195 binding in normal controls and multiple sclerosis. Tissue types: CeG ⫽ tissue containing central grey matter; CoG ⫽ cortical grey matter; W ⫽ white matter; G ⫽ grey matter; Q ⫽ multiple sclerosis plaque. Areas: L ⫽ lobe; O ⫽ occipital; P ⫽ parietal; SC ⫽ spinal cord; T ⫽ temporal; V ⫽ ventricular. Histology is scored on a scale of 0–4; the first number is the score for oil red O-positive macrophages showing the degree of ongoing demyelination, the second is the score for perivenular inflammatory cuffing. The histology sections were evaluated by two independent observers. [3H](R)-PK11195 binding in Bq/mg tissue was calculated using [3H] standards co-exposed on the same autoradiographic films as the tissue sections. Binding values were derived from a minimum of 10 sampling areas (multiple sclerosis plaque, area with oil red O-positive macrophages, n ⫽ 11; multiple sclerosis plaques, area without oil red O-positive macrophages, n ⫽ 23; multiple sclerosis white matter containing activated microglia, n ⫽ 23; normal grey and white matter and background, n ⫽ 10 each). *All spinal cord sections were cut transversely except sample 3, which was cut longitudinally..
(8) 2328. R. B. Banati et al.. Fig. 3 [3H](R)-PK11195 binding in multiple sclerosis: combined high-resolution autoradiography and immunohistochemistry. (A) Autoradiograph taken from a section of a normal control tissue (sample 12 in Fig. 2) [binding in fmol/mg tissue, 18.8 ⫾ 2.8 (SD) in grey matter, 11.66 ⫾ 2.3 (SD) in white matter]. The square frame delineates the area from which the photomicrographs shown in D, G and J are taken. (B) (Upper section) [3H](R)-PK11195 autoradiograph showing increased binding [46.28 ⫾ 4.16 (SD) fmol/mg tissue] within the area of a multiple sclerosis plaque (arrows) in the central grey matter (sample 6 in Table 1). The accentuated edges (upper arrow) of the multiple sclerosis plaque co-localize with the presence of oil red O-positive macrophages, where binding is maximal [56.51 ⫾ 0.82 (SD) fmol/mg tissue]. (Lower section) Parietal ventricular plaque and white matter (sample 1 in Fig. 2). The square frame is positioned over an area with activated microglia but no oil red O-positive macrophages or perivascular infiltrates; photomicrographs of this area are shown in E, H, K and L. (C) [3H](R)-PK11195 autoradiograph of a multiple sclerosis tissue from cervical spinal cord (sample 3 in Fig. 2). F and I are photomicrographs of the framed area. (D–I) Staining of resting (D, G) and activated (E, F, H, I) parenchymal microglia with EBM11. F and I show activated EBM11-positive microglia following a myelinated tract. (J–L) High-resolution photoemulsion [3H](R)-PK11195 autoradiography combined with EBM11 immunohistochemistry. In areas of activated microglia specific co-localization of silver grains with the EBM11-positive cytoplasm of parenchymal microglia is demonstrated (arrows in K and L). Sections were lightly counterstained with haematoxylin. OG ⫽ occipital cortical grey matter; CeG ⫽ central grey matter; PV ⫽ parietal ventricular; SC ⫽ spinal cord. Scale bar ⫽ 10.7 mm for A and B, 7.2 mm for C, 1 mm for D–F, 300 µm for G–J and 180 µm for K–L..
(9) Peripheral benzodiazepine binding in CNS pathology. 2329. Table 2 Quantification of [11C](R)PK11195 binding Patient. Binding potential. Hemispheres: Lesion load (%). Thalamus. 1 2 3 4 5 6 7 8 9 10 11 12. Right. Left. 0.4 (n.s.) 1.19 (15.8‡) 0.90 (10‡) 0.34 (n.s.) 0.42 (n.s.) 0.4 (n.s.) 0.56 (3.2‡) 0.41 (n.s.) 0.62 (4.4‡) 0.61 (4.6‡) 0.49 (1.8*) 0.57 (3.4‡). 0.36 (n.s.) 1.22 (16.4‡) 0.95 (11‡) 0.33 (n.s.) 0.38 (n.s.) 0.38 (n.s.) 0.48 (1.6*) 0.36 (n.s.) 0.64 (4.8‡) 0.55 (3.6‡) 0.33 (n.s.) 0.61 (4.2‡). Brainstem. Right. Left. 0.48 (2*) 0.60 (4.4‡) 0.50 (2.4†) 0.4 (n.s.) 0.50 (2.4†) 0.4 (n.s.) 0.64 (5.2‡) 0.4 (n.s.) 0.54 (3.2‡) 0.51 (2.6†) 0.50 (2.4†) 0.58 (4‡). 9.2 5.6 5.9 10 12.6 (2.4†) 4.6 16.6 (3.7‡) 13 (2.5†) 8.3 30 (8‡) 7 6.6. 9.5 6.3 6.2 9.4 12 (2.2†) 6.5 14 (2.8†) 16 (3.5‡) 6.5 21.2(5.2‡) 4 5.3. Numbers in parentheses are Z-values for regional [11C](R)-PK11195 binding or lesion loads significantly higher than in normal controls: *P ⬍ 0.05; †P ⬍ 0.01; ‡P ⬍ 0.001. n.s. ⫽ not significant.. Table 3 MRI lesion load and overlap with [11C](R)PK11195 binding Patient MRI lesion load (cm3). 1 2 3 4 5 6 7 8 9 10 11* 12*. MRI–PK11195 overlap (%). T2. T1. Black holes T2. T1. Black holes. –. 4 2.6 8 3 7.4 5.6 9 2.9 13.1 3.4 – –. 0.1 1.1 0.3 0.4 3.6 1.4 0.9 0.6 34 7.5 –. –. 1.3 1 5.2 11 9 17.4 6.2 21 5 10.2. –. –. 9.3 12.4 3 11 9.2 8 12 15 40 17 – –. 8.2 6.5 2.2 20.5 2 13.7 9.1 52 4.2 – –. 7.3 6.1 13.8 9.4 27.8 8.8 31 11.5 14.5 –. –. –. *Patients 11 and 12 had a normal MRI.. (excluding black holes), 12 ⫾ 3% (SD); black holes, 6 ⫾ 4% (SD). For patients in acute relapse (Patients 6 and 8), the overlap with T2-weighted hyperintense areas increased to ~30% and to ~20%, respectively, in the black holes of the T1-weighted image, which in the remaining patients contained the lowest amount of significant binding. The patient with secondary progressive multiple sclerosis (Patient 9) showed high [11C](R)-PK11195 binding co-localizing with the hypointensities of the T1-weighted MRI (excluding black holes), reaching 40% overlap. Clear and well circumscribed signals (BP ⬎ 0.9 ⬍ 2) were seen in anatomical structures that had a normal appearance on each of the three MRI sequences used in this study. [11C](R)-PK11195 PET signals frequently followed neuronal fibre tracts, for example tracking through pathways in the brainstem (Fig. 6A). In patients who suffered from or had a recently reported. visual dysfunction, signals were observed in anatomical locations along the pathway of the neuronal network controlling visual processing or eye movement. Thus, in Patient 9, who had internuclear ophthalmoplegia, a clinical condition caused by a lesion to the medial longitudinal fasciculus (MLF), a circumscribed PET signal could be seen co-localizing with the MLF at the level of the mesencephalon, i.e. the predicted site of pathology (Fig. 7A and B). Similarly, patients with a history of optic neuritis (Fig. 7C and D) showed signals in the lateral geniculate bodies, to which the optic nerve projects. Patients who had never reported any visual dysfunction showed no [11C](R)-PK11195 binding associated with any part of the brain’s visual pathway. In Patient 6 (Fig. 7E–H), who, at the time of the scans, presented with transient speech dyspraxia (reduced fluency of spontaneous speech with only mild language disturbance) (Mohr et al., 1978), [11C](R)-PK11195 PET revealed increased binding in the left frontal operculum close to the area of Broca, which contains the superior longitudinal fascicle. A significant positive correlation (SRCC ⫽ 0.76; P ⫽ 0.012) existed between the [11C](R)-PK11195 overlap with the T1-weighted MRI hypointensities (excluding the black holes) and the total Expanded Disability Status Scale (EDSS) score. This correlation was maintained at a lower level of significance (SRCC ⫽ 0.66; P ⫽ 0.05) after exclusion of Patient 9 (SP multiple sclerosis), who had a particularly high [11C](R)-PK11195 overlap with the T1-weighted MRI lesion load. No other statistically significant correlations were found, for example between the global hemispheric [11C](R)PK11195 lesion load and disability (total EDSS and individual subscores), disease duration or the interval since the last relapse or between the amount of [11C](R)-PK11195 overlap with T2-weighted MRI lesion volume and either disability or disease duration. There was, however, a trend for an inverse.
(10) 2330. R. B. Banati et al.. correlation between the interval since the last relapse and the [11C](R)-PK11195 overlap with the T2-weighted MRI lesion volume, indicating that the amount of binding within the T2weighted MRI lesions gradually declines during the relapsefree time (SRCC ⫽ 0.63; P ⫽ 0.09). No such trend was seen with respect to the amount of [3H](R)-PK11195 binding within the T1-weighted lesions.. Discussion Pattern of PK11195 binding in vitro in multiple sclerosis and EAE (histology) High-resolution microautoradiography in multiple sclerosis and EAE tissue combined with immunohistochemical cell identification in the same tissue section demonstrated that the PBBS is expressed on invading blood-borne cells at sites.
(11) Peripheral benzodiazepine binding in CNS pathology of focal inflammation and on activated microglia remote from any obvious inflammatory pathology. The present study extends earlier observations (Benavides et al., 1988) of focal binding in multiple sclerosis and corroborates indirect (Dubois et al., 1988; Myers et al., 1991a; Stephenson et al., 1995; Conway et al., 1998) and direct (Banati et al., 1997) evidence that activated microglia are the primary source of PK11195 binding in vivo. In keeping with reported data (Myers et al., 1991a, b; Stephenson et al., 1995; Conway et al., 1998) is the absence of significant in vivo binding of PK11195 to astrocytes, although binding of PK11195 to astrocytes in cell culture is well described (Hertz, 1993; Itzhak et al., 1996). Recently, it has also been reported that, in a neurotoxic lesion model, immunoreactivity primarily in and around the nucleus of reactive hippocampal astrocytes can be detected by a polyclonal antibody against the peripheral benzodiazepine receptor (Kuhlmann and Guilarte,. Fig. 5 In vitro displacement of [3H](R)-PK11195 (1 nM) with various concentrations of unlabelled PK11195 (concentration range 0.3 nM to 1 µM) before and after maximal stimulation with PMA (1 mM) of a murine brain macrophage/microglia cell line, demonstrating a significant increase in maximal binding, i.e. number of binding sites, but no significant change in affinity. Error bars denote standard error of the mean of three independent experiments. Open circles ⫽ unstimulated cells; closed circles ⫽ stimulated cells.. 2331. 2000). In our study, however, microautoradiography and immunocytochemistry performed on the same section showed that [3H](R)-PK11195 binding was restricted to GFAPnegative and CR3-positive cells. This included cells with a larger soma and short, broad processes, typical of the fully matured brain macrophages/microglia that are usually found at later stages of brain damage, which, according to their morphology, may resemble reactive astrocytes (Kuhlmann and Guilarte, 2000). The failure to find complete overlap of the reported immunocytochemical stain for the peripheral benzodiazepine receptor and the cellular distribution of the microautoradiographic PK11195 label may reflect sub-unit dependent variations in either the sensitivity or the specificity of both labels for the PBBS at its variously reported mitochondrial, cytosolic and nuclear sites (Anholt et al., 1986; Hertz, 1993; Hardwick et al., 1999). A further potentially important difference from previous reports is the use of the R-enantiomer of PK11195, which has a higher affinity for the PK11195-binding site, rather than the commonly used racemate (Shah et al., 1994). Our data on (R)-PK11195 binding in animal and human tissue sections show that in vivo astrocytes are not a main contributor to regionally increased binding, an interpretation that is supported by the lack of significantly increased [11C](R)-PK11195 binding in astrocyte-rich tissue, such as in patients with hippocampal sclerosis (but infrequent seizures) (Banati et al., 1999). An important finding of our study was the extent and the clear demarcation of PBBS expression along anatomical tracts by microglia that were still ramified, were not colocalized with reactive astrocytes and showed few signs of activation. Our data suggest that during autoimmune disease there is widespread, under-appreciated activation of microglia in the white matter that is unrelated to autoreactive T-cells which precedes obvious demyelination (Cuzner, 1997). It is possible that regional microglia that have not yet developed into full-blown macrophages but are already activated and releasing locally active cytotoxic factors (Banati et al., 1993; Li et al., 1996) are crucial for the process of early demyelination leading to a ‘dying back gliopathy’ (Ludwin and Johnson, 1981; Rodriguez and Scheithauer, 1994). The presence of PBBS-expressing (i.e. activated) microglia. Fig. 4 Cellular localization of [3H](R)-PK11195 binding on activated microglia in EAE. The schematic drawing shows how spinal cords were cut longitudinally to allow viewing of the [3H](R)-PK11195 binding pattern along the spinal columns. (A–E) [3H](R)-PK11195 autoradiographs. (A) Normal spinal cord and (B) preclinical spinal cord, i.e. 4 days after induction of EAE, showing a normal binding pattern [grey matter 21.3 ⫾ 1.01 (SD) fmol/mg tissue, white matter 7.85 ⫾ 1.07 (SD) fmol/mg tissue]. At the peak of clinical disease (day 7) (C), binding increased in white [17.48 ⫾ 0.93 (SD) fmol/mg tissue] and grey [46.76 ⫾ 8.48 (SD) fmol/mg] matter, with areas of maximum focal binding [64.48 ⫾ 3.02 (SD) fmol/ mg tissue]. Similar increases are seen in the midbrain of the diseased animal (C, left). epend. ⫽ ependymal layer showing constitutive [3H](R)-PK11195 binding. After recovery from clinical symptoms (day 10) (D), binding is decreased to normal levels in white matter but is still slightly elevated in grey matter [33.79 ⫾ 3.09 (SD) fmol/mg tissue]. (F–M) High-resolution photoemulsion [3H](R)-PK11195 autoradiography combined with OX-42 immunohistochemistry in EAE (7 days). The square frame in E delineates the transition zone between white and grey matter, which is shown at higher magnification in F and G. A perivascular infiltrate (left arrows) and an activated microglial cell (right arrow) stained with OX-42 are shown in F. When the focus is on the photoemulsion layer (G), silver grains indicating [3H](R)-PK11195 binding can be seen within the perivascular infiltrate and on the activated microglial cell in the parenchyma. The lower-magnification micrographs in H and K reveal that the focal binding of [3H](R)-PK11195 is predominantly to the perivascular cuffs, while the increased [3H](R)-PK11195 binding (arrowheads in L, arrows in M) in the white matter outside the perivascular lesion is found exclusively in OX-42-positive microglia (arrowheads in I, arrows in J). Sections were lightly counterstained with haematoxylin..
(12) 2332. R. B. Banati et al.. in normal-appearing white matter may indicate preferential migration along white matter tracts that are ready for demyelination. Alternatively, in situ proliferation rather than migration may be the primary cause of the regionally increased number of microglia in areas of subtle or imminent brain damage. For example, in the facial nerve axotomy models without blood–brain barrier damage or neuronal cell death, rapid activation and proliferation of microglia occurs along the entire pathway of the lesioned nerve and. simultaneously in the affected facial nucleus (Kreutzberg, 1996). Similarly, a peripheral lesion of the sciatic nerve induces remote expression of microglial PBBS in the brainstem in the nucleus gracilis via ipsilaterally ascending nerve fibres (Banati et al., 1997). Likewise, in animals with EAE, the inflammatory damage in the spinal cord may have remotely induced the increased PBBS expression in the midbrain through the affected ascending spinothalamic tracts (Fig. 4C)..
(13) Peripheral benzodiazepine binding in CNS pathology. In vivo imaging of the glial immunopathology in multiple sclerosis Increased [11C](R)-PK11195-PET signals in the brainstem and the thalamic nuclei secondary to pathology elsewhere have been observed in patients with cortical damage due to cerebrovascular stroke (Pappata et al., 2000) and in experimental models of cortical damage associated with a secondary microglial reaction in the ipsilateral thalamus (Myers et al., 1991b; Sorensen et al., 1996). It is likely that the phenomenon of a ‘projected neuroinflammatory’ response in the wake of primary inflammatory lesions elsewhere along a neural pathway also occurs in multiple sclerosis patients. For example, in Patient 11, the increased thalamic binding is likely to be the consequence of a cervicospinal cord lesion seen in the MRI at level C3/C4, whereas in multiple sclerosis patients with a recent history of optic neuritis the increased [11C](R)-PK11195 signal in the lateral geniculate bodies is the result of damage to the optic nerve. A recent longitudinal MRI study of five patients with isolated neurological syndromes suggestive of multiple sclerosis found a distribution pattern of MRI-defined lesions that was spatially dissociated from the primary inflammatory or demyelinating foci but followed neural pathways in a fashion that is characteristic of Wallerian degeneration (Simon et al., 2000). It is unclear whether the local microglial activation in the lateral geniculate bodies reflects synaptic terminal degeneration or whether the transient axonal irritation of the inflamed optic nerve is a sufficient stimulus. As expected, areas where the blood–brain barrier is disrupted, i.e. gadolinium-enhancing lesions in T1-weighted MRI, which are likely to contain infiltrating mononuclear cells (Nesbit et al., 1991), had the highest overlap with increased [11C](R)-PK11195 binding, whereas old structural lesions, represented by black holes (Truyen et al., 1996), had little binding. However, during relapse the binding in black holes more than doubled, indicating that during relapse there is renewed disease activity in existing areas of severe tissue destruction. No relapse-associated change was observed in the other hypointense areas of the T1-weighted MRI excluding black holes. In contrast, the hyperintense areas of the T2weighted MRI showed an increase of more than two-fold in overlap with the [11C](R)-PK11195 signal during relapse, and. 2333. thus they probably represent a more active disease volume, i.e. PBBS-expressing tissue. Despite the finding that the [11C](R)-PK11195 binding within the T1-weighted MRI lesions (hypointensities excluding black holes) appeared to be unrelated to acute relapse, it correlated with increasing disability (total EDSS). This fraction of [11C](R)-PK11195 binding within T1weighted MRI lesions may, therefore, reflect the secondary neurodegenerative (Wallerian) pathology that underlies progressive disability. In concordance with the post-mortem data, our in vivo observation of increased [11C](R)-PK11195 signals well beyond focal lesions supports the notion that additional mechanisms apart from the focal macrophage accumulations found in the areas of blood–brain barrier leakage (Nesbit et al., 1991; Gay et al., 1997) must contribute to the progression of the disease. There is mounting evidence that hitherto undetected disease processes in brain tissue that appears normal in MRI may explain the imperfect correlation between clinical neurological disability and the extent of disease defined by different MRI spin-echo protocols (Husted et al., 1994; Riahi et al., 1998; Gonen et al., 2000; Tortorella et al., 2000). Although patients with high disability scores generally had either regionally and/or globally increased [11C](R)-PK11195 binding in our study, we found only a limited correlation with clinical disability measured by standardized clinical assessment scales (EDSS) (Kurtzke, 1983). This may in part reflect the frequently discussed limitations of clinical scales when applied to heterogeneous disease entities such as multiple sclerosis (Riahi et al., 1998). It is also likely that, as a marker of current disease activity, [11C](R)-PK11195 binding would relate better to parameters of clinical change (e.g. speed of disease progression) than to cumulative measures of long-standing and recent disability. This is demonstrated in Patient 6, who was scanned during relapse and suffered from transient speech apraxia (Mohr et al., 1978). Here, the increased [11C](R)-PK11195 binding in the vicinity of the left Broca’s area established the clinicopathological correlation which was not obvious in either the EDSS scores or the global lesion loads, as defined by MRI or PET imaging.. Fig. 6 MRI and [11C](R)-PK11195 PET. All images follow the radiological convention, i.e. the left side of the image corresponds to subject’s right side. (A) Three orthogonal views of [11C](R)-PK11195 images co-registered and overlaid on the MRI of Patient 9, showing spinothalamic tract-associated [11C](R)-PK11195 signals extending through the brainstem and pons into the thalamus. (B–D) T1-weighted (B) and T2-weighted (C) MRI and [11C](R)-PK11195 PET (overlaid onto T1-weighted MRI) (D) of Patient 9 show lesions in all different spinecho MRI sequences that partially overlap with areas of significantly increased [11C](R)-PK11195 binding (red arrow).The white arrow points to a ‘black hole’ in an area that appears strongly hypointense in the T1-weighted MRI and has little binding of [11C](R)-PK11195. Note, however, that a similar black hole (yellow arrowhead) adjacent to the right occipital horn of the lateral ventricle shows significant [11C](R)PK11195 binding. (E–F) Demonstration of the definition of the MRI lesion load masks in Patient 9 (purple, T1-weighted MRI lesions excluding black holes; blue, black hole only; green, gadolinium-enhancing areas; dark grey (in F), T2-weighted MRI lesions; red, areas of overlap between significantly increased [11C](R)-PK11195 binding and MRI-defined areas of pathology); yellow, areas of increased [11C](R)PK11195 binding and no overlap with any MRI-defined pathology. (G) Average percentage volume of the MRI-defined lesions overlapping with increased [11C](R)-PK11195 binding. The red square represents Patient 8 and the red triangle Patient 6, who were both in relapse at the time of the scans. The yellow diamond represents Patient 9, who had secondary progressive multiple sclerosis. T1*, black holes..
(14) 2334. R. B. Banati et al.. Fig. 7 Focal [11C](R)-PK11195 binding. (A and B) A focus of elevated [11C](R)-PK11195 binding (arrow) in the brainstem co-localizing with the medial longitudinal fasciculus (MLF) is seen in this patient (Patient 9), who was suffering from internuclear ophthalmoplegia at the time of the PET scan. MR ⫽ medial rectus muscle. (C and D) Patient 2, who had a recent history of optic neuritis. There is increased [11C](R)PK11195 binding in the lateral geniculate bodies (LGB), which are more pronounced on the right side. The schematic drawing indicates that optic neuritis caused an anterograde neuronal reaction of the optic nerve (NII) in the lateral geniculate body. VC ⫽ visual cortex. Extracerebral signals from regions such as the retro-orbital glands have been removed from the [11C](R)-PK11195 images for the sake of clarity. (E–H) Patient 6, who had transient speech dyspraxia (reduced fluency of spontaneous speech with only mild language disturbance) at the time of the scans. There was increased [11C](R)-PK11195 binding in the left frontal operculum close to Broca’s area in the anterior portion of the large white matter tract formed by the superior longitudinal fascicle (SLF). A small but clinically silent lesion, which is gadolinium-enhancing in the T1-weighted MRI (E), is seen to have a similarly confined signal in the [11C](R)-PK11195 PET (red arrow)..
(15) Peripheral benzodiazepine binding in CNS pathology. Limitation of the study and outlook [11C](R)-PK11195. Binding of was measured with a simplified reference region approach and cluster analysis that permitted the robust extraction of a normal reference kinetic without prior anatomical definition of a normal reference region. However, one patient with SP multiple sclerosis had to be excluded from this study since no appropriate concentration time–activity curve could be extracted to serve as an input function. This may indicate that, in this patient with extremely severe brain disease, the amount of healthy tissue from which a normal input function could have been derived was too low. The presence of small amounts of specifically bound [11C](R)-PK11195 (Petit-Taboue, 1991) in normal white and grey matter would lead to slight underestimation of the true binding. Since similar reference tissue curves were used both for patients and for controls, the small reduction in BP would be consistent across all subjects. This study has focused on the expression of the PBBS as a marker of active disease, yet some evidence points to the possibility that the PBBS may play a more active role in inflammation and may thus itself be a target for therapeutic intervention. The PBBS is known to regulate steroidogenesis (Krueger and Papadopoulos, 1993) and modulate macrophage functions (Pawlikowski, 1993), while some PBBS ligands appear to possess anti-inflammatory properties (Torres et al., 1999). Finally, microglia are activated not only in inflammatory diseases, such as multiple sclerosis, but also in chronic neurodegenerative diseases, such as Alzheimer’s dementia, for which the potentially beneficial effects of antiinflammatory drug treatment are already under investigation (McGeer and McGeer, 1995). Thus, in future, a broader concept of activated microglia as mediators of ‘neuroinflammation’ together with new methods for the in vivo detection of microglial activation may also be applied to primarily non-inflammatory CNS diseases.. 2335. References Anholt RR, Pedersen PL, DeSouza EB, Snyder SH. The peripheraltype benzodiazepine receptor. Localization to the mitochondrial outer membrane. J Biol Chem 1986; 261: 776–83. Ashburner J, Haslam J, Taylor C, Cunningham VJ, Jones T. A cluster analysis approach for the characterization of dynamic PET data. In: Myers R, Cunningham V, Bailey D, Jones T, editors. Quantification of brain function using PET. San Diego: Academic Press; 1996. p. 301–6. Banati RB, Gehrmann J, Schubert P, Kreutzberg GW. Cytotoxicity of microglia. [Review]. Glia 1993; 7: 111–8. Banati RB, Myers R, Kreutzberg GW. PK (‘peripheral benzodiazepine’) binding sites in the CNS indicate early and discrete brain lesions: microautoradiographic detection of [3H]PK11195 binding to activated microglia. J Neurocytol 1997; 26: 77–82. Banati RB, Goerres G W, Myers R, Gunn RN, Turkheimer FE, Kreutzberg GW, et al. [11C](R)-PK11195 positron emission topography imaging of activated microglia in vivo in Rasmussen’s encephalitis. Neurology 1999; 53: 2199–203. Benavides J, Cornu P, Dennis T, Dubois A, Hauw J-J, MacKenzie ET, et al. Imaging of human brain lesions with an omega3 site radioligand. Ann Neurol 1988; 24: 708–12. Bocchini V, Mazzolla R, Barluzzi R, Blasi E, Sick P, Kettenmann H. An immortalized cell line expresses properties of activated microglial cells. J Neurosci Res 1992; 31: 616–21. Conway EL, Gundlach AL, Craven JA. Temporal changes in glial fibrillary acidic protein messenger RNA and [3H]PK11195 binding in relation to imidazoline-I2-receptor and alpha 2-adrenoreceptor binding in the hippocampus following transient global forebrain ischaemia in the rat. Neuroscience 1998, 82: 805–17. Cremer JE, Hume SP, Cullen BM, Myers R, Manjil LG, Turton DR, et al. The distribution of radioactivity in brains of rats given [N-methyl-11C]PK 11195 in vivo after induction of a cortical ischaemic lesion. Int J Rad Appl Instrum B 1992, 19: 159–66. Cuzner ML. Molecular biology of microglia. In: Russell WC, editor. Molecular biology of multiple sclerosis. Chichester (UK): Wiley; 1997. p. 97–120.. Acknowledgements We wish to thank our patients, who volunteered to participate in this study, Dr V. Cunningham for advice on PET data quantification, J. Chalcroft, D. Buringer, K. Bruckner, M. Falkenberg and I. Milojevic for technical assistance, the radiographers A. Blythe, D. Griffith, J. Holmes, H. McDevitt and L. Schnorr, and Professor S. McNeish. R.B.B. is supported by a grant from the Deutsche Forschungsgemeinschaft and the Multiple Sclerosis Society of Great Britain and Northern Ireland. Material and financial support was given by the Max-Planck-Institute of Psychiatry, Martinsried and by Dr Hammer and Dr Schneider of Boehringer Ingelheim, Ingelheim, Germany. A.C. is supported by a Marie Curie fellowship from the European Community in the Training and Mobility of Researchers Programme for Biomedicine (BMH4/ CT98/5100).. Dubois A, Benavides J, Peny B, Duverger D, Fage D, Gotti B, et al. Imaging primary and remote ischaemic and excitotoxic brain lesions. An autoradiographic study of peripheral type benzodiazepine binding sites in the rat and cat. Brain Res 1988; 445: 77–90. Filippi M, Horsefield MA, Ader HJ, Barkhof F, Bruzzi P, Evans A, et al. Guidelines for using quantitative measures of brain magnetic resonance imaging abnormalities in monitoring the treatment of multiple sclerosis. Ann Neurol 1998; 43: 499–506. Gay FW, Drye TJ, Dick GW, Esiri MM. The application of multifactorial cluster analysis in the staging of plaques in early multiple sclerosis. Identification and characterization of the primary demyelinating lesion. Brain 1997; 120: 1461–83. Gonen O, Catalaa I, Babb JS, Ge Y, Mannon LJ, Kolson DL, et al. Total brain N-acetylaspartate: a new measure of disease load in MS. Neurology 2000; 54: 15–9..
(16) 2336. R. B. Banati et al.. Grootoonk S, Spinks TJ, Sashin D, Spyrou NM, Jones T. Correction for scatter in 3D brain PET using a dual energy window method. Phys Med Biol 1996; 41: 2757–74. Gunn RN, Lammertsma AA, Hume SP, Cunningham VJ. Parametric imaging of ligand-receptor binding in PET using a simplified reference region model. Neuroimage 1997; 6: 279–87. Gunn RN, Lammerstma AA, Cunningham VJ. Parametric imaging of ligand–receptor interactions using a reference tissue model and cluster analysis. In: Carson RE, Daube-Witherspoon ME, Herscovitch P, editors. Quantitative functional brain imaging with positron emission tomography. San Diego: Academic Press; 1998. p. 401–6. Hardwick M, Fertikh D, Culty M, Li H, Vidic B, Papadopoulos V. Peripheral-type benzodiazepine receptor (PBR) in human breast tissue: correlation of breast cancer cell aggressive phenotype with PBR expression, nuclear localization and PBR-mediated cell proliferation and nuclear transport of cholesterol. Cancer Res 1999; 59: 831–42. Hertz L. Binding characteristics of the receptor and coupling to transport proteins. In: Giesen-Crouse E, editor. Peripheral benzodiazepine receptors. London: Academic Press; 1993. p. 27–57. Hewson AK, Smith T, Leonard JP, Cuzner ML. Suppression of experimental allergic encephalomyelitis in the Lewis rat by the matrix metalloproteinase inhibitor Ro31-9790. Inflamm Res 1995; 44: 345–9. Husted CA, Goodin DS, Hugg JW, Maudsley AA, Tsuruda JS, de Bie SH, et al. Biochemical alterations in multiple sclerosis lesions and normal-appearing white matter detected by in vivo 31P and 1H spectroscopic imaging. Ann Neurol 1994; 36: 157–65. Itzhak Y, Baker L, Norenberg MD. Characterization of the peripheraltype benzodiazepine receptors in cultured astrocytes: evidence for multiplicity. Glia 1993; 9: 211–8. Kreutzberg GW. Microglia: a sensor for pathological events in the CNS. [Review]. Trends Neurosci 1996; 19: 312–8. Krueger KE, Papadopoulos A. The role of mitochondrial benzodiazepine receptors in steroidogenesis. In: Giesen-Crouse E, editor. Peripheral benzodiazepine receptors. London: Academic Press; 1993. p. 87–109. Kuhlmann AC, Guilarte TR. Cellular and subcellular localization of peripheral benzodiazepine receptors after trimethyltin neurotoxicity. J Neurochem 2000; 4: 1694–704. Kurtzke JF. Rating neurologic impairment in multiple sclerosis: an expanded disability status scale (EDSS). Neurology 1983; 33: 1444–52. Lammertsma AA, Hume SP. Simplified reference tissue model for PET receptor studies. Neuroimage 1996; 4: 153–8. Li H, Cuzner ML, Newcombe J. Microglia-derived macrophages in early multiple sclerosis plaques. Neuropathol Appl Neurobiol 1996; 22: 207–15. Lublin FD, Reingold SC. Defining the clinical course of multiple sclerosis: results of an international survey. National Multiple Sclerosis Society (USA) Advisory Committee on Clinical Trials of New Agents in Multiple Sclerosis. Neurology 1996; 46: 907–11.. Ludwin SK, Johnson ES. Evidence for a ‘dying-back’ gliopathy in demyelinating disease. Ann Neurol 1981; 9: 301–5. McGeer PL, McGeer EG. The inflammatory response system of brain: implications for therapy of Alzheimer and other neurodegenerative diseases. [Review]. Brain Res Brain Res Rev 1995; 21: 195–218. Myers R, Manjil LG, Cullen BM, Price GW, Frackowiak RS, Cremer JE. Macrophage and astrocyte populations in relation to [3H]PK 11195 binding in rat cerebral cortex following a local ischaemic lesion. J Cereb Blood Flow Metab 1991a; 11: 314–22. Myers R, Manjil LG, Frackowiak RS, Cremer JE. [3H]PK 11195 and the localisation of secondary thalamic lesions following focal ischaemia in rat motor cortex. Neurosci Lett 1991b; 133: 20–4. Mohr PJ, Pessin MS, Finkelstein S, Funkenstein HH, Duncan GW, Davis KR. Broca aphasia: pathologic and clinical. Neurology 1978; 28: 311–24. Nesbit GM, Forbes GS, Scheithauer BW, Okazaki H, Rodriguez M. Multiple sclerosis: histopathologic and MR and/or CT correlation in 37 cases at biopsy and three cases at autopsy. Radiology 1991; 180: 467–74. Newcombe J, Cuzner ML. Monoclonal antibody 14E identifies the oligodendrocyte cell body in normal adult human and rat white matter. J Neuroimmunol 1988; 19: 11–20. Pappata S, Levasseur M, Gunn RN, Myers R, Crouzel C, Syrota A, et al. Thalamic microglial activation in ischemic stroke patients detected in vivo by PET and [11C]PK11195. Neurology. In press 2000. Pawlikowski M. Immunomodulating effects of peripherally acting benzodiazepines. In: Giesen-Crouse E, editor. Peripheral benzodiazepine receptors. London: Academic Press; 1993. p. 125–35. Petit-Taboue MC, Baron JC, Barre L, Travere JM, Speckel D, Camsonne R, et al. Brain kinetics and specific binding of [11C]PK 11195 to omega 3 sites in baboons: positron emission tomography study. Eur J Pharmacol 1991; 200: 347–51. Poser CM, Paty DW, Scheinberg L, McDonald WI, Davis FA, Ebers GC, et al. New diagnostic criteria for multiple sclerosis: guidelines for research protocols. Ann Neurol 1983; 13: 227–31. Price GW, Ahier RG, Hume SP, Myers R, Manjil LG, Cremer JE, et al. In vivo binding to peripheral benzodiazepine binding sites in lesioned rat brain: comparison between [3H]PK11195 and [18F]PK14105 as markers for neuronal damage. J Neurochem 1990; 55: 175–85. Ramsay SC, Weiller C, Myers R, Cremer JE, Luthra SK, Lammertsma AA, et al. Monitoring by PET of macrophage accumulation in brain after ischaemic stroke [letter]. Lancet 1992; 339: 1054–5. Riahi F, Zijdenbos A, Narayanan S, Arnold D, Francis G, Antel J, et al. Improved correlation between scores on the expanded disability status scale and cerebral lesion load in relapsing–remitting multiple sclerosis. Results of the application of new imaging methods. Brain 1998; 121: 1305–12. Robb RA, Hanson DP. A software system for interactive and quantitative visualization of multidimensional biomedical images. Australas Phys Sci Eng Med 1991; 14: 9–30. Rodriguez M, Scheithauer B. Ultrastructure of multiple sclerosis. Ultrastruct Pathol 1994; 18: 3–13..
(17) Peripheral benzodiazepine binding in CNS pathology. 2337. Shah F, Hume SP, Pike VW, Ashworth S, McDermott J. Synthesis of the enantiomers of [N-methyl-11C]PK11195 and comparison of their behaviours as radioligands in rats. Nucl Med Biol 1994; 21: 573–81.. Clemens JA. Peripheral benzodiazepine receptors are colocalized with activated microglia following transient global forebrain ischemia in the rat. J Neurosci 1995; 15: 5263–74.. Simon JH, Kinkel RP, Jacobs L, Bub L, Simonian N. A Wallerian degeneration pattern in patients at risk for MS. Neurology 2000; 54: 1155–60.. Studholme C, Hill DL, Hawkes DJ. Automated three-dimensional registration of magnetic resonance and positron emission tomography brain images by multiresolution optimization of voxel similarity measures. Med Phys 1997; 24: 25–35.. Smith T, Schmied M, Hewson AK, Lassmann H, Cuzner ML. Apoptosis of T cells and macrophages in the central nervous system of intact and adrenalectomized Lewis rats during experimental allergic encephalomyelitis. J Autoimmun 1996; 9: 167–74.. Torres SR, Nardi GM, Ferrara P, Ribeiro-do-Valle RM, Farges RC. Potential role of peripheral benzodiazepine receptors in inflammatory responses. Eur J Pharmacol 1999; 385: R1–2.. Snedecor GW, Cochran WG. Statistical methods. 7th ed. Ames (IA), Iowa State University Press; 1980.. Tortorella C, Viti B, Bozzali M, Sormani MP, Rizzo G, Gilardi MF, et al. A magnetization transfer histogram study of normal-appearing brain tissue in MS. Neurology 2000; 54: 186–93.. Sorensen JC, Dalmau I, Zimmer J, Finsen B. Microglial reactions to retrograde degeneration of tracer-identified thalamic neurons after frontal sensorimotor cortex lesions in adult rats. Exp Brain Res 1996; 112: 203–12. Sriram S, Rodriguez M. Indictment of the microglia as the villain in multiple sclerosis. [Review]. Neurology 1997; 48: 464–70. Stephenson DT, Schober DA, Smalstig EB, Mincy RE, Gehlert DR,. Truyen L, van Waesberghe JH, van Walderveen MA, van Oosten BW, Polman CH, Hommes OR, et al. Accumulation of hypointense lesions (‘black holes’) on T1 spin-echo MRI correlates with disease progression in multiple sclerosis. Neurology 1996; 47: 1469–76. Received March 27, 2000. Revised June 7, 2000. Accepted June 29, 2000.
(18)
Figure
- C](R)-PK11195 PET data of a normal brain fell into two clusters, one localizing to extracerebal structures (A) and the other to healthy brain tissue](https://thumb-eu.123doks.com/thumbv2/123doknet/14918844.661934/5.918.198.711.92.546/majority-activity-extracted-analysis-clusters-localizing-extracerebal-structures.webp)
-PK11195 binding in multiple sclerosis: combined high-resolution autoradiography and immunohistochemistry](https://thumb-eu.123doks.com/thumbv2/123doknet/14918844.661934/8.918.155.759.118.861/fig-binding-multiple-sclerosis-combined-resolution-autoradiography-immunohistochemistry.webp)
PK11195 binding](https://thumb-eu.123doks.com/thumbv2/123doknet/14918844.661934/9.918.169.756.133.416/table-quantification-of-c-r-pk-binding.webp)
+3
-PK11195 (1 nM) with various concentrations of unlabelled PK11195 (concentration range 0.3 nM to 1 µ M) before and after maximal stimulation with PMA (1 mM) of a murine brain macrophage/microglia cell line, demonstr](https://thumb-eu.123doks.com/thumbv2/123doknet/14918844.661934/11.918.132.390.447.705/displacement-concentrations-unlabelled-concentration-stimulation-macrophage-microglia-demonstr.webp)
-PK11195 binding. (A and B) A focus of elevated [ 11 C](R)-PK11195 binding (arrow) in the brainstem co-localizing with the medial longitudinal fasciculus (MLF) is seen in this patient (Patient 9), who was suffering from internuclear](https://thumb-eu.123doks.com/thumbv2/123doknet/14918844.661934/14.918.183.734.131.890/elevated-brainstem-localizing-longitudinal-fasciculus-patient-suffering-internuclear.webp)
Documents relatifs