The Journal of Heredity 75:365-370. 1984.
Chromosomal locations of twelve
isozyme loci in Pisum sativum
ABSTRACT: Approximate chromosomal locations of 12 loci specifying electrophoretlc
en-zyme variants are described in the garden pea (Pisum sativum L.). The enen-zyme loci are distributed on five of the seven chromosomes. The position of the loci on chromosomes 2 and 3 are such that most of the known markers on these chromosomes will exhibit link-age with at least one of the isozyme loci. Several of the loci studied code for enzymes that have isozymic counterparts in other compartments of the cell. In order to distinguish among the genes coding these isozymes we have added a suffix to the locus designation corresponding to the Intracellular location of its product.
N. F. Weeden
G. A. Marx
The authors are affiliated with the Department of Horticultural Sciences, New York Agricultural Ex-periment Station, Cornell University, Geneva, NY 14456. Invaluable technical assistance was provided in these studies by A. C. Emmo. The authors also thank D. W. Barton and R. W. Robinson for their helpful comments and reviews.
© 1984, American Genetic Association.
ISOZYMES are distinguishable forms of an enzyme often found within the same cell. In many cases the variability can be attributed to different alleles at a single locus, identifying the variants as a specific subclass of isozymes called allozymes. The simple genetic basis of allozymic forms permits their use as genetic markers for a number of applications24.
Mapping of these "isozyme loci" in maize9,
tomatoes18, barley6, wheat and related
species13'14 has resulted in the formation of
partial linkage maps, extremely useful tools for the breeder and plant geneticist. Conspi-cuously missing from the list of plants inves-tigated are representatives from the Legumi-nosae, a major family of flowering plants both in terms of number of taxa and importance to agriculture. Initial genetic studies of the iso-zymes in soybeans10", alfalfa17, and beans3-26
have been published, but the loci have not been mapped.
For several reasons the garden pea is highly suited for the development of an enzyme linkage map. It already possesses many chro-mosomal markers that facilitate mapping of isozyme loci; it is a convenient plant for genetic studies (short generation time, naturally self-pollinated and easily cross pollinated, di-verse germplasm collections available); and it may possibly serve as a model system for other commercially important legumes. At present, only one isozyme locus has been mapped on the pea genome, Lap-1, which codes for the more anodal leucine aminopeptidase isozyme observed after starch gel electrophoresis of raw
extracts2. However, a large number of
poly-morphic isozyme loci have been identified27,
potentially enough to form an enzyme linkage map covering the entire genome should the loci be distributed randomly. We have therefore initiated a program to systematically map all known polymorphic enzyme loci in the pea. We report here approximate map positions of 12 isozyme loci located on five different chromosomes.
Materials and Methods
Inbred lines of Pisum satioum with known morphological markers were selected from the pea collection available at the New York State Agricultural Experiment Station, Geneva, NY. Lines were screened for isozyme pheno-type, and appropriate crosses were made with suitable marker lines. Three crosses were se-lected for further screening of F2 populations, the three families being designated A, E, and G. The A family consisted of seed from six Fi plants produced in a cross between lines B77-254 and A78-237. Three of the F, indi-viduals were generated using B77-254 as the female parent; the other three were from a reciprocal cross. The F2 population, E, was
derived from the cross A1078-234 X B77-257 while G was derived from the cross B78-288 X A1078-236. The relevant morphological markers possessed by each line are given in Table I.
Linkage between loci was calculated using the tables published by Allard1 and computer
programs "F2" and "Progeny" developed at
the New York State Agricultural Experiment
Station.
Samples were prepared for electrophoresis
using two extraction buffers as described
previously
30. Samples extracted in the
tris-HC1 buffer were placed on a pH 8.1
tris-ci-trate/lithium borate system
21. The phosphate
extraction buffer was used for samples
subjected to electrophoresis on either a pH 6.5
histidine7 or a pH 6.1
citrate/N-(3-amino-propyl)-morpholine8 gel system.
The assays for NADP-specific isocitrate
dehydrogenase (IDH), acid phosphatase
(AcP), 6-phosphogluconate dehydrogenase
(6PGD), and leucine aminopeptidase (LAP)
were identical to or slight modifications of
those described by Shaw and Prasad22. The
assays for aspartate aminotransferase (AAT),
shikimate dehydrogenase (SKDH), aldolase
(Aldo), and phosphoglucomutase (PGM)
have been described previously31.
Methyl-umbelliferyl esterase (Est) was assayed as
described by Bender et al.4. The enzymes
AAT, PGM, LAP, and SKDH were assayed
on anodal slices cut from gels run using the
tris-borate buffer system. The histidine buffer
system was used for 6PGD, and the citrate/
N-(3-aminopropyl)-morpholine buffer system
was used to resolve the IDH, AcP, and Est
isozymes.
Reagents were obtained from Sigma
Chemical Company, St. Louis, Missouri,
ex-cept for the N-(3-aminopropyl) morpholine,
which was purchased from Aldrich Chemical
Company, Milwaukee, Wisconsin.
Results
All plants remained healthy throughout the
experiment and seed set was excellent for
families A and E. Some sterility was
encoun-tered among plants in the G population. If this
sterility was caused by differences in parental
karyotype such differences did not appear to
interfere with the mapping of isozyme loci, for
the chromosomal markers and isozyme
phe-Table I. Relevant morphological marker genes in parental lines Line A1078-234 A1O78-236 A78-237 B77-254 B77-257 B78-288 Marker genes* /', s, wb, k, st, b, n,fa. le, cp, gp, wlo, tl, r k, M, st, b, le, wlo s, wb, k, st, b, tl, r Pur, oh, Pu, gp Np,Bt
d, ar, U, PI
FIGURE 1 Mitochondrial aspartate amino-transferase (AAT-3) phenotypes after electro-phoresis of leaf extracts. The fast allozyme (F) has mobility approximately intermediate between the plastid isozyme (AAT-2) and the cytosolic form (AAT-4). The slow alloxyme (S) is slower than but partially overlaps AAT-4. The heterozygous pat-tern is designated H. Arrow indicates direction of migration.
notypes gave normal segregation ratios, and
unexpected linkages between morphological
markers were not observed. Segregation ratios
for the reciprocal crosses in family A gave
similar ratios (data not shown); therefore, the
two data sets were combined for linkage
analysis.
Phenotypes observed after electrophoresis
Isocitrate dehydrogenase: A single band of
IDH activity was observed in extracts from
inbred lines. Crosses made between lines
ex-hibiting forms with different electrophoretic
©
O R I G I N
-o
J EST-1
EST-2
^ } EST-3
' ^ && •«&• I EST-4
1 2 3 *
FIGURE 2 Pea leaf esterase xymograms as visualized using the florogenic substrate methyl-umbelliferyl acetate. Column 1 represents an ex-tract containing the slow alloxyme of each esterase. Column 2 depicts the pattern observed in a plant heterozygous at Est-1, Est-3, and Est-4 (Est-2 is homoxygous for the slow allele). The third track shows the fast allozyme for all esterases except for
Est-2, which is slow.
mobilities gave progeny with a three-banded
phenotype, reflecting the dimeric structure of
this enzyme. In the crosses reported here the
mobilities of the two homodimeric forms did
not differ enough to permit the resolution of
the intermediate heterodimer.Thus,
heterozy-gous plants displayed a single, wide band after
electrophoresis.
Aspartate aminotransferase: Cell
frac-tionation studies of the AAT isozymes in the
pea indicated that the third most anodal set of
allozymes, AAT-3 (Figure 1), represented
mitochondrial forms. In a previous paper
31the
mitochondrial specific forms were labeled
'AAT-2' because the most anodal set of AAT
isozymes (AAT-1 in Figure 1) could not be
seen. The fast variant possessed a mobility
• For description of characters see Blixt5
FIGURE 3 Variation observed in both isozymes of 6PGD. The phenotypes (6PGD-1/6PGD-2) cor-responding to the labeled tracks are: (a) F/H, (b) H/H, (c) S/S, (d) S/H, and (e) H/F, where F •= fast al-lozyme, S •» slow alal-lozyme, H = heterozygous phenotype. Doubly heterozygous individuals express six bands: the four homodimeric forms and two intragenic heterodimers.
relative to the borate front (R/) of 0.32.The slow form, partially obscured by cytosolic AAT isozyme, had an Rj of 0.25. Heterozy-gous individuals exhibited a wide blur with fainter staining of the homodimeric forms.
Leucine aminopeptidase: Several investi-gators16'20 have described polymorphism at
two leucine aminopeptidase loci, Lap-1 and
Lap-2, the loci being numbered in order of
decreasing migration rate of the respective isozymes. Scandalios and Espiritu20 observed
that the two aminopeptidascs they isolated from pea extracts could be distinguished on the basis of substrate specificity. Although both isozymes could cleave either leucyl or alanyl a-naphthylamide, one was more active with the former substrate while the other ex-hibited the opposite preference. When we as-sayed duplicate slices from a pH 8.1 gel for leucine aminopeptidase and alanyl amino-peptidase activity we found that both LAP-1 and LAP-2 isozymes were more active with the leucyl a-naphthylamide substrate. How-ever, a third set of bands, partially overlapping the LAP-2 allozymes, were visualized when alanyl a-naphthylamide was used as the sub-strate. These alanyl aminopeptidase bands are products of a locus distinct from Lap-1 and
Lap-2 although the chromosomal location of
this locus has not been determined (Weeden, unpub.). All three aminopeptidases can be clearly separated using the histidine gel sys-tem; however, the resolution of the LAP-1 allozymes is poorer on this gel.
Esterases: We found that the esterases in young leaf tissue were best observed using the florogenic substrate 4-methylumbelliferyl acetate. The citrate/3 amino-morpholine system resolved four areas of esterasc activity, one cathodal and three anodal (Figure 2). The cathodal esterase, Est-4, gave relatively blurry bands, and the heterozygous pattern could only be interpreted as a broad smear.
6-Phosphogluconate dehydrogenase: Two loci are responsible for the 6PGD activity observable in the pea leaf extracts28. The more
anodal isozyme (6PGD-1) is localized in the plastid compartment while 6PGD-2 is cyto-solic. Plants heterozygous at cither locus ex-hibit intragenic heterodimers (Figure 3) concordant with the dimeric structure of this enzyme23. Hybrid enzymes containing one
6PGD-1 subunit and one 6PGD-2 subunit were not observed.
Phenotypes for shikimate dehydrogenase, phosphoglucomutase, aldolase, and acid phosphatase were described previously31-32.
Linkages observed
Tables II and III present the segregation data for individual loci and joint segregation
Table LL Segregation of allelei at loci involved in mapping experiment*
Family A E G Locus Pur Oh S Wb K St B Gp R Tl Idh Skdh Aldo-p Aat-m Pgm-p Lap-1 Acp-1 Acp-2 Acp-3 6pgd-p Wb K St B Gp R Tl Bt Pgm-p Lap-1 Acp-1 Acp-2 6pgd-c Est-4 D Ar K ht St B Idh Aat-m Skdh Pgm-p Lap-1 Lap-2 Acp-1 Acp-2 Acp-3 Est-4 No. recessive or slow 19 23 15 22 25 22 21 20 19 24 20 23 22 28 23 24 21 21 17 23 31 33 36 31 32 26 28 37 25 32 27 29 29 28 11 8 9 6 12 13 9 10 8 8 9 8 8 8 7 6
observed with designated phenotype heterozygous 37 45 42 35 40 45 37 37 33 31 39 55 52 56 58 49 57 52 20 23 20 17 18 21 25 13 20 20 dominant or fast 44 61 69 63 59 62 63 64 65 24 19 19 13 17 16 23 26 21 19 23 85 82 81 85 84 84 34 77 32 26 31 29 31 28 29 26 30 32 29 26 11 8 12 16 13 10 7 10 9 13 X2 0.89 0.25 2.28 0.04 1.02 0.06 0.0 0.06 0.25 1.42 0.45 0.38 2.31 3.14 1.60 1.21 1.78 1.08 0.49 0.29 0.18 0.84 2.08 0.18 0.40 0.11 0.77 3.38 1.11 0.67 0.28 0.76 0.15 0.22 0.13 0.04 0.08 1.80 0.40 1.44 0.20 0.80 0.80 4.32 1.20 0.44 2.55 1.06 0.67 2.54
data between pairs of loci that gave significant deviations from random assortment. The morphological characters used for mapping the isozyme loci have well-characterized phenotypes and are specified by single loci (Table I) that have been located on the chro-mosomal map of the pea5. The enzyme loci
mentioned in the tables can be placed in five linkage groups, corresponding to regions of chromosomes 1, 2, 3, 5, and 7 (Figure 4).
from Wb. Linkage was not observed between
Pgm-p and Skdh in family A or between Pgm-p and Ar in family G.
Chromosome 3
Leucine aminopeptidase: Both isozymes of LAP are specified by genes located on chro-mosome 3. The tight linkage between Lap-1 and B was demonstrated previously2. Our data
confirm this observation and indicate that
Lap-1 is on the centromere side of B. The gene
coding the LAP-2 isozyme, designated Lap-2, appears to be located near M at the opposite end of the chromosome from B. Relatively close linkage (9 percent recombination) was observed between M and Lap-2 in family G, and significant deviations from random as-sortment also were seen between Lap-2 and st (families E and G) and Acp-3 (family G). The
Chromosome 1
Isocitrate dehydrogenase: The locus coding subunits of this enzyme, Idh, showed close linkage with two marker loci on chromosome 1: Pur and D. Each marker locus exhibited about 5 percent recombination with Idh. An 8 percent recombination frequency has been reported between Pur and D, suggesting that
Idh may be located between these two;
how-ever, a three-point test involving the loci was not performed in our experiments.
Chromosome 2
Shikimate dehydrogenase: In the A popu-lation (84 individuals) no recombinants were found between Skdh and Oh, the locus con-trolling a reddish-brown pigment in the testa. The positioning of Skdh on chromosome 2 was further substantiated in population G indi-cating a linkage between this locus and Ar, also located on that chromosome.
Aspartate aminotransferase: The locus specifying mitochondrial AAT, Aat-m, also was assigned to chromosome 2 by virtue of its linkage with Skdh in both populations A and G, with Oh in A and with Ar in G. The two independent determinations of linkage be-tween Skdh and Aat-m gave recombination frequencies of 24 percent and 18 percent (Table III). In G a three-point test suggested that the sequence Aat-m—Skdh—Ar is the correct order of the genes, with Aat-m posi-tioned toward the end of the chromosome.
Aldolase: Variation in the plastid specific aldolase was produced by alleles at locus
Aldo-p, near the end of the known linkage
map. In population A, Aldo-p showed linkage with both Skdh and Aat-m, with the relative recombination frequencies indicating a gene order of Skdh—Aat-m—Aldo-p. These re-sults confirm an earlier report of possible linkage between Skdh and Aldo-p31.
Phosphoglucomutase: The gene coding the plastid specific form of phosphoglucomutase,
Pgm-p, exhibited linkage with S, K, and Wb
loci mapping near the middle of chromosome 2. The relative recombination frequencies in the possible three-point tests suggested that
Pgm-p was located on the opposite side of K
Table HI. Joint segregation data for pairs of loci exhibiting significant deviations from random assortment
Loci Chromosome 1 Pur.Idh D.Idh Chromosome 2 Oh:Aat-m Oh.Skdh Skdh:Aat-m Aat-nvAldo-p Skdh:Aldo-p Ar:Aat-m Ar.Skdh Skdh:Aat-m S:Pgm-p Wb:Pgm-p K: Pgm-p S:Wb S:K Wb:K Wb:Pgm-p K:Pgm-p Wb:K Chromosome 3 St:Acp-3 St.B St: Lap-1 Acp-3: Lap-1 B:Acp-3 B: Lap-1 St:Lap-2 St.B M:Lap-2 M:Acp-3 Lap-2:Acp-3 St:Lap-2 St:Acp-3 St:Lap-l St:B Acp-3: Lap-1 B:Acp-3 B:Lap-1 Family A G A A A A A G G G A A A A A A E E E A A A A A A E E G G G G G G G G G G N 63 40 84 83 84 76 75 34 34 40 83 84 84 84 84 84 109 108 115 66 83 83 41 67 57 86 116 37 34 34 39 36 40 39 36 35 39 No. -/-15 9 15 23 15 18 7 1 5 0 13 17 22 15 14 18 16 22 23 12 13 2 1 11 0 6 20 0 0 2 3 7 1 7 1 3 0
observed with designated
- / H 2 1 6 0 9 5 9 3 3 2 2 5 4 13 9 5 5 4 4 0 12 0 2 5 6 3 3 2 6 1 - / + 0 0 2 0 4 1 3 4 0 6 0 0 0 0 1 4 1 0 7 1 9 15 6 1 12 9 16 6 4 1 1 0 8 4 4 1 12 H / -6 10 15 3 6 3 3 H/H 29 24 20 15 7 11 11 phenotypes* H/+ 4 3 3 2 2 4 6
+/-1 1 13 0 2 0 6 6 3 6 10 6 0 7 11 7 9 3 10 5 7 23 5 6 19 20 11 8 6 1 5 0 8 6 5 3 9 +/H 32 19 33 41 4 4 4 16 13 6 43 40 42 39 42 25 31 8 27 25 26 20 18 3 15 17 15 3 14 17 + / + 13 10 15 19 11 11 8 4 10 0 15 16 16 62 58 55 31 32 75 18 54 7 2 18 1 13 69 3 4 4 9 9 5 22 1 8 0 Recomb. fracL 5 5 27 24 17 42 30 19 18 16 13 4 7 14 13 23 11 15 19 21 20 36 19 2 43 25 9 20 35 37 9 24 27 30 34 2 SE 2.8 3.5 5.5 — 3.9 3.4 5.6 9.1 7.4 4.8 4.3 3.9 2.1 3.1 4.1 4.0 4.5 3.2 3.7 5.3 5.1 4.8 7.0 5.2 1.5 6.5 4.8 4.9 7.6 7.6 9.2 5.0 7.6 8.6 6.8 9.4 1.8
-• Designations: recessive phenotype or homozygous slow = —; heterozygous - H; dominant phenotype or homozygous fast =» +
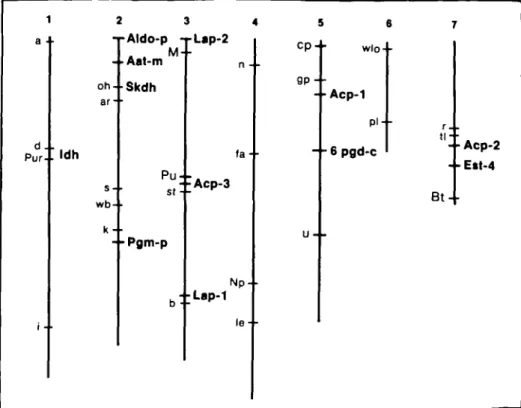
d . . Pur- • '**h 2 3 4 -rAldo-p -j-Lap-2 - -Aat-m oh- Skdh ar- • wb-k- • Pu st: • Acp-3 - -Pgrn-p fa- • N p l e -5 6 C P + wlo--g p - • • A c p - 1 p i -•+• 6 pgd-c u - . B t -Acp-2 Ett-4
FIGURE 4 Relative map positions on the seven chromosomes of Pisum sativum of the marker loci and the 12 isozyme loci examined in this study. Marker loci are shown to the left of the chromosome while the uoxyme loci are labeled in bold print to the right of the chromosome.
fewer number of recombinants observed be-tween M and Acp-3 than bebe-tween Lap-2 and
Acp-3 (family G, Table III) suggests that Lap-2 is situated distal to M on this arm of
chromosome 3.
Acid phosphatase-3: This isozyme also is coded by a locus on chromosome 3. The locus is close to St, near the middle of the known linkage map for this chromosome. The data place Acp-3 on the M side of St. Both Acp-3
Table m . Continued Loci Chromosome 5 Gp: Acp-1 Gp:6pgd-c 6pgd-c:Acp-l Gp: Acp-1 Gp:6pgd-c 6pgd-c:Acp-l 6pgd-c:Acp-l Chromosome 7 R:T1 R.Acp-2 Tl:Acp-2 R:Tl R:Acp-2 R:Est-4 Tl:Acp-2 Tl:Est-4 Bt:Acp-2 Bt:Est-4 Acp2:Est-4 Family A A A E E E G A A A E E E E E E E G N 83 84 84 115 116 116 40 83 73 75 110 105 101 107 108 105 105 27 No. -/-16 12 17 21 17 21 7 19 0 0 26 1 16 2 17 5 16 0
observed with designated - / H 4 8 5 9 13 8 4 0 4 5 0 6 9 7 10 16 14 0
- / +
0 0 1 2 2 0 0 0 13 17 0 19 0 19 0 12 4 7 H / -4 6 1 9 3 8 0 H/H 31 41 19 23 39 32 9 phenotypes* H/+ 4 9 2 0 1 8 10 1+ /
-4 10 0 6 12 0 0 3 21 12 2 28 12 24 3 24 12 5 +/H 33 31 1 48 43 9 2 37 29 5 52 41 38 3 10 31 36 3+/+
26 23 21 29 29 22 5 24 6 3 30 10 26 2 18 17 23 2 Recomb. fract. 10 23 10 17 26 15 12 4 15 19 2 18 22 15 23 40 32 16 SE 3.4 5.1 2.4 3.8 4.6 2.6 3.9 2.2 4.5 3.6 1.1 4.2 4.6 2.7 3.4 5.8 5.3 5.5and St exhibit linkage with Lap-1 and Lap-2, permitting most of the known linkage map to be spanned by the three isozyme loci.
Chromosome 5
Acid phosphatase-1: The gene coding the most anodal of the acid phosphatases exhibited nonrandom assortment with Gp on chromo-some 5 in both populations A and E. The re-combination frequencies observed between these two loci in both crosses were very similar (Table III).
6-Phosphogluconate dehydrogenase: The subunits of the cytosolic isozyme of 6PGD-2 also are specified by a gene linked with Gp. Both three-point crosses involving the loci Gp,
Acp-1, and 6pgd-c indicate a gene order of Gp—Acp-1—6pgd-c. Again, recombination
frequencies between 6pgd-c and the other two loci were quite repeatable. An absence of linkage between 6pgd-c and Cp in population E suggests that both 6pgd-c and Acp-1 lie on the opposite side of Gp from Cp. Preliminary data indicating linkage between 6pgd-c and
Fs32 are consistent with such a position for
6pgd-c.
Chromosome 7
Acid phosphatase-2: In leaf tissue this locus produces an isozyme of relatively weak ac-tivity. The pattern of segregation at Acp-2 closely followed segregation seen at the Tl and
R loci on chromosome 7.
Esterase-4: This locus also exhibited linkage with Tl and R. In a four-point cross with Tl,
R, and Acp-2, the Est-4 locus appeared to be
farther from the Tl—R region than Acp-2 (recombination frequencies: Est-4, Tl = 23 percent; Acp-2, 77 = 15 percent). The se-quence of Tl and R relative to Acp-2 could not be reliably determined from the data due to the tight linkage between the former two loci; however, Est-4 also showed linkage with
Bt located near the lower end of the
chromo-somal linkage map, indicating that Acp-2 and
Est-4 are located between Tl and Bt (Figure
4).
Discussion
Our results provide approximate map lo-cations of 11 previously unmapped isozyme loci in Pisum and confirm the map position of
Lap-1, the only previously mapped isozyme
locus. The consistency of the results in three independent crosses indicated that the devia-tions from random assortment were not caused by irregularities at meiosis or pseudolinkage due to heterogeneity of chromosome structure between parental lines. Similar to results in
maize9, the isozyme loci in the pea do not
ap-pear to cluster within the genome. Not only are the 12 loci distributed over five chromo-somes but the map distances between loci on the same choromosome appear to be relatively large. The most closely linked enzyme loci,
Acp-1 and 6pgd-c, showed a recombination
frequency of 10 percent while the three loci on chromosome 3 (Lap-1, Acp-3, and Lap-2) span nearly the entire linkage group. In con-trast, Tanksley and Rick reported that nearly 30 percent of the isozyme loci in the tomato were associated into tight clusters25.
The arrangement of the isozyme loci on chromosomes 2 and 3 are especially fortunate, for nearly every gene on these chromosomes will exhibit linkage with an isozyme marker. This distribution should prove extremely useful for mapping and for marking characters that are difficult or inconvenient to score di-rectly.
Although the four loci coding mitochondrial or plastic specific enzymes or isozymes are all located on chromosome 2, the possibility that such a grouping reflects a complex of such loci is incompatible with other results. The sig-nificant distances between the loci precludes the possibility that these genes may be under the control of a single cis-acting regulator. In addition, two other loci coding plastid specific proteins, Aat-p and 6pgd-p, do not exhibit linkage with markers on chromosome 2 or with each other (unpub. data). Loci coding mito-chondrial specific enzymes in maize also ap-pear not to be linked15.
The designations used for loci specifying mitochondrial and plastid specific isozymes represents a deviation from the terminology used in maize and the tomato9-18. Such a
change was initiated because recent studies have demonstrated that the subcellular com-partmentation of isozymes in many systems (e.g., phosphoglucomutase, aspartate ami-notransferase, malate dehydrogenase, and glucose phosphate isomerase) is an important and predictable characteristic of these systems (see reviews by Gottlieb12, Newton15, and
Weeden29). Since comparison of linkage
groups can only be accomplished when ho-mologous loci are being considered it is im-perative to determine the subcellular
local-ization of isozymes, especially those known to have organelle specificities, and to conve-niently mark their localization. The designa-tion of loci coding plastid specific isozymes with a suffix " p " , cytosolic with a " c " and mitochondrial with an " m " would serve this purpose. Standard numbering protocol could be used to distinguish multiple isozymes in the same subcellular compartment.
References
1. ALLARD, R. W. Formulas and tables to facilitate the calculation of recombination values in heredity.
Hilgardia 2:235-279. 1956.
2. ALMGARD, G. and K. OHLUND. Inheritance and location of a biochemical character in Pisum.
Pisum Newsl. 2:9. 1970.
3. BASSIRI, A. and M. W. ADAMS. An electropho-retic survey of seedling isozymes in several
Phaseolus species. Euphytica 27:447-459.
1978.
4. BENDER, K., M. NAGEL, and E. GUNTHER. Est-6, a further polymorphic esterase in the rat.
Biochem. Genet. 20:221-229. 1982.
5. BLIXT, S. The pea. In Handbook of Genetics, vol. 2. R. C. King Ed. Plenum Press, New York. p. 181-221. 1974.
6. BROWN, A. H. D. Barley. In Isozymes in Plant Genetics and Breeding, part B. S. D. Tanksley »nd T. J. Orton, Eds. Elsevier, Amsterdam, p. 57-77.
1983.
7. CARDY, B. J., C. W. STUBER, and M. M. GOODMAN. Techniques for starch gel electro-phoresis of enzymes from maize (Zea mays L.). Dept. of Statistics Mimeo Series No. 1317, North Carolina State Univ., Raleigh. 1980.
8. CLAYTON, J. W. and D. N. TRETIAK. Amine-citrate buffers for pH control in starch gel elec-trophoresis. J. Fish. Res. Bd. Can. 29:1169-1172.
1972.
9. GOODMAN, M. M., C. W. STUBER, and K. J. NEWTON. Isozyme loci in maize. In Maize for Biological Research. W. F. Sheridan, Ed. Plant Molecular Biology Association, Charlottesville, Virginia, p. 53-60. 1982.
10. GORMAN, M. B. and Y. T. KlANO. Variety-spe-cific electrophoretic variants of four soybean en-zymes. Crop Sd. 17:963-965. 1977.
11. and . Electrophoretic measurement of genetic variation within the named soybean germplasm. Genetics 100^27.1982.
12. GOTTLIEB, L. D. Conservation and duplication of isozymes in plants. Science 216:373-380. 1982. 13. HART, G. E. Hexaploid wheat. In Isozymes in
Plant Genetics and Breeding, part B. S. D. Tank-sley and T. J. Orton, Eds. Elsevier, Amsterdam, p. 35-56. 1983.
14. and N. A. TULEEN. Chromosomal locations of eleven Elytrigia elongata (^Agropyron
elong-atum) isozyme structural genes. Genet.Res. 41:
181-202. 1983.
15. NEWTON, K. J. Genetics of mitochondrial iso-zymes. In Isozymes in Plant Genetics and Breed-ing, part A. S. D.Tanksley and T. J. Orton, Eds. Elsevier, Amsterdam, p. 157-174. 1983. 16. PRZYBYLSKA, J., H. PARZYSZ, and S. BLIXT.
Electrophoretic study of several enzyme systems of genus Pisum with reference to its taxonomy.
Pisum Newsl. 13:42-43. 1981.
17. QUIROS, C. F. Alfalfa, Luzern. In Isozymes in Plant Genetics and Breeding, part B. S. D. Tank-sley and T. J. Orton, Eds. Elsevier, Amsterdam, p. 253-294. 1983.
18. RICK, C. M. Tomato. In Isozymes in Plant Ge-netics and Breeding, part B. S. D. Tanksley and T. J. Orton, Eds. Elsevier, Amsterdam, p. 147-155. 1983.
19. SCANDALIOS, J. G. Isozymes: genetic and bio-chemical regulation of alcohol dehydrogenase. In Regulation of Enzyme Synthesis and Activity in Higher Plants. H. Smith, Ed. Academic Press, NY. p. 129-153. 1977.
20. and L. G. ESPIRITU. Mutant aminopep-tidases in Pisum satinum I. Developmental genetics and chemical characteristics. Mol. Gen. Genet. 105:101-112. 1969.
21. SELANDER, R. K., M. H. SMITH, S. Y. YANG, W. E. JOHNSON, and J. B. GENTRY. Biochemical polymorphism and systematics in the genus
Per-omyscus. I. Variation in the old-field mouse (Peromyscus polionotus). Univ. Texas Publ.
7103:49-90. 1971.
22. SHAW, C. R. and R. PRASAD. Starch gel electro-phoresis—a compilation of recipes. Biochem.
Genet. 4:297-320. 1970.
23. SlMCOX, P. D. and D. T. DENNIS. 6-Phospho-gluconate dehydrogenase isozymes from the de-veloping endosperm of Ridnus communis L, Plant
Physiol. 62:287-290. 1978.
24. TANKSLEY, S. D. and T. J. ORTON. Isozymes in Plant Genetics and Breeding. Elsevier, Amsterdam. 1983.
25. and C. M. RICK. Isozymic linkage map of the tomato: applications in genetics and breeding.
TAG 57:161-170. 1980.
26. WALL, J. R. and S. W. WALL. Isozyme polymor-phisms in the study of evolution in the Phaseolus
oulgaris-P. cocdneus complex of Mexico. In
Iso-zyme*, vol. 4. C. L. Markert, Ed. Academic Press, NY. p. 287-305. 1975.
27. WEEDEN, N. F. Isozyme variation at selection loci in Pisum. Pisum Newsl. 15:58-59. 1983. 28. . Pea 6-phosphogluconate dehydrogenase
isozymes. Pisum Newsl. 15:56-58. 1983. 29. . Plastid isozymes. In Isozymes in Plant
Genetics and Breeding, part A. S. D. Tanksley and T. J. Orton, Eds. Elsevier, Amsterdam, p. 139-156.
1983.
30. . Distinguishing among white seeded bean cultivars by means of allozyme genotypes.
Eu-phytica 33:199-208. 1984.
31. and L. D. GOTTLIEB. The genetics of chlc-roplast enzymes. /. Hered. 71:392-396. 1980. 32. and G. A. MARX. Linkage determinations
for several isozymic loci in Pisum. Pisum Newsl. 15:54-55. 1983.