Geophys. J . Int. ( 1997) 128,65-72
Seismic scattering in the upper crystalline crust based
on
evidence from sonic logs
K.
Holliger
Institute of Geophysics, Swiss Federal Institute of Technology, ETH-Honggerberg, CH-8093 Zurich, Switzerland
Accepted 1996 August 14. Received 1996 July 23; in original form 1995 September 92
S U M M A R Y
Evidence from sonic logs indicates that velocity fluctuations in the upper crystalline crust are remarkably uniform. This motivates a generic approach to classifying upper- crustal seismic heterogeneity and to studying implications for seismic wave propagation. The resulting canonical model of upper-crustal seismic structure is characterized by a spatially isotropic von Karman autocovariance function with a z 100 m, ~ ~ 0 . 1 5 , and CJ ~ 3 0 0 m s-’. Small-angle scattering theory is used to predict the transition from weak to strong scattering as well as phase fluctuations and scattering attenuation. Compared with ‘exponential’ random media (v = 0.50), the high fractal dimension (i.e.
small values of
v )
of upper-crustal heterogeneity causes smaller phase fluctuations, and transition from weak to strong scattering at lower frequencies and shorter path lengths. Acoustic finite-difference modelling shows that seismic reflections from deterministic features surrounded by heterogeneities are severely degraded when they fall into the strong scattering regime. Conversely, traveltime fluctuations of transmitted waves are found to be relatively insensitive to the transition from weak to strong scattering. Upper-crustal scattering Q is predicted to lie between 600 and 1500, which is one to two orders of magnitude higher than Q-values inferred from seismic data. This suggests that seismic attenuation in the upper crystalline crust is dominated by anelastic effects rather than by scatteringKey words: attenuation, crustal structure, fractals, inhomogeneous media, scattering,
seismic modelling
I N T R O D U C T I O N
Imaging and interpretation techniques used in crustal seis- mology are based on the assumption of ray theory and weak scattering. In view of the growing evidence for the importance of small-scale heterogeneity, the validity of these assumptions and consequences of their violation are questions that need to be addressed (e.g. Levander & Holliger 1992). Seismic wave propagation in random media has been extensively researched (e.g. Frankel & Clayton 1986; Muller, Roth & Korn 1992; Korn 1993; Roth & Korn 1993). However, most of this work was conducted for hypothetical types of seismic heterogeneity, such that the results cannot be easily generalized or applied to specific problems.
Efforts have been made to constrain the nature of seismic heterogeneity in the middle and lower continental crust using geological cross-sections and petrophysical data (Holliger &
Levander 1994). Such canonical models of crustal seismic heterogeneity are useful for addressing crustal- to lithospheric- scale problems of seismic wave propagation. Recently, Hurich ( 1996) explored wave propagation through such models using
scattering theory and finite-difference modelling in order to
gain a better understanding of the seismic reflection images obtained from a complex lower-crustal structure.
Increasing interest in the seismic exploration of the upper crystalline crust involving frequencies up to 1000 Hz (e.g. Milkereit et al. 1994; Holliger & Buhnemann 1996) calls for a similar approach. The high resolution of seismic structure required for this purpose is almost exclusively achieved by borehole sonic log measurements. Here, a canonical model of upper-crustal heterogeneity is defined based on evidence from a variety of sonic logs. and implications for seismic wave propagation are investigated using scattering theory and acoustic finite-difference modelling.
VELOCITY F L U C T U A T I O N S I N T H E UPPER C R Y S T A L L I N E C R U S T C O N S T R A I N E D BY S O N I C LOGS
Autocovariance functions and power spectra
Statistically, seismic heterogeneity in the lithosphere is often well characterized by so-called von Karman autocovariance
66 K . Holliger
functions (e.g. Korn 1993):
where r is the lag, a the correlation length, cr the standard deviation of the velocity fluctuations, the gamma function, and K , the modified Bessel function of the second kind of order 0 < v
<
1. The corresponding power spectrum is given by the Fourier transform of eq. (1) (e.g. Korn 1993):where k is the wavenumber. Eqs ( 1) and ( 2 ) characterize stochastic processes that are self-affine, or 'fractal', at scales smaller than a. The fractal dimension D is given by D = E
+
1 - v, where E is the Euclidean dimension. For a 2-D seismicmodel (i.e. E = 2 ) D thus lies between 2.0 (very smooth velocity fluctuations) and 3.0 (very complex velocity fluctuations).
An important outcome of a comparative study of a variety of upper-crustal sonic logs is their statistical similarity ( Holliger 1996): v lies between 0.1 and 0.2, a between 60 and 160 m,
cr between 200 and 400m s-', and the probability density functions are quasi-Gaussian. The autocovariance functions thus defined differ significantly from the exponential autocovar- iance functions (i.e. v = 0.50) used in many theoretical studies (e.g. Miiller et al. 1992; Korn 1993; Roth & Korn 1993). This fact as well as the statistical uniformity of the seismic heterogeneity in the upper crystalline crust motivated this work.
Aspect ratios of upper-crustal velocity fluctuations
Sonic logs do not contain any information about possible scale-anisotropy of the upper-crustal seismic structure.
10'
@ loo
10-
Geological and petrophysical data suggest aspect ratios (a,/a,) of 2-3 for the middle crust exposed in the Strona-Ceneri Zone (Holliger & Levander 1994). It is, however, not clear how representative such estimates are for the upper crust, since here velocity fluctuations seem to be largely independent of lithology (Holliger 1996). Wu, Xu & Li (1994) estimated an aspect ratio of about 2 for the velocity fluctuations in the vicinity of the KTB deep drill site by cross-correlating the sonic logs from the pilot and main boreholes, which are some
200 m apart. However, the relatively short vertical correlation lengths found for the KTB sonic logs (Holliger 1996) raise some doubts as to the robustness of this estimate. In fact, a recent study using advanced spectral methods indicates that there is no statistically significant correlation between the sonic logs from the two KTB boreholes (Jones & Holliger 1996). This suggests that, at least in the RTB area, the aspect ratio of the seismic heterogeneity is around one, or even smaller. Therefore, the following analysis is based on the assumption of spatially isotropic velocity variations. Since scattering is dominated by the correlation length perpendicular to the direction of wave propagation (Wu & Aki 1988), possible scale-anisotropy is accommodated by considering a relatively wide range of correlation scales (a = 50-200 m).
C H A R A C T E R I Z A T I O N O F WAVE S C A T T E R I N G I N H E T E R O G E N E O U S M E D I A
The following considerations are based on the assumption of small-angle scattering, which is strictly valid for ka>> 1, but generally applicable for ka> 1 (FlattC et al. 1979; Wu & Aki 1988). For the type of heterogeneity considered to be representa- tive of the upper crust, small-angle scattering is thus applicable
@=I
Weak Scattering
I I
lo-* lo-' 1 oo 10'
A
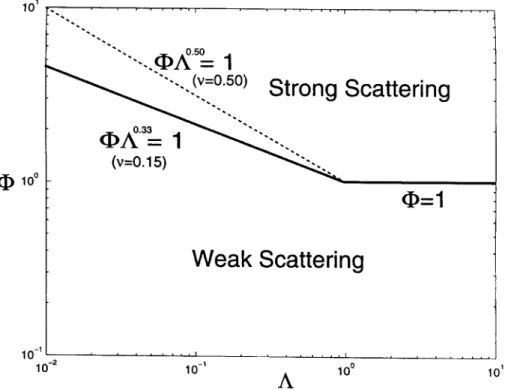
Figure 1. Characterization of wave scattering in terms of the diffraction parameter A and the phase fluctuations @ (Flatte et al. 1979). For A < 1 the transition between weak and strong scattering is given by @A'zv+1)14= 1. The solid line corresponds to v=O.15, which is typical for the upper crystalline crust. The dotted line corresponds to an 'exponential' random medium (v = 0.50).
Scattering in the upper crust 67 whereas for A < 1 the boundary is defined by d,A(2v+1'14 = 1
(Flatte et al. 1979). The transition from weak to strong
scattering thus occurs at lower frequencies and shorter path lengths for small values of v (high fractal dimensions) than for high values of v (low fractal dimensions). This is illustrated in Fig. 1, which compares the boundaries between weak and strong scattering for random media with v=O.15 (typical of
upper-crustal heterogeneity) and v = 0.50 (heterogeneity with exponential autocovariance functions used in theoretical studies).
Results of scattering analysis can be displayed either directly in A 4 space (Fig. 1 ) or in the dimensionless ka-L/a space (Wu & Aki 1988). If the media statistics are uniform, as is the
case in this study, the advantages of A-d, space, i.e. easy definition of boundaries, and ka-L/a space, i.e. illustration of the dependence of scattering on frequency and path length, can be combined by characterizing scattering directly in terms
of path length and frequency. This is shown in Fig. 2 for a=
50,100, and 200 m, v=0.15, a=300 m s-', and u0=6300 m s-'
(Holliger 1996). The results predict that, depending on the path length, strong scattering within the upper crust may be significant in the intermediate (30-100 Hz) and high ( 100-1000 Hz) frequency range. In the following, acoustic finite-difference modelling is used to verify this prediction and to assess the consequences for realistic broad-band seismic signals.
I 1 ) I
for frequencies above 10Hz. Scattering can be divided into
diffraction effects and phase fluctuations. Different workers tend to use slightly different definitions of these phenomena. To avoid confusion, the following analysis is entirely based on the original work by Flatte ef a/. (1979, pp. 87-94).
Diffraction effects are governed by the ratio between the radius of the first Fresnel zone and the correlation length a:
I ( 3 )
where L is the path length, f the frequency, and vo=constant the deterministic 'background' velocity. The radius of the first Fresnel zone is approximated as RF( E) = 4-L. Phase fluctuations of scattered waves depend on the path length L and on the autocovariance function of the heterogeneities C ( r )
[see eq. ( 1 )]. In the ray-theoretical approximation, the variance
of the phase fluctuations is given by:
( 4 ) which yields for the standard deviation of seismic traveltimes:
( 5 ) For random media characterized by autocovariance functions of the type given by eq. ( l ) , phase fluctuations thus increase with increasing values of a, a and v.
The most fundamental boundary in A-d, space corresponds to the transition from weak to strong scattering, which is defined by the existence of multiple ray paths between a given source-receiver pair. For A > 1 this transition occurs for cD> 1,
10' 1 0' N h 0 C m 3 0- L L
E.
p! 1 0' 1oc
N U M E R I C A L S I M U L A T I O N S Reflected wavefieldsThe seismic model considered is 5000 m wide and 10 000 m deep and consists of random velocity fluctuations superposed
\
.
Strong Scattering
--.
-.
Figure 2. Characterization of wave scattering in terms of frequency and path length for seismic heterogeneity typical of the upper crystalline crust:
a=50, 100 and 200 m, v=0.15, u=300 m sC1, t1,=6300 m s-'.
68 K . Holliger
c
-
1
2000*---I
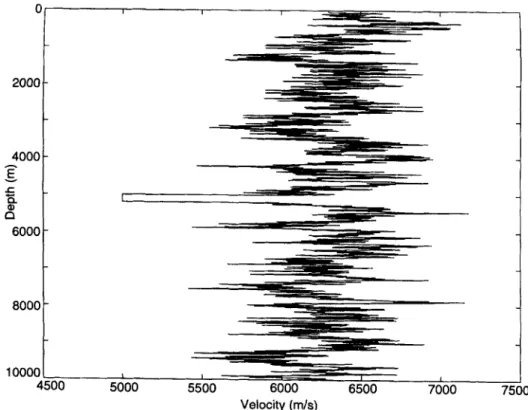
v 5500 6000 6500 7000 0 Velocity (mls)Figure 3. Velocity-depth function extracted from the centre region of the finite-difference model. Note that the thickness of the deterministic low- velocity zone is exaggerated for clarity of illustration.
on a deterministic background velocity of 6300 m s-I. The statistical properties of the velocity fluctuations are spatially isotropic and consistent with evidence from upper-crustal sonic logs fa=100 m, v=0.15, a=300 m s-’, Gaussian probability density function). A 25 m thick horizontal layer with a uniform velocity of 5000 m s-’ is located at 5000 m depth. Synthetic seismograms are computed using a finite-difference solution of the 2-D acoustic wave equation. Fig. 3 shows a velocity-depth function extracted from the centre region of the finite-difference model. A free-surface boundary condition is used at the top, and absorbing boundary conditions are applied along the sides and at the bottom of the model. The source is located 2500 m from the left corner at 20 m depth, and consists of a zero- phase (‘Ricker’) wavelet with centre frequencies of 10, 30, and 90 Hz. In each case, the maximum frequency present in the source signal is approximately three times the dominant frequency.
The synthetic shot gathers show degrading phase coherence of the reflections from the low-velocity zone with increasing centre frequency of the source signal (Fig. 4). At 10 Hz centre frequency, the reflection is laterally continuous and clearly distinguishable from the incoherent, scattered field. At 30 Hz centre frequency, the reflection amplitudes are high but the phase continuity is degraded such that the reflected energy is spread out over several cycles. Finally, for a dominant fre- quency of 90 Hz, the reflection is barely distinguishable from the incoherent part of the wavefield.
The decreasing phase coherence of the reflection with increasing source frequency could be an expression either of
the increasing coda energy or of the transition from weak to strong scattering. Excitation of coda waves occurs for 0.1 < ka < 10, and is strongest for kazO.1 (Wu & Aki 1988). For dominant source frequencies of 10, 30 and 90Hz, the corresponding ka-values are about 1, 3 and 9, respectively. Yet, the phase continuity of reflection decreases with increasing source frequency, and thus decreasing coda strength. The change in reflection character with frequency is thus attributed to the transition from weak to strong scattering, which is consistent with theoretical predictions for a path length of
10 km and frequencies of 10, 30, and 90 Hz (Fig. 2 ) .
An important consequence is that in the presence of realistic upper-crustal heterogeneity the traditional rule ‘higher fre- quency content equals higher resolution’ is not universally applicable. Arguably, the clearest image of the thin low-velocity zone is achieved by the source signal with the lowest frequency content (Fig. 4). This indicates that there is a range-dependent optimal maximum frequency defined by the transition from weak to strong scattering. Upper-crustal seismic imaging thus requires frequencies high enough to resolve thin layers but low enough to limit the effects of strong scattering. The above analysis may thus allow the frequency content to be optimized and the quality of reflection images to be enhanced either during the planning and acquisition phases or by subsequent processing.
Transmitted wavefields
Here, acoustic finite-difference modelling and theoretical con- siderations [see eqs ( 4 ) and ( 5 ) ] are used to explore the effects
Figure 4. Reflected wavefield calculated by finite-difference solution of the acoustic wave equation. The source is a broad-band zero-phase wavelet with a dominant frequency of (a) 10, ( b ) 30, and (c) 90 Hz.
Scattering in the upper crust 69
I 0 K . Holliger
of upper-crustal heterogeneity and strong scattering on the travetime fluctuations of transmitted waves. The seismic model considered is 2 km wide and 16 km deep and is surrounded by absorbing boundary conditions. Realistic upper-crustal velocity fluctuations (a=100 m, v=O.15, a=300 m s - ' ) are superposed on a constant background velocity of 6300 m s-'.
The source is a zero-phase plane wave with a dominant frequency of 90 Hz.
The transmitted wavefield was collected every 2 km, first-
breaks were picked numerically, and standard deviations of traveltime fluctuations (with respect to the average traveltime) were evaluated. The results are shown in Fig. 5 , together with
the theoretical curve calculated using eq. (5). Also shown are the theoretical traveltime fluctuations of an 'exponential' random medium (v=0.50) with the same values of a and 0.
The ray-theoretical velocity fluctuations for 'exponential' het- erogeneity are larger by a factor of about 2 than those for upper-crustal heterogeneity. This is due to the fact that the integral over the autocovariance function increases with increasing values of v [see eqs (1) and ( S ) ] .
The traveltime fluctuations inferred from the synthetic seis- mic data are systematically lower than predicted by ray theory, but follow the trend of the theoretical curve (Fig. 5). This observation is consistent with the results of Frankel & Clayton (1986) and Muller et al. (1992). The discrepancy between
observed and predicted traveltime fluctuations can be explained by the averaging of the velocity structure over a finite wave- length and by diffraction effects, which cause the actual wavefront to be smoother than predicted by ray theory. A
surprising outcome of this experiment is that the transition from weak to strong scattering, which is expected to occur for path lengths in excess of about 2 km (Fig. 2), does not seem
to affect the traveltime fluctuations of transmitted waves dramatically.
S C A T T E R I N G A T T E N U A T I O N
Finally, implications of upper-crustal heterogeneity for the attenuation of seismic waves are considered. Total seismic attenuation, quantified by the quality factor Q = Qtot, is composed of anelastic (Qabs) and scattering (Q,,,,) effects:
Scattering attenuation thus provides a minimum estimate of total seismic attenuation as well as a constraint for determining the anelastic component. Qscatt is related to the heterogeneity
of a 2-D medium through its power spectrum (Frankel &
Clayton 1986):
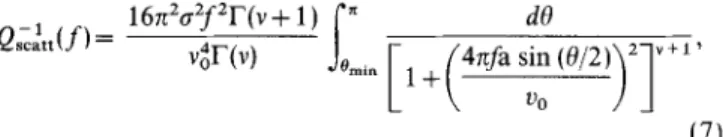
i 6 n 2 a y 2 r ( v + 1 )
jn
dQQAtt(f
) = V m V ) Bmi,L1
+(4nfa s;; (0/2))2]'+"( 7 )
where 0 is the scattering angle. Q,,,,,(f) increases with increas-
ing minimum scattering angle Omin. the choice of which is not
constrained by theory. Numerical simulations indicate that minimum scattering angles between 30" and 45" are realistic (Frankel & Clayton 1986).
Using eq. ( 7 ) and assuming Omin=300, QsCatt(f) was calcu- lated for typical upper-crustal seismic heterogeneity (a = 50,
100, and 200 m, v=O.15, a=300 m s-l, 0,=6300 m s-'). The resulting curves (Fig. 6) display high QScat,-values ranging from about 600 to 1500 in the 10 to 1000 Hz frequency range. The
0.0041 / /
/
t
1
0 I I 1 I I I 1I
0 2 4 6 8 10 12 14 16 Path Length (km)Figure 5. Theoretical (solid line) and observed traveltime standard deviations of first arrivals of a wavefield transmitted through upper-crustal seismic heterogeneity ( a = 100 m, v=O.l5,o=300 m s-', u,=6300 m s - l ) . The observed values are based on plane-wave finite-difference seismograms picked at various amplitude thresholds (open circles: 0.1 x maximum amplitude of first cycle; star: x maximum amplitude of first cycle; x-mark: lo-' a maximum amplitude of first cycle). Dashed line: theoretical curve for corresponding 'exponential' random medium ( a = 100 m, v=0.50, o = 300 m sC1, u,=6300 m s - ' ) .
Scattering in the upper crust 71
1 '0
1
oo
10' 1 o2 1o3
Frequency (Hz)
Figure 6. Scattering Q as a function of frequency for typical upper-crustal seismic heterogeneity (a= 50, 100, and 200 m, u,=6300 m s-I). Minimum scattering angle is 30"
corresponding calculations for Omin = 45" yield Q,,,,,-values that are on average about 10 per cent higher. Results for low frequencies (< 10 Hz) may not be representative. Recent obser-
vations indicate that seismic attenuation in the upper crystal- line crust is surprisingly high (Qtot< 100) (Li 1995; Holliger &
Buhnemann 1996). In view of the above results, this implies that seismic attenuation in the upper crystalline crust is dominated by anelastic effects rather than by scattering. C O N C L U S I O N S
Sonic log velocity fluctuations have been used to define a canonical model of upper-crustal seismic heterogeneity, and implications for the scattering and attenuation of seismic waves have been investigated. Small-angle scattering theory and acoustic finite-difference modelling yield compatible and comp- lementary results. The high fractal dimension characteristic of upper-crustal seismic heterogeneity results in small phase fluctuations and in a transition from weak to strong scattering at relatively low frequencies and short path lengths. Strong scattering has a major impact on the imaging capability of reflected seismic waves. Conversely, traveltime fluctuations of transmitted wavefields follow the trend of the corresponding ray-theoretical traveltime fluctuations, even in the strong scat- tering regime. Scattering attenuation in the upper crystalline crust is one to two orders of magnitude lower than the total upper-crustal seismic attenuation inferred from seismic data. This suggests that anelastic effects dominate the attenuation of seismic waves in the upper crust.
A C K N O W L E D G M E N T S
Sonic logs were provided by B. Milkereit, P. Leary, C. Juhlin, Nagra, and KTB-Projektgruppe. I am grateful to F. Cook, A.
v=0.15, 0=300 m s-',
Green, and J. Robertson for in-house reviews and to C. Sargent for proof-reading. Thorough and insightful reviews by G. Miiller and M. Roth improved the quality of this manuscript. This is ETH-Geophysics contribution number 878.
R E F E R E N C E S
Frankel, A. & Clayton, R.W., 1986. Finite difference simulations of seismic wave scattering: implications for the propagation of short- period seismic waves in the crust and models of crustal heterogeneity, J. geophys. Res., 91, 6465-6489.
Holliger, K., 1996. Seismic velocity heterogeneity of the upper crystal- line crust as derived from P-wave sonic logs, Geophys. J. Int., Holliger, K . & Biihnemann, J., 1996. Attenuation of broad-band (50-1500 Hz) seismic waves in granitic rocks near the earth's surface, Geophys. Res. Lett., 23, 1981-1984.
Holliger, K. & Levander, A., 1994. Seismic structure of gneissic/granitic upper crust: geological and petrophysical evidence from the Strona- Ceneri Zone (northern Italy) and implications for crustal seismic exploration, Geophys. J. Int., 119, 497-510.
Hurich, C.A., 1996. Statistical description of seismic reflection wave- fields: a step towards quantitative interpretation of deep seismic reflection profiles, Geophys. J. Int., 125, 719-728.
Jones, A.G. & Holliger, K., 1996. Spectral analyses of the KTB sonic and density logs using robust non-parametric methods, J. geophys. Res., submitted.
Korn, M., 1993. Seismic waves in random media, J. appl. Geophys., Levander, A.R. & Holliger, K., 1992. Small-scale heterogeneity and large-scale velocity structure of the continental crust, J. geophys. Res., 97, 8797-8804.
Li, X.-P., 1995. Estimation of apparent attenuation of crystalline rocks in the KTB area using VSP data, Scientific Drilling, 5, 199-216.
125, 813-829.
29, 247-269.
7 2
K . HolligerMilkereit, B., Green, A,, Wu, J. & Adam, E., 1994. Integrated seismic Wu, R.-S. & Aki, R., 1988. Introduction: Seismic wave scattering in a and borehole study of the Sudbury igneous complex, Geophys. Res. three-dimensionally heterogeneous earth, Pure a p p l . Geophys., 128, Miiller, G., Roth, M. & Korn, M., 1992. Seismic-wave traveltimes in Wu, R.-S., Xu, Z. & Li, X.-P., 1994. Heterogeneity spectrum and random media, Geophys. J. Int., 110, 29-41. scale-anisotropy in the upper crust revealed by the German Roth, M. & Korn, M., 1993. Single scattering theory versus numerical continental deep-drilling (KTB) holes, Geophys. Res. Lett., 21,
modelling in 2-D random media, Geophys. J. Int., 112, 124-140. 91 1-914.