IDEAL FAMILY SIZE IN FIVE
EUROPEAN COUNTRIES
P. A. VAN KEEP
International Health Foundation, 14 Rue de Hollande,
1204 Geneva, Switzerland
{Received 24th December 1970)
Summary. From part of a survey conducted in five European countries, Belgium, France, Great Britain, Italy and West Germany, data are given on the opinions of 4207 fertile married women and their husbands on ideal family size and on whether their existing children were planned or not. Data are tabulated according to the respondents' ages and the number of children in their existing families. Differences and similarities between various countries are discussed.
Introduction
An important factor in demographic prognostication is the idea that a population has about 'ideal' family size. Most young couples have definite views about their intended family size, and it would seem easy to study these and then, in subsequent years, see if such aims were achieved or exceeded. Such a study would take time. Moreover, views on ideal family size may undergo changes by external factors— perceptions from environment—and may change as the actual family size takes shape. When the actual family size exceeds the intended family size rationalization may occur and opinions as to the ideal may be revised.
The Hull family survey (Peel, 1970) shows that in newly-weds there was a definite difference between intended family size and ideal family size. As the average in-tended family size was 2-61 children and the average size of the ideal family was 3-36, obviously the norms applied by individuals to themselves are different from those they apply to society. This study reports on answers to questions about ideal family size, in a survey conducted in five European countries. On one hand, the above considerations limit the value of these data but, on the other, the fact that such data were obtained—simultaneously and under similar conditions— in five European countries, may make them useful for comparisons in other fields.
Material and methods
During July, August and September 1969 a survey was conducted in five European countries into knowledge, attitudes and practice with regard to some aspects of
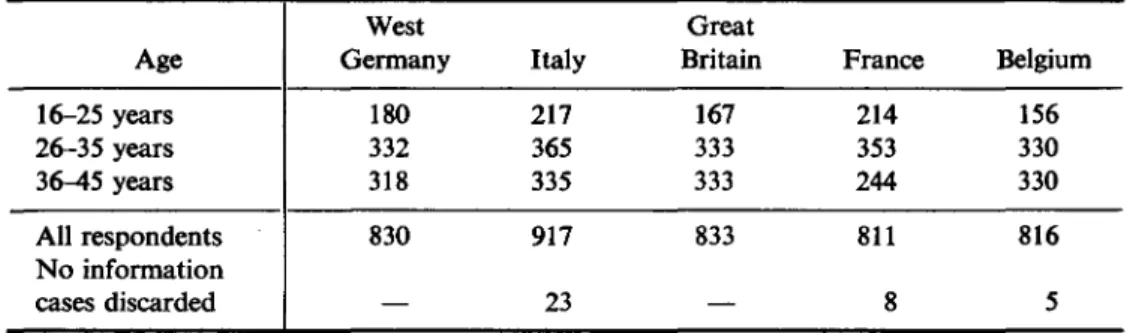
sexuality and family planning. The survey was based on quota-sampling and involved personal interviews with 1000 women in each country, Belgium, France, Great Britain, Italy and West Germany. The women interviewed were between 16 and 45 years of age (Table 1)*. Each 10-year group, in each country, comprised one-third of the total sample for each country. One-half of those in the youngest age group (16-25 years) was married while all women in the two other age groups were married.
Marplan, an opinion research company, was commissioned to assist with this project by selecting the sample, carrying out the interviews and processing the data. All interviewers were experienced in interviewing—albeit not in this type of study—and all were female. The interviews were conducted in the homes of the respondents. The questionnaire was the same in all five countries. This present report only deals with the answers to questions concerning existing family size, the respondents' ideas about ideal family size, what they thought were their husbands' views on family size and whether their children were planned or not.
Results
The breakdown of the sample into three age-groups reveals that, in practically all cases, younger married women opt for smaller families and also presume that their husbands do so (Tables 2 and 3). In judging the averaged figures for the whole sample, it should be recalled that the number of respondents in the youngest age group is roughly half that of the two other age groups, so that the lower average does not greatly influence the average of the whole sample. With the exception of the 36-45 year age group in France, the average existing family size has nowhere reached or exceeded the average ideal family size (Table 4). This is logical in the younger age groups but is surprising in the older age group because it would seem to indicate that many of these women may still be considering further expansion of their families. It may also indicate, however, that many respondents have, in answering this question, indeed given their ideas about ideal family size in general, rather than their ideals about the size of their own families.
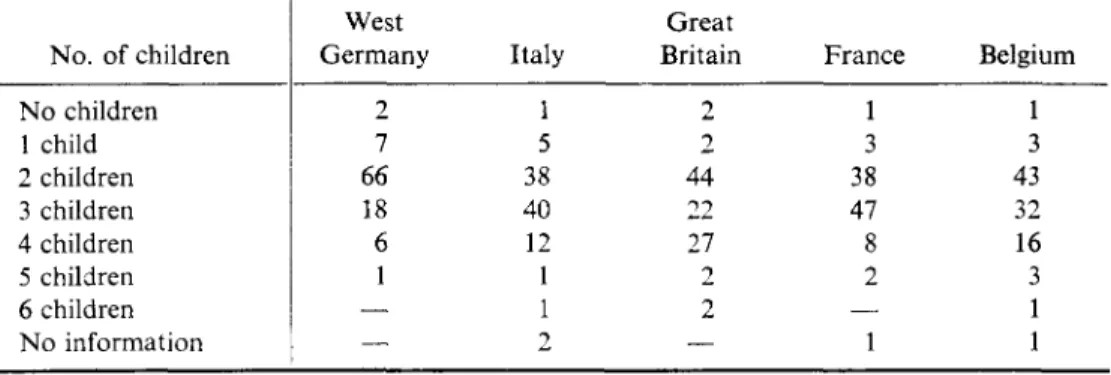
There is an overwhelming endorsement of the two-child family among the German respondents, and a surprisingly high number of French women mention three children as the ideal (Table 5). It is also surprising that the four-child family is regarded as ideal by at least one in four of the British women concerned. The voluntary childless marriage is mentioned by a very small percentage of responding women (1-2%). Table 6 shows that, according to the respondents, their husbands would opt somewhat more often for a childless family. It is interesting to observe in this survey that, with the exception of the respondents in France, the average opinion about ideal family size of the women exceeds that which could be calcula-ted from their indications about their husbands' opinions. It remains, of course, a
question whether different averages would have been found had the husbands themselves been interviewed. Roughly, it can be stated that the discrepancies in views about ideals of wives and husbands are smaller in the younger age groups. The opposite is found only in France. The fact that the calculated average family size, in the husbands' opinion, is in general lower than that calculated for the women themselves, is explained in part by the percentages of husbands who are said to opt for childless or one-child families. On the other hand, a considerable percentage of respondents indicated that their husbands would like five, six or even more children. It may be presumed that such answers—particularly when the number indicated exceeds say, six—are not always serious but may merely be a reflection of a wife's objections to her husband's attitude towards existing children and/or contraception. Such answers, however, do strongly influence the calcula-tions of an average.
When the ideal family size of the respondents is related to their existing family size (Table 7), it appears that the ideal tends to rise with the number of children in the existing family. There are two possible explanations for this: women may be building up a family size which matches their ideal, or it may be that they rational-ize the number of children they have, changing their 'ideal' as their actual family size increases.
There is a remarkable consistency in the average family size in all countries except West Germany, as indicated by women with one child and women with two children. It is also apparent that, with the exception of respondents from Great Britain, the average ideal family size as indicated by women with two children is almost the same as the average of the whole sample. The fact that the British respondents form an exception here is explained by the high average ideal family size as indicated by women with five or more children. Another interesting observa-tion is that, in three of the five countries, it was found that women without children have an average ideal family size which is higher than that of women with one child. The average ideal family size of women with one child is, in three countries, the lowest. It may be postulated also, on the basis of this observation, that the best possible moment to motivate a woman to practise family planning is after the birth of her first child.
Table 8 shows that big differences are found between the various countries in reply to the question about the desirability of pregnancies. There is, within countries, little difference between age groups, although, in general, a lower percentage of respondents of the youngest age group stated that their first preg-nancy was planned. Various explanations may be valid: it might indicate a more liberal relation between sexes, it might be that younger women have less inhibitions in admitting that their pregnancies were not planned, or it might be that these younger women have less frequently 'forgotten' that their pregnancies were un-planned. Altogether this table shows that, when the number of children in a family increases, the pregnancies are less often planned. This does not mean that the
child, as such, was not welcome, because even an unplanned child may fit in the picture of one's ideal family size. It only means that the child was, at that time, not planned—it may have been scheduled for a later date.
Discussion
The results of this study may be compared with some published figures for Germany, Great Britain and France (Table 9). All these studies were amongst women and the reported average is the average ideal family size in the opinion of these women. Realizing that sample design may be completely different, such a comparison only shows that the present data, italicized in Table 9, are not very different from earlier data as compiled by Parker Mauldin (1965).
References
PARKER MAULDIN, W. (1965) Fertility studies: knowledge, attitude and practice. Studies in
Family Planning, 7 , 1 .
PEEL, J. (1970) The Hull Family Survey. I. The survey couples, 1966. / . biosoc. Sci. 2,45.
Table 1. Number of married women in the sample by country and age group
Age 16-25 years 26-35 years 36-45 years All respondents No information cases discarded West Germany 180 332 318 830 Italy 217 365 335 917 23 Great Britain 167 333 333 833 France 214 353 244 811 8 Belgium 156 330 330 816 5
Table 2. Wives' ideal family size in averages by country and age group Age 16-25 years 26-35 years 36-45 years All respondents West Germany 216 2-29 2-31 2-25 Italy 2-56 2-62 2-73 2-64 Great Britain 2-60 2-79 3 07 2-86 France 2-37 2-66 2-83 2-65 Belgium 2-53 2-77 2-80 2-72
Table 3. Husbands' ideal family size—averages by country and age group of wives
Age 16-25 years 26-35 years 36^-5 years All respondents West Germany 2-12 2 1 6 2-22 2-17 Italy 2-60 2-60 2-63 2-61 Great Britain 2-59 2-70 2-87 2-75 France 2-49 2-62 2-84 2-65 Belgium 2-48 2-67 2-58 2-60
Table 4. Existing family size: averages by country and age group Age 16-25 years 26-35 years 36-45 years All respondents West Germany 101 1-58 2 0 0 1 62 Italy 1-04 1-59 2 0 8 1-64 Great Britain 1-48 2-31 2-77 2-33 France 1-25 2-35 3-32 2-35 Belgium 0-97 2 0 5 2-34 1-96
Table 5. Ideal family size: percentage of women by country and by number of children regarded as ideal
No. of children No children 1 child 2 children 3 children 4 children 5 children 6 children No information West Germany 2 7 66 18 6 1 — — Italy 1 5 38 40 12 1 1 2 Great Britain 2 2 44 22 27 2 2 — France 1 3 38 47 8 2 — 1 Belgium 1 3 43 32 16 3 1 1 19
Table 6. Husbands' ideal family size: percentage of husbands by country and number of children regarded as ideal
No. of children No children 1 child 2 children 3 children 4 children 5 children 6 or more children No information West Germany 4 9 63 16 6 1 1 — Italy 3 8 41 32 9 2 3 2 Great Britain 3 3 47 20 20 2 4 1 France 2 5 41 35 9 2 3 3 Belgium 5 7 43 25 14 3 2 1
Table 7. Ideal family size: averages by country and existing family size Existing no. of children No children 1 child 2 children 3 children 4 children 5 or more children Average ideal of all respondents West Germany 2-21 2 0 0 2-26 2-62 2-88 305 2-25 Italy 2-35 2-41 2-67 3 1 4 3-53 3-68 2-64 Great Britain 2-35 2-42 2-65 3-07 3-66 4-18 2-86 France 2-42 2-36 2-60 2-79 300 315 2-65 Belgium 2-52 2-39 2-63 310 3-48 3-78 2-72
Table 8. Planned children: percentage of children by country and birth order
Birth order First child Second child Third child Fourth child Fifth child Sixth child West Germany 60 65 43 31 * , * Italy 90 70 60 53 50 50 Great Britain 58 60 38 28 17 18 France 69 58 35 29 21 19 Belgium 68 57 44 42 46 32 1
Table 9. Comparison of results of this study (italicized) with earlier data taken from the literature
Country West Germany Great Britain France Year 1960 1969 1946 1960 1969 1956 1960 1969 Sample size ? 830 10,000 9 833 10,645 ? 811 Average ideal family size 2-2 2-25 2 1 2-8 2-86 2-2 2-8 2-65 Percentage wanting: Four or more Five or more
children children 4 ? 7 1 25 15 17 ? 31 4 ? ? 17 ? 11 2