DOI:10.1093/sysbio/syq057
Advance Access publication on November 10, 2010
Comparative Performance of Supertree Algorithms in Large Data Sets Using the Soapberry
Family (Sapindaceae) as a Case Study
SVENBUERKI1,2,∗, F ´ELIXFOREST3, NICOLASSALAMIN4,5,ANDNADIRALVAREZ2,4
1Real Jardin Botanico, Department of Biodiversity and Conservation, CSIC, Plaza de Murillo 2,
28014 Madrid, Spain;
2Institute of Biology, University of Neuchˆatel, Rue Emile-Argand 11, CH-2000 Neuchˆatel, Suisse; 3Molecular Systematics Section, Jodrell Laboratory, Royal Botanic Gardens, Kew, Richmond, Surrey TW9 3DS, UK;
4Department of Ecology and Evolution, Biophore, University of Lausanne, 1015 Lausanne, Switzerland; and 5Swiss Institute of Bioinformatics, G´enopode, Quartier Sorge, 1015 Lausanne, Switzerland;
∗Correspondence to be sent to: Real Jardin Botanico, Molecular Systematics Section, Jodrell Laboratory, Royal Botanic Gardens, Kew, Richmond,
Surrey TW9 3DS, UK; E-mail: [email protected].
Received 31 August 2009; reviews returned 5 January 2010; accepted 29 May 2010 Associate Editor: Olaf Bininda-Emonds
Abstract.—For the last 2 decades, supertree reconstruction has been an active field of research and has seen the develop-ment of a large number of major algorithms. Because of the growing popularity of the supertree methods, it has become necessary to evaluate the performance of these algorithms to determine which are the best options (especially with regard to the supermatrix approach that is widely used). In this study, seven of the most commonly used supertree methods are investigated by using a large empirical data set (in terms of number of taxa and molecular markers) from the worldwide flowering plant family Sapindaceae. Supertree methods were evaluated using several criteria: similarity of the supertrees with the input trees, similarity between the supertrees and the total evidence tree, level of resolution of the supertree and computational time required by the algorithm. Additional analyses were also conducted on a reduced data set to test if the performance levels were affected by the heuristic searches rather than the algorithms themselves. Based on our results, two main groups of supertree methods were identified: on one hand, the matrix representation with parsimony (MRP), MinFlip, and MinCut methods performed well according to our criteria, whereas the average consensus, split fit, and most similar supertree methods showed a poorer performance or at least did not behave the same way as the total evidence tree. Results for the super distance matrix, that is, the most recent approach tested here, were promising with at least one derived method performing as well as MRP, MinFlip, and MinCut. The output of each method was only slightly improved when applied to the reduced data set, suggesting a correct behavior of the heuristic searches and a relatively low sensitivity of the algorithms to data set sizes and missing data. Results also showed that the MRP analyses could reach a high level of quality even when using a simple heuristic search strategy, with the exception of MRP with Purvis coding scheme and reversible parsimony. The future of supertrees lies in the implementation of a standardized heuristic search for all methods and the increase in computing power to handle large data sets. The latter would prove to be particularly useful for promising ap-proaches such as the maximum quartet fit method that yet requires substantial computing power. [Heuristic search; matrix representation with parsimony; MinCut; MinFlip; Sapindaceae; supertree.]
In the last decade, phylogenies comprising large num-ber of taxa and often based on thousands of characters have been increasingly used to address evolutionary questions at all scales of time and space (e.g.,Goloboff et al. 2009; Smith et al. 2009). Such questions encom-pass for instance the radiation and divergence time of numerous groups of organisms (e.g., Bininda-Emonds et al. 2007; Christin et al. 2008; Magall´on and Castillo 2009) as well as the assessment of biodiversity patterns in the field of conservation biology (Forest et al. 2007). To date, two major groups of methods, supertrees and supermatrices, have been developed for the purpose of building these large phylogenies. Discussions over the pros and cons of these two approaches are still ongoing (Gatesy et al. 2002;Baker et al. 2009). Although there is a recent trend for evolutionary biologists to progressively give their preference to the supermatrix approach (e.g.,
Marjoram and Tavar´e 2006), numerous recent studies have shown that in the presence of incomplete lineage sorting, the analysis of multilocus data might be prob-lematic (Degnan and Rosenberg 2006,2009) and authors have proposed that the supermatrix approach is in fact less accurate than the consensus of independent gene
trees (Kubatko and Degnan 2007; Degnan et al. 2009). More refined methods to detect the correct species tree from a set of gene trees are being developed (Edwards and Gadek 2001;Degnan and Rosenberg 2009), but they currently lack generality to be used on a wide scale. The supertrees are thus still the approach of choice in many disciplines—for example, phylogeny (Salamin et al. 2002), taxonomy (e.g., Jones et al. 2002; Cardillo et al. 2004), and divergence time estimation (Bininda-Emonds et al. 2007).
The supertree methods that have been proposed cover a wide range of algorithms and optimality criteria. The relationships between these methods and their capac-ity to result in a solution similar to the supermatrix approach have not been extensively discussed and tested. Assuming that the supermatrix approach (and the resulting total evidence tree) is the best proxy is a prerequisite particularly needed because it is currently impossible to estimate the “true” phylogeny of a group based on empirical data. In this study, supertree meth-ods are compared with the supermatrix approach to determine which methods behave in a similar fashion to the former.
Historically, the development of supertrees has arisen from a need to produce more inclusive phylogenies (e.g., Purvis 1995a; Bininda-Emonds et al. 1999;
Wojciechowski et al. 2000; Jones et al. 2002; Salamin et al. 2002;Stoner et al. 2003;Cardillo et al. 2004;Price et al. 2005). The supertree framework enables the com-bination of partially overlapping phylogenetic trees ob-tained using different kinds of data (e.g., DNA, protein, morphology) and/or algorithms (e.g., parsimony, likeli-hood, distance). Since their first description by Gordon
(1986), numerous supertree algorithms have been pro-posed with more than 14 methods described to date (see reviews bySanderson et al. 1998;Bininda-Emonds et al. 2002; Bininda-Emonds 2004; Wilkinson, Cotton, et al. 2005;Cotton and Wilkinson 2007); the matrix rep-resentation with parsimony (MRP) approach is by far the most studied method and the most commonly used on empirical data sets.
Supertrees might be viewed as an extension of con-sensus techniques for the particular case of partially overlapping input trees. To better circumscribe the dif-ferent tree-building algorithms, Wilkinson et al.(2001) classified the different supertree algorithms as either “direct” or “indirect.” Direct methods are very similar to consensus techniques whereby the supertree is directly derived from the input trees without an intermediate step or matrix expressing the relationships between taxa (i.e., MinCut [MC; Semple and Steel 2000]; mod-ified MinCut [MMC; Page 2002]; gene tree parsimony [Cotton and Page 2003]). In contrast, indirect methods reduce the input trees to a matrix representation (MR) that is analyzed using an optimization criterion. Al-though the most widely used indirect method is by far the MRP (Baum 1992;Ragan 1992), at least five other indirect methods have been developed: MinFlip (Chen et al. 2003; Eulenstein et al. 2004), average consensus (AVCON; Lapointe and Cucumel 1997; Lapointe and Levasseur 2004), super distance matrix (SDM;Criscuolo et al. 2006), most similar supertree (MSS;Creevey et al. 2004), and split fit, also known as matrix representation using compatibility (Sfit; Rodrigo 1993; Creevey and McInerney 2005; different from split fit as defined by
Wilkinson, Cotton, et al. 2005).
Although the efficiency of supertree methods in infer-ring topologies in the context of missing data has been widely acknowledged (e.g.,Bininda-Emonds et al. 1999;
Lapointe et al. 1999;Jones et al. 2002;Chen et al. 2004;
Price et al. 2005), supertrees have also been considerably criticized because they are not directly based on the raw data (e.g.,Rodrigo 1993,1996;Slowinski and Page 1999;
Novacek 2001;Springer and deJong 2001;Gatesy et al. 2002), in contrast to the supermatrix approach (hereafter referred to as total evidence [TE] sensu Kluge 1989). Nonetheless, as addressed by Bininda-Emonds et al.
(2002,2003), the loss of contact with the primary data is a necessary trade-off when looking for combining all possible sources of phylogenetic information. Several studies evaluated the accuracy of a range of supertree methods using simulations (e.g., Bininda-Emonds and Sanderson 2001;Chen et al. 2003;Eulenstein et al. 2004;
Lapointe and Levasseur 2004) or empirical data sets (Salamin et al. 2002;Baker et al. 2009). However, most of them relied on a relatively small number of taxa, which do not reflect the aim of the supertree framework (i.e., reassemble single trees into wider phylogenies consid-ering higher taxonomic levels). Therefore, it is timely to evaluate the performance of different supertree meth-ods in the context of large empirical data sets.
Salamin et al. (2002) published the first empirical study in which the performance of MRP supertrees was compared with that of a TE tree using as case study the grass family (Poaceae). Here, we propose to compare the performance of 7 major supertree al-gorithms using a large empirical data set comprising taxa from the soapberry family (Sapindaceae). Since the first treatment of the family proposed byRadlkofer
(1933), the classification of Sapindaceae was highly de-bated (Muller and Leenhouts 1976;Umadevi and Daniel 1991;Thorne 2000). Recently,Buerki et al. (2009) pub-lished a worldwide molecular phylogeny of the family based on 8 markers and 154 samples representing more than 60% of the generic diversity. In this study, the au-thors recognized 4 subfamilies (Xanthoceroideae, Hip-pocastanoideae, Dodonaeoideae, and Sapindoideae) and pointed out a high level of para- or polyphyly at the tribal level and even contested the monophyly of several genera (Buerki et al. 2009,2010). Several studies pointed out that the amplification of certain molecular mark-ers in Sapindaceae is difficult because of the presence of several mutations in the flanking regions of widely used plastid and nuclear regions (e.g., matK,Harrington et al. 2005; internal transcribed spacer [ITS], Edwards and Gadek 2001). These mutations make difficult the com-pilation of multilocus data sets without missing data and the subsequent phylogenetic analyses.Buerki et al.
(2009) maximized the overlap in the sequence data and proposed a data set without missing values to infer the worldwide phylogeny of Sapindaceae. In contrast, in the present study, we consider the full phylogenetic signal from 7 plastid and 1 nuclear regions for more than 200 taxa, which represents a suitable case study to challenge the performance of different supertree methods.
This work does not constitute an argumentation in fa-vor or against supermatrix or supertree methods per se (for this purpose, seeBaker et al.(2009) and references herein). Our main goal is to assess how comparable are the existing supertree methods in the topology they are returning by measuring the distance between the supertrees and the input trees and their topological re-latedness to the TE tree. The use of a reference tree is recommended when performing comparative analyses in an empirical phylogenetic study such as the one pre-sented here. Our selection of the TE tree as basis for this comparison was guided by the necessity to pro-vide evolutionary biologists with indications of which currently used supertree inference methods might lead to phylogenetic tree estimates comparable to those ob-tained using standard phylogenetic analyses. Finally, this study also seeks to disentangle whether the differ-ent results observed between methods are caused by
the supertree algorithms themselves or by the underly-ing heuristic searches. We believe that our work brunderly-ings a new perspective on large-tree building approaches using supertree methods.
MATERIAL AND METHODS
Sampling and Sequence Data
The sampling strategy covers 104 of the 141 currently recognized genera in the family (seeBuerki et al.(2009) for a list of genera), including all subfamilies and tribes following the classic taxonomy ofRadlkofer(1933) and
Muller and Leenhouts(1976) and updates proposed by
Buerki et al.(2009). The ingroup comprises 240 samples of which 90 were newly produced for this study (on-line Appendix); the remaining samples correspond to the data set of Buerki et al. (2009). Outgroup taxa in-cluded one species of Anacardiaceae (Sorindeia sp.; de-fined as outgroup in all analyses;Savolainen et al. 2000;
Muellner et al. 2007), one species of Simaroubaceae (Har-risonia abyssinica), and one species of Meliaceae (Mal-leastrum sp.). Voucher information (including GenBank accession numbers) is provided in the online Appendix. Seven plastid regions (coding regions rpoB and matK; trnL intron; intergeneric spacers trnK–matK, trnD–trnT, trnL–trnF, and trnS–trnG) and one nuclear region (ITS region comprising the ITS1 and ITS2 internal tran-scribed spacers and the 5.8S gene) were amplified. The primer information as well as the polymerase chain re-action and sequencing protocols are as inBuerki et al.
(2009).
TE Analysis
TE analysis.—A supermatrix including all eight regi-ons was built using CONCATENATE (Alexis Criscuolo,
http://www.supertriplets.univ-montp2.fr/PhyloTools .php.). In the supermatrix, taxa for which no sequences were gathered for a given partition were coded as missing values for the corresponding cells. A maxi-mum likelihood (ML) TE tree was reconstructed using the same algorithm as for the input trees (see below). A single-partition ML analysis was performed using RAxML version 7.0.0 (Stamatakis 2006) based on the general time reversible (GTR) model with a 1000 rapid bootstrap analyses (Stamatakis et al. 2008) followed by the search of the best-scoring tree in one single run. This analysis was done using the facilities made available by the CIPRES portal in San-Diego, USA (http://8ball.sdsc.edu:8888/cipres-web/home).
A second data set was compiled by deleting taxa with missing data (hereafter reduced data set) and using the same ML approach as above.
Input Trees Reconstruction
Phylogenetic analyses were performed using the ML criterion for each of the eight DNA partitions using the same ML and bootstrap analysis settings as for the TE analysis (see above), with models of DNA evolution as determined in Buerki et al. (2009). For each partition,
the ML bootstrap majority-rule consensus trees were used as input data for supertree reconstruction. In the case of AVCON and SDM methods, ML branch lengths were optimized on the topology based on the best-fit model by using PAUP* version 4.0b10 (Swofford 2002). The choice of a bootstrap consensus tree (rather than a fully resolved tree) as input tree was done to avoid a possible bias in the ability of the different algorithms to deal with fully resolved trees; particularly with in-put trees not associated with enough variation in the sequence data (e.g., the plastid rpoB coding region), for which a fully resolved topology obligatorily incorpo-rates several random elements. Considering input trees with a resolution compatible with the level of polymor-phism of the raw data was therefore a prerequisite to perform proper comparisons between the supertrees and the TE topology. In order to quantify the amount of resolution in the consensus trees, the consensus fork index (CFI; Colless 1981) was calculated using PAUP* version 4.0b10 (Swofford 2002). A normalized CFI of 1.0 indicates that the tree is fully resolved, whereas a lower value indicates the presence of polytomies. As for the TE tree, the reduced data set input trees were obtained by deleting taxa with missing data and analyzing the reduced data set following the same approach as above.
Supertree Reconstruction
Based on the input trees, supertrees were recon-structed using the seven following methods (the criterion used to find the best tree is indicated in paren-theses): MRP (parsimony), MinFlip (flip), Sfit (com-patibility), AVCON (distance), MSS (distance), SDM (distance), and MinCut (direct method without opti-mality criterion used).
MRP analyses were performed according to both Baum and Ragan (Baum 1992; Ragan 1992; hereafter “BR”) and Purvis (1995b; hereafter “PU”) MR coding schemes. For each coding scheme, 6 binary matrices were constructed using the program SuperTree 0.85b (Salamin et al. 2002), according to the type of parsi-mony (reversible, hereafter “rev,” and irreversible, here-after “irrev”) and weighting procedure (unweighted; weighted by the inverse of the number of nodes present in each source tree, hereafter “nodes”; weighted by the bootstrap support of each node, hereafter “boot”; for more details, see Ronquist 1996; Bininda-Emonds and Bryant 1998; Salamin et al. 2002). The parsimony analyses were performed using the heuristic algorithm implemented in PAUP* version 4.0b10 (Swofford 2002) as follows: random addition sequence (nreps = 20), tree-bisection-reconnection branch swapping, STEEP-EST and MULTREES options in effect, and an unlimited value for MAXTREES. Equally most-parsimonious so-lutions were summarized using a strict consensus tree.
For the MinFlip approach (Eulenstein et al. 2004), the two unweighted BR and PU matrices calculated for MRP were used. The matrices were analyzed with Chen’s heuristic supertree software (Chen et al. 2004;
http://genome.cs.iastate.edu/CBL/download/) with 10 replicates, subtree pruning-regrafting (SPR) branch swapping, and MAXTREES = 10,000.
For the AVCON approach (Lapointe and Cucumel 1997;Lapointe and Levasseur 2004), the average path-length distance matrix was constructed using CLANN (Creevey and McInerney 2005) based on input trees on which branch lengths were optimized (see above) and the missing data were estimated with the four-point method. The choice of the four-four-point method instead of the ultrametric estimation (both proposed in CLANN; Creevey and McInerney 2005) was moti-vated byLandry et al.(1996) who demonstrated that the former provided more accurate results than the latter. The average path-length distance matrix was analyzed through both the least-squares algorithm (hereafter, AV-CON FITCH), implemented in FITCH (PHYLIP pack-age, v.3.6; Felsenstein 1993), and the neighbor-joining (NJ) algorithm (hereafter, AVCON NJ), implemented in PAUP* version 4.0b10 (Swofford 2002).
The MinCut approach (MC; Semple and Steel 2000) and modified MinCut (MMC;Page 2002) analyses were computed using RAINBOW (Chen et al. 2004).
One particularity of the SDM method lies in the pos-sibility of performing two kinds of reconstructions (Criscuolo et al. 2006): medium level SDM (hereafter MSDM) and supertree SDM (hereafter SSDM). The MSDM is somewhat situated at the interface between TE and supertree approaches. Here, DNA-based dis-tance matrices (computed with the K2P model accord-ing to the authors) are used as input data and an SDM is reconstructed following the modified average con-sensus approach proposed by Criscuolo et al. (2006). Distance matrices were reconstructed for each parti-tion using PAUP* version 4.0b10 (Swofford 2002) and the SDM was reconstructed using a Java script (see
Criscuolo et al. 2006). This matrix was subsequently analyzed based on the least-squares criterion using FITCH (PHYLIP package, v.3.6;Felsenstein 1993). In the SSDM approach, the SDM was reconstructed using in-put trees on which branch lengths were optimized (see above) and analyzed following the same procedure as the MSDM. Missing data from the SSDM matrix were also estimated based on the weighted least-squares ap-proach proposed byMakarenkov and Lapointe(2004) as implemented in T-Rex (Makarenkov 2001). This method is hereafter referred to as SSDM MW*.
Sfit analyses (Rodrigo 1993) were computed using CLANN (Creevey and McInerney 2005). Two types of supertrees were constructed using this method because the contribution of each source tree to the analysis can be normalized according to the number of taxa in each input tree (hereafter, Sfit norm) or not (hereafter, Sfit equal). For each coding scheme, heuristic searches were performed with 10 and 50 replicates, SPR branch swap-ping, nsteps = 20, and maxswaps = 10,000.
The MSS analyses (Creevey et al. 2004) were per-formed using CLANN (Creevey and McInerney 2005). As for the Sfit approach, a normalization was applied (hereafter, MSS norm) or not (hereafter, MSS equal)
to the source trees before the analysis and the heuris-tic searches were conducted with 10 and 50 replicates, SPR branch swapping, nsteps = 20, and maxswaps = 1,000,000.
Supertree Evaluation
In order to investigate the factors influencing the supertree reconstructions, we tested whether the per-formance level of each method 1) was related to the heuristic research or 2) relied on the algorithm. To as-sess the first point, the same heuristic procedure needs to be applied to all methods. However, this is not fea-sible due to the implementation of supertree methods in different softwares (e.g., CLANN, PAUP*), each with their own heuristic search strategies. Heuristic search strategies between software can bias the distances ob-served between supertrees and the TE tree. More thor-ough searches thrthor-ough the tree space will be more likely to find the best tree globally, whereas restricted search might return a local optimum that will not reflect the full potential of the supertree method. In particular, because the MRP method (analyzed in PAUP*; Swof-ford 2002) benefits from more efficient heuristic search strategies, BR/PU rev and irrev analyses (for both the full and the reduced data sets; see below) were also per-formed with a “fast” search (hereafter Fast MRP), which was set as follows: random addition sequence (nreps = 10), nearest-neighbor interchange branch swapping, STEEPEST and MULTREES options in effect, and MAXTREES = 1000 without increasing the number of sampled trees. To investigate the second point, the data sets were reduced to the same number of terminals and analyses were performed as above for all methods. In MRP, the analyses were restricted to unweighted char-acters with both normal and fast heuristic searches, and for Sfit and MSS, only analyses with 50 replicates were performed. The following performance measures were calculated on both the full and the reduced data sets.
Agreement between the supertrees and input trees.—The average normalized partition metric distance (NPM; also known as the Robinson–Foulds topological dis-tance; Robinson and Foulds 1981) between each su-pertree and the input trees (pruned to identical taxon sets) was calculated using PartitionMetric version 1.2.1 (O. R. P. Bininda-Emonds, http://www.molekularesys tematik.uni-oldenburg.de). This distance was used to evaluate the extent to which the supertrees were in agreement with the group membership expressed in the input trees. To avoid any potential bias caused by the method (i.e., the NPM distance might be influenced by the number of internal branches as shown byPhilip et al. 2005), the NPM distance to the input trees was calculated not only on the consensus trees in MRP, Min-Flip, and MSS analyses but also on each tree of the raw output and subsequently averaged (hereafter re-ferred to as “averaged”). The NPM distance is the sum of the components present in one but not both trees. A component refers to the relationships expressed by an
internal branch, which separates the members of a clade from the nonmembers (including the root) (Wilkinson, Cotton, et al. 2005). Components may entail less in-clusive relationships than the quartet distance, which places two terminals closer to each other than a third (and in the case of the quartet distance, this triplet is rooted by a fourth taxon) (Wilkinson, Cotton, et al. 2005; see below).
Similarity between supertrees and the TE tree.—The quar-tet distance (Estabrook et al. 1985; Estabrook 1992), also known as the explicitly agree distance (Wilkinson, Cotton, et al. 2005), quantifies the differences between trees of same size. It was used here to evaluate the distance between the supertrees and the TE tree by de-termining the proportion of quartets that are resolved identically in the two trees (Wilkinson, Cotton, et al. 2005). As mentioned byWilkinson, Cotton, et al.(2005), because there are more resolved quartets than compo-nents in most trees, this measure is potentially more dis-cerning than NPM distance and is not as dramatically affected by instability in a single terminal. The quartet distance was calculated using Dquad (Alexis Criscuolo,
http://www.supertriplets.univ-montp2.fr/PhyloTools .php.). On the basis of the quartet matrix of pairwise distances among trees, an unrooted “tree of trees” was built using the NJ algorithm (PHYLIP package, v.3.6;
Felsenstein 1993). This tree depicts the relationships between the supertrees and the TE tree.
RESULTS
Matrices Overview
The number of sequences included in each single matrix ranged from 80 in trnS–trnG to 199 in rpoB, and the supermatrix was composed of 1242 sequences (Table1). The alignment length varied from 363 bp in rpoB to 2156 bp in trnS–trnG (Table 1). The number of sequences that were found in a single partition only ranged from 0 (e.g., trnD–trnT) to 26 in matK. The re-duced data set matrix had 44 terminals shared by all DNA regions used in this study (Table 1). The com-plete data matrix and trees are available in TreeBASE (http://purl.org/phylo/treebase/phylows/study/TB2: S10580).
TE Tree and Input Trees
TE tree.—The supermatrix compiled for the TE anal-ysis was composed of 9657 characters (Table 1). The TE analysis (log likelihood = −79, 560.8) showed sup-port for the monophyly of Sapindaceae sensu lato as defined by Buerki et al. (2009) (see Supplementary material for the detailed TE tree). This phylogenetic hypothesis is highly congruent with the subfamilial de-limitation proposed by Buerki et al. (2009). The only exception is the inclusion of the genus Diplokeleba (pre-viously assigned to subfamily Sapindoideae) in sub-family Dodonaeoideae, thus rendering it paraphyletic. With the inclusion of this genus within Dodonaeoideae, the family is subdivided into 4 subfamilies as fol-lows: (Xanthoceroideae, (Hippocastanoideae, (Dodon-aeoideae, Sapindoideae))). The most basal lineage, Xanthoceroideae, includes only one monotypic genus, Xanthoceras sorbifolia, endemic from northern China and Korea (see Buerki et al. 2009) for more details and the Supplementary material).
Input trees.—The CFI ranged from 0.406 for rpoB to 0.760 for trnD–trnT (Table1). When the best trees were considered, no topological conflict with a bootstrap sup-port above 75% was recognized between the input trees and the TE tree.
Supertree Evaluation
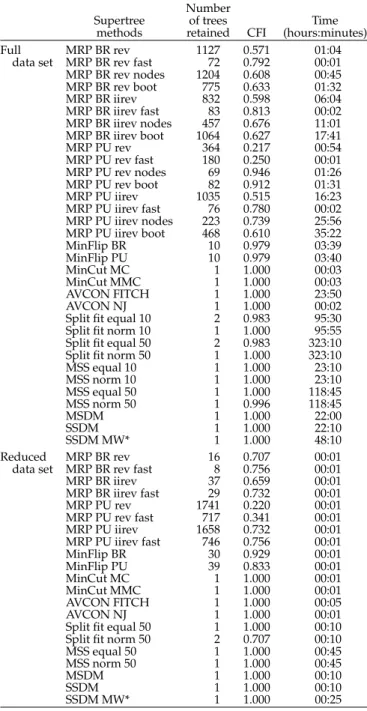
Supertrees based on the full data set show consider-able variation in number of trees retained, resolution, and computational time (Table 2). Trees were either fully (e.g., MinCut, AVCON) or partially (e.g., MRP, MinFlip) resolved (Table2). Computational times were also highly variable, ranging from less than 10 min (e.g., MinCut) to more than 10 days (e.g., some Sfit analyses; Table2). On the other hand, supertrees based on the reduced data set were highly similar accord-ing to the number of trees retained (except MRP PU, which have retained more than 500 trees), resolution (except MRP PU rev, which are much less resolved), and computational time (Table2).
Agreement between the supertrees and input trees.— When considering the full data set, the behavior of
TABLE1. Characteristics of single-gene matrices used to reconstruct input trees
Data set Number of Sequences found Alignment CFI ML Number of shared sequences
sequences in a single length bootstrap
ITS matK rpoB trnD–trnT trnK–matK trnL trnL–trnF trnS–trnG
data set consensus
IGS IGS intron IGS IGS
only tree ITS 172 6 1234 0.718 — matK 175 26 1614 0.618 122 — rpoB 199 4 363 0.406 165 144 — trnD–trnT IGS 102 0 1925 0.760 85 86 102 — trnK–matK IGS 133 0 931 0.542 112 132 131 80 — trnL intron 192 2 773 0.489 154 143 182 102 127 — trnL–trnF IGS 189 0 661 0.524 154 142 182 102 127 189 — trnS–trnG IGS 80 0 2156 0.623 69 73 80 63 66 80 80 — Supermatrix 1242 — 9657 1.000 172 175 199 102 133 192 189 80
TABLE2. Characteristics of supertrees Number
Supertree of trees Time
methods retained CFI (hours:minutes)
Full MRP BR rev 1127 0.571 01:04
data set MRP BR rev fast 72 0.792 00:01
MRP BR rev nodes 1204 0.608 00:45 MRP BR rev boot 775 0.633 01:32 MRP BR iirev 832 0.598 06:04 MRP BR iirev fast 83 0.813 00:02 MRP BR iirev nodes 457 0.676 11:01 MRP BR iirev boot 1064 0.627 17:41 MRP PU rev 364 0.217 00:54 MRP PU rev fast 180 0.250 00:01 MRP PU rev nodes 69 0.946 01:26 MRP PU rev boot 82 0.912 01:31 MRP PU iirev 1035 0.515 16:23 MRP PU iirev fast 76 0.780 00:02 MRP PU iirev nodes 223 0.739 25:56 MRP PU iirev boot 468 0.610 35:22 MinFlip BR 10 0.979 03:39 MinFlip PU 10 0.979 03:40 MinCut MC 1 1.000 00:03 MinCut MMC 1 1.000 00:03 AVCON FITCH 1 1.000 23:50 AVCON NJ 1 1.000 00:02
Split fit equal 10 2 0.983 95:30
Split fit norm 10 1 1.000 95:55
Split fit equal 50 2 0.983 323:10
Split fit norm 50 1 1.000 323:10
MSS equal 10 1 1.000 23:10 MSS norm 10 1 1.000 23:10 MSS equal 50 1 1.000 118:45 MSS norm 50 1 0.996 118:45 MSDM 1 1.000 22:00 SSDM 1 1.000 22:10 SSDM MW* 1 1.000 48:10 Reduced MRP BR rev 16 0.707 00:01
data set MRP BR rev fast 8 0.756 00:01
MRP BR iirev 37 0.659 00:01 MRP BR iirev fast 29 0.732 00:01 MRP PU rev 1741 0.220 00:01 MRP PU rev fast 717 0.341 00:01 MRP PU iirev 1658 0.732 00:01 MRP PU iirev fast 746 0.756 00:01 MinFlip BR 30 0.929 00:01 MinFlip PU 39 0.833 00:01 MinCut MC 1 1.000 00:01 MinCut MMC 1 1.000 00:01 AVCON FITCH 1 1.000 00:05 AVCON NJ 1 1.000 00:01
Split fit equal 50 1 1.000 00:10
Split fit norm 50 2 0.707 00:10
MSS equal 50 1 1.000 00:45
MSS norm 50 1 1.000 00:45
MSDM 1 1.000 00:10
SSDM 1 1.000 00:10
SSDM MW* 1 1.000 00:25
Note: See text for more details.
supertree methods was quite different, with three meth-ods (i.e., MRP, MinFlip, and MinCut) showing an NPM distance to the input trees lower than 0.5 whatever pa-rameters used and three methods (i.e., AVCON, Sfit, and MSS) with an NPM distance always higher than 0.5 (Fig.1a). The case of SDM is intermediate: whereas the distance is >0.5 for MSDM and SSDM, the level of agreement with the input trees is improved when the weighted least-squares algorithm (hereafter MW*) is applied to the SSDM matrix (i.e., NPM distance < 0.5; Fig. 1a). The latter shows a level of agreement similar
to several MRP PU rev trees as well as MinCut MC (Fig.1a). MRP BR rev and MRP BR irrev had the highest agreements with the input trees (i.e., NPM distance = ca. 0.2; Fig.1a), the latter being also the method showing the lowest NPM distance when averaged. In the case of the reduced data set, the variation among algorithms was much lower, with all NPM distances lower than 0.5 (Fig.1b). The only exception is the behavior of SDM and Sfit norm methods, which seem to perform much better in the absence of missing data and reach a level of agreement equivalent to the TE tree. As expected, the level of agreement computed on averaged NPM distances for both MRP and MinFlip was lower than when considering nonaveraged and less resolved trees (Fig.1b).
Tree of trees.—A similar pattern to the one shown above is observed in the “tree of trees” based on the full data set, with the MRP, MinFlip, and MinCut methods grouping together (with the TE tree), whereas AVCON, Sfit, and MSS are more distantly related (Fig.2). Again, the case of SDM is intermediate, with SSDM MW* be-having similarly as several MRP trees (Fig. 2a). In the reduced data set, a similar pattern is found with the ex-ception of the three SDM trees, which are closely related to MinFlip and TE trees (Fig.2b). Another difference is the placement of fast and normal MRP PU rev, which are shown to be distantly related with the TE tree (Fig.2b). In both data sets, fast and normal MRP supertrees per-formed in a similar way and grouped together (Fig.2). This is also the case for the Sfit and MSS equal supertrees based on the full data set; they clustered together irre-spective of the number of replicates (Fig.1). The quartet distances to the TE tree are expressed as vertical bar chart for all the supertrees (Fig. 3). This representation allows the comparison of the behavior of supertrees based on the reduced or full data sets and with different heuristic searches (Fig. 3). This figure is in agreement with the pattern showed in the “tree of trees,” indepen-dently of the data sets. As shown above, the method that provides the most variable performance between data sets is SDM. This method outperformed or was equiv-alent to MRP, MinFlip, and MinCut methods with the reduced data set and provided less accurate results with the full data set, with the notable exception of SSDM MW* (see above and Fig.3).
DISCUSSION
In this study, supertree methods are compared using 1) agreement between the supertrees and the input trees (the TE tree is also included for comparative purpose); 2) similarity between the supertrees and the TE tree; and 3) level of resolution and computational time. Su-pertree topologies are also discussed in light of their agreement with the systematics of Sapindaceae as pro-posed byBuerki et al.(2009). The last point does, how-ever, not stand alone and is considered in combination with the other criteria (see Table 2). Finally, further analyses based on the reduced data set provide new
FIGURE1. Compatibility of each supertree and TE tree with the input trees using the NPM distance (see text for details on the calculation of the averaged NPM distances). a) Supertrees reconstructed with the full data set. b) Supertrees reconstructed with the reduced data set. Abbreviations are explained in the text.
evidences regarding the levels of compatibility between the supertree methods in relation to the heuristic search approaches. The choice of the TE as a reference tree in evaluating the compatibility between supertrees (in-stead of considering more sophisticated criteria related to, e.g., topological properties; seeWilkinson et al. 2007) is in agreement with the objective of our study, which aims at providing indications as to which supertree methods produce results most comparable with those of the widely used supermatrix approach. This approach is especially relevant to empirical data because the “true” phylogeny is not known and therefore the supermatrix approach remains the current best proxy.
Suitability of the Sapindaceae Data Set for Supertree Comparison
Two main reasons can explain why the two data sets designed for this study are appropriate for investigating the performance of supertree methods in large data sets. First, the reduced data set is a best-case scenario because supertree analyses based on data with complete taxa overlap become similar to consensus methods. In such a case, the comparisons can be performed in a simple
framework in which the ability of algorithms to deal with missing data is not taken into account. The simple nature of the reduced data set is confirmed by the rea-sonable level of compatibility among input trees (the average NPM distance among input trees is 0.218; i.e., meaning that the average similarity among trees is ca. 78%). Second, the full data set introduces more complex-ity as the overlap between taxa decreased considerably. This is known as one of the major causes of problems for most methods (Bininda-Emonds et al. 2002,2003) and thus should have an effect on their respective perfor-mance. Our study, however, remains a fairly simple case study due to its medium to high level of missing data (a total of ca. 35% of missing sequences; Table1).
Regarding the criteria, data sets, and qualities of the heuristic searches, two main groups of supertree meth-ods were found. The first group showed the highest level of agreement to the TE and the lowest distance to input trees and included most MRP, MinFlip, and MinCut, whereas AVCON, Sfit, and MSS belonged to the second group, showing more divergence with the TE tree (Figs. 1 and 2). The distance-based SDM method showed an intermediate behavior, with at least one method (i.e., the promising SDM MW*) showing
FIGURE2. NJ “tree of trees” based on pairwise quartet distance among all trees reconstructed in this study. a) Full data set. b) Reduced data set. Abbreviations are explained in the text.
a behavior similar to that of the TE. Results for the MinCut approach are also different when considering the standard and modified algorithm, with the former showing an overall low agreement with the TE. In the first group, several supertrees (e.g., MRP BR rev, Min-Flip BR) were more in agreement with the input trees than the TE tree (see sections below for more details on MinFlip and MRP approaches). Regarding the meth-ods that performed best (MRP, MinFlip, and MinCut), a careful attention was taken to the implementation of heuristic searches that maximize the trade-off between the exploration of tree space and the computational time (e.g.,Chen et al. 2003,2004;Eulenstein et al. 2004; Table2).
Supertree Methods with a Low Agreement to TE and Input Trees
In the case of the full data set, AVCON, Sfit, MSS, SSDM, MSDM, and MinCut MC methods showed low levels of agreement with the input trees (Fig. 1a) and were not compatible with most of the subfamilial taxo-nomic delimitations within Sapindaceae as defined by
Buerki et al. (2009). These methods also branched rel-atively far away from the TE tree in the “tree of trees” analyses (Fig.2a). With the reduced data set, however, most methods performed properly, and distances to TE and input trees were much lower (Fig. 1b). This result suggests that when missing data are kept low in the input trees, the choice of a supertree method should be motivated by the kind of inferences that will be
performed on the phylogeny. For instance, an attrac-tive feature of the distance-based methods (i.e., SDM and AVCON) is their ability to produce supertrees with branch lengths, a necessary attribute for several sub-sequent analyses such as divergence time estimation and some characters and biogeographical optimiza-tion methods. Although AVCON is outperformed by the SDM approach, these two methods work well in the absence of missing data. However, when consid-ering the full data set, only one of these methods (i.e., SSDM MW*) still behaves like the TE. In AVCON, the four-point estimation of missing data provided better results than the ultrametric method with both data sets (data not shown). For SDM, both MSDM and SSDM provided similar results independently of the data sets (Figs.1–3). Based on our criteria, SDM trees constitute a very fast and suitable consensus tree method, in the case of fully overlapped data sets. However, these two methods become much less accurate with the increase of missing data (as in our case, with ca. 35% of missing data). In contrast, when applying the MW* algorithm to the SSDM matrix, the performance of the result-ing supertree is greatly improved, with the additional advantage of providing branch lengths, contrary to the MRP, MinFlip, and MinCut methods (Figs.1and2). This result is in agreement with Makarenkov and Lapointe
(2004) who showed that their algorithm outperformed all other methods for the estimation of missing data.
Of all investigated methods, MSS is the one that is the least compatible with input trees and the TE tree. This result was not expected because MSS (as well as Sfit) uses the similarity to the input trees as decision
FIGURE3. Histogram showing the quartet distances to the TE tree for all supertrees (filled bars = full data set; empty bars = reduced data set). Abbreviations are explained in the text.
criterion (Creevey et al. 2004). It also strongly contrasts with a study by Wilkinson et al. (2007) who showed, based on a smaller simulated data set and other crite-ria, that MSS is among the best supertree algorithms. This method iteratively compares each input tree to a supertree and selects the supertree that maximizes the similarity to the input trees (Creevey et al. 2004). Before their assessment, the supertrees are reduced to the same size as the input tree by pruning the terminals that are not found in the input tree. A distance matrix is then built for the supertree and the input tree by counting the number of nodes separating taxa, and the absolute sum of differences is compiled. This procedure is ap-plied to all input trees, and the scores are summed. The supertree with the lowest sum will be selected. This method is similar to Sfit, which is based on the split (or component) criterion (see Material and Methods section for more details; Creevey and McInerney 2005). Al-though similar in their procedure, the fact that Sfit relies on relationships expressed by internal branches (or com-ponents) rather than on the number of nodes separating taxa (as proposed in MSS) seems to provide a better distance measure between trees. Another method uses the number of quartets shared between two trees as the distance measure, which should record more properly the incongruence between topologies. This approach is implemented in the maximum quartet fit method (available in CLANN; Creevey and McInerney 2005).
Results based on the reduced data set showed that this method performed well because the topology is better represented by quartets than by node numbers (data not shown). This improved performance is also explained because in contrast to MSS, the maximum quartet fit cri-terion better preserves relationships expressed by input trees (as shown byWilkinson, Cotton, et al.(2005) in the case of the NPM and quartet distances; see Material and Methods section for more details). It would be interest-ing to use the maximum quartet fit method on our full data set, but it requires too much computational power to be routinely used with large data sets (furthermore, the analysis abruptly crashed every time the heuristic search was run with the full data set). Although an en-hanced performance of supertrees based on maximum quartet fit rather than MSS methods is expected, one cannot exclude that the agreement with the input trees for MSS (and even Sfit) would increase with a more appropriate heuristic search strategy.
MinCut: A Promising Family of Methods?
All indirect methods rely on an appropriate coding of the input trees followed by an efficient heuristic search to obtain a supertree, both steps influencing the quality of the supertree reconstruction process. For example, the thoroughness of the heuristic search will have a
direct impact on the supertree obtained because in-efficient heuristics will have difficulties finding the best topology. The type of coding (e.g., in MRP) can also influence heavily the performance of the supertree method (see below). Indirect methods are also usually associated with larger computational loads. In contrast, direct methods have been seen as promising alternatives as they could avoid some of these pitfalls (Sanderson et al. 1998). The MinCut supertree algorithm proposed bySemple and Steel(2000) reduces drastically the com-putational time required as it scales polynomially with the number of taxa. However, it introduces arbitrary rules when deciding which edge to cut during the trans-formation of the initial graph into a directed graph (Page 2002). The consequence is that the algorithm can discard any node not unanimously shared among input trees from appearing in the supertree (Bryant and Steel 1995;Semple and Steel 2000). As a consequence, MinCut MC on the full data set has a higher NPM distance to the input trees (relative to the other methods) than on the reduced data set that is less conflictual regarding the nodes of the input trees (Fig. 1). The MinCut MMC algorithm was proposed to remove this shortcoming by considering only compatible nodes, while keeping the same computational complexity as MinCut MC (Page 2002). Consequently, this should preserve a larger num-ber of groupings and result in smaller NPM distances to the input trees than for the MinCut MC algorithm. Both MinCut approaches on the reduced data set were very close to the best performing methods when compared with the TE tree (Fig.2b), whereas the MinCut MC had a lower agreement to the TE and input trees on the full data set (Fig. 2a). Direct methods have the appeal-ing property to sidestep the search through tree space to find the global optimum, which is an NP-complete problem that poses one of the biggest challenges to phy-logeneticists. However, this method is associated with at least one major drawback: the MinCut MC and MMC algorithms use local optimal minimum cuts to form the final directed graph; it is thus lacking an explicit global optimality criterion that could be linked to biological concepts. Nonetheless, the MinCut MMC proved to be a reliable method for the Sapindaceae data sets. It would be worthwhile to further investigate such meth-ods to fully understand their properties and how they performed under different sampling conditions.
MinFlip: The Method Closest to the Total Evidence Tree?
Eulenstein et al. (2004) implemented a new heuris-tic algorithm adapted to the flip supertree method and able to manage large input trees. The authors used a series of simulations to compare supertrees constructed with the MinFlip algorithm to those built with Min-Cut (MC and MMC) and MRP algorithms. They argued that MinFlip supertrees were far more accurate than MinCut supertrees and at least as accurate as those built with the MRP algorithm. Based on the data set and criteria presented in this study, similar trends were
recovered. MinFlip supertrees were far more similar to the TE tree than those constructed with SSDM, MSDM, AVCON, MSS, and Sfit methods and gave results simi-lar to MinCut, SSDM MW*, and MRP-based supertrees (Figs. 1–3). The relationships depicted by MinFlip su-pertrees were congruent with the systematics of Sapin-daceae. The PU coding schemes resulted in the same number of 1s as the BR, the difference being in the far larger number of missing data in the PU matrix, which should reduce the phylogenetic signal present in this matrix. The PU coding scheme goal to remove incongruence in the binary matrix comes at the cost of drastically reducing the available signal by introducing large amounts of missing data. MRP is simply taking the binary matrix as is and is left with very little infor-mation. In contrast, MinFlip modifies the structure of the binary matrix by flipping 0s and 1s and vice versa. This could, theoretically, enable the method to extract the little information present in the binary and rescue much better the PU coding scheme. This is however pure conjecture, and further investigations will be nec-essary to better understand properties of the MinFlip algorithm under various coding schemes.
MRP Method: An Equilibrium between MR, Type of Parsimony, and Characters Weights
Results presented here indicate that the MRP method is not influenced by the quality of the heuristic search or the size of the data set (Figs.1–3). These results also show that MRP represents one of the best options for supertree reconstruction, together with MinFlip. This remains true whatever criterion is applied (and even when the averaged NPM distance is considered; Fig.1), with the notable exception of MRP PU rev (see Fig.2b;
3), in which the uncertainty of the PU coding scheme combined with the reversible parsimony produces a poorly resolved topology (see Table 2) that disagrees with the TE and with Sapindaceae systematics. How-ever, this result strongly contrasts with the lower NPM distance to the input trees of the MRP PU rev topolo-gies. This contradictory result is, nonetheless, mostly due to the fact that MRP PU rev supertrees have a very low number of nodes resolved (Table2), and when all the output trees are considered, the averaged NPM dis-tances are much higher (Fig.1a). Another characteristic of the topologies resulting from the MRP PU rev anal-yses is that the performance of the algorithm on the reduced data set does not improve compared with that on the full data set, in contrast to all other methods (see Figs.1–3). This is certainly due to the PU coding strat-egy (Purvis 1995b) that maintains a high proportion of missing values even with fully overlapping input trees as in the reduced data set. The consequence is that the expected gain in performance due to larger taxon overlap is lost because of the coding of all nodes as question marks, except for the sister group. Previ-ous studies based on selected examples (Ronquist 1996;
(Salamin et al. 2002) also showed that the PU MR, which according toPurvis(1995b) aims to remove redundant information (see above), might not always meet its stated objectives and must be used with caution. With the exception of MRP PU rev, we did not obtain a sig-nificant difference between reversible and irreversible parsimony algorithms. In the present study, all the MRP supertrees (again except those based on MRP PU rev) have quartet distances to the TE tree inferior or slightly higher to 0.1 (Fig.3) and are in agreement with the sys-tematics of Sapindaceae. As mentioned above,Ronquist
(1996) argued that there is no redundant information in the MR and that the problem Purvis described is re-lated to the size of the input trees. In order to remove or decrease potential misleading relationships in the MR (introduced during the compilation of the input trees),
Ronquist (1996) proposed to weight the characters according to the bootstrap support of each node. Later on,Salamin et al.(2002) proposed to inversely weight each tree (more precisely, the characters corresponding to the tree) according to the number of its nodes to cor-rect a possible effect of tree size. In this study, no real tendency toward or against the compatibility with the TE tree is observed when the characters are weighted or not, except for MRP PU rev for which the compatibility to the TE tree is substantially increased when weighted (Fig.3).
CONCLUSIONS
This work evaluates for the first time the performance of seven major supertree reconstruction methods us-ing a large empirical data set. This study highlights the better performance of the MRP, MinFlip, and MinCut MMC methods and draw attention to the promising potential of the distance-based SDM method when the MW* algorithm is applied. MRP supertrees seem to fit the group membership of the input trees better, whereas MinFlip supertrees are generally more similar to the TE tree. MinCut supertrees constitute an intermediate solution, with a slightly lower agreement to the TE and input trees than MRP and MinFlip methods but with a better performance (according to the criteria used in this study) than AVCON, MSS, and Sfit methods.
Ideally, further investigations on the performance of supertree methods should be carried out using the same heuristic framework and preferably implemented in the same software. Additional studies based on empirical data sets would be necessary to fully understand the properties of each method. Other criteria to assess the performance of the supertree methods might also be developed, such as the investigation of monophyletic subtrees unique to single input trees (see Cotton and Page 2004). In this study, although the majority of in-put trees possessed unique taxa, they did not form monophyletic subtrees and thus did not allow us to apply this criterion. Another possible approach to as-sess the performance of supertrees without producing TE trees might be to examine the potential recognition
of unsupported clades. This can be achieved by using several recently published methods providing support for each node according to their agreement with the in-put trees (e.g.,Bininda-Emonds 2003;Wilkinson, Pisani, et al. 2005; Burleigh et al. 2006). Based on the analy-ses conducted here, we would recommend starting the exploration of supertree solutions using the MRP BR algorithm with reversible parsimony. This represents an excellent trade-off between computational time and a high compatibility with input trees and the TE tree. However, the comparative examination of the other supertree methods within the MRP and MinFlip frame-works, as well as with Mincut MMC, might substan-tially enhance the compilation of pertinent solutions, when more computational power becomes available. Finally, the SSDM MW* approach is by far the most con-vincing when branch lengths are required. In the future, it will also be worth considering the promising abilities of the maximum quartet fit method.
SUPPLEMENTARYMATERIAL
Supplementary material can be found athttp://www .sysbio.oxfordjournals.org/.
FUNDING
This work was financially supported by the lab-oratory of Evolutionary Botany at the University of Neuchˆatel (Switzerland) and a Prospective Researchers Fellowship from the Swiss National Science Foundation to S.B. (no. PBNEP3-129903), as well as Swiss National Science Foundation grants to N.S. (no. 3100A0-116412) and N.A. (no. 3100A0-116778).
ACKNOWLEDGMENTS
The first author would like to thank the members of his thesis committee for their valuable comments: Philippe K ¨upfer, Pete Lowry, Martin Callmander, and Sylvain Razafimandimbison. The authors are grateful to Herv´e Sauquet, Isabel Sanmartin, and Nils Arrigo for valuable comments. We wish to thank Alexis Criscuolo (Institut Pasteur, Paris, France) for providing free ef-ficient programs (e.g., CONCATENATE, Dquad) and help with Dquad. We are grateful to the associate ed-itor Olaf Bininda-Emonds, Mark Wilkinson, Francois-Joseph Lapointe, Chris Creevey, and one anonymous reviewer for their comments that greatly improved our manuscript. We would like to thank the editor-in-chief, Jack Sullivan, for his comments and support.
REFERENCES
Baker W.J., Savolainen V., Asmussen-Lange C.B., Chase M.W., Dransfield J., Forest F., Harley M.M., Uhl N.W., Wilkinson M. 2009. Complete generic level phylogenetic analyses of palms (Arecaceae) with comparisons of supertree and supermatrix approaches. Syst. Biol. 58:240–256.
Baum B.R. 1992. Combining trees as a way of combining data sets for phylogenetic inference, and the desirability of combining gene trees. Taxon. 41:3–10.
Bininda-Emonds O.R.P. 2003. Novel versus unsupported clades: as-sessing the qualitative support for clades in MRP supertrees. Syst. Biol. 52:839–848.
Bininda-Emonds O.R.P. 2004. New uses for old phylogenies: an intro-duction to the volume. In: Bininda-Emonds O.R.P., editor. Phyloge-netic supertrees: combining information to reveal the Tree of Life. Dordrecht (The Netherlands): Kluwer Academic. p. 3–14.
Bininda-Emonds O.R.P., Bryant H.N. 1998. Properties of matrix repre-sentation with parsimony analyses. Syst. Biol. 47:497–508. Bininda-Emonds O.R.P., Cardillo M., Jones K.E., MacPhee R.D.E., Beck
R.M.D., Grenyer R., Price S.A., Vos R.A., Gittleman J.L., Purvis A. 2007. The delayed rise of present-day mammals. Nature. 446: 507–512.
Bininda-Emonds O.R.P., Gittleman J.L., Purvis A. 1999. Building large trees by combining phylogenetic information: a complete phy-logeny of the extant Carnivora (Mammalia). Biol. Rev. 74:143–175. Bininda-Emonds O.R.P., Gittleman J.L., Steel M.A. 2002. The
(Su-per)tree of life: procedures, problems, and prospects. Ann. Rev. Ecol. Syst. 33:265–289.
Bininda-Emonds O.R.P., Jones K.E., Price S.A., Grenyer R., Cardillo M., Habib M., Purvis A., Gittleman J.L. 2003. Supertrees are a necessary not-so-evil: a comment on Gatesy et al. Syst. Biol. 52:724–729. Bininda-Emonds O.R.P., Sanderson M.J. 2001. Assessment of the
ac-curacy of matrix representation with parsimony analysis supertree construction. Syst. Biol. 50:565–579.
Bryant D., Steel M. 1995. Extension operations on sets of leaf-labeled trees. Adv. Appl. Math. 16:425–453.
Buerki S., Forest F., Acevedo-Rodr´ıguez P., Callmander M.W., Nylander J.A.A., Harrington M., Sanmart´ın I., K ¨upfer P., Alvarez N. 2009. Plastid and nuclear DNA markers reveal intricate relation-ships at subfamilial and tribal levels in the soapberry family (Sapin-daceae). Mol. Phylogenet. Evol. 51:238–258.
Buerki S., Phillipson P.B., Lowry P.P. 2nd, Callmander M.W. 2010. Molecular phylogenetics and morphological evidence support recognition of Gereaua, a new endemic genus of Sapindaceae from Madagascar. Syst. Bot. 35:172–180.
Burleigh J.G., Driskell A.C., Sanderson M.J. 2006. Supertrees boot-strapping methods for assessing phylogenetic variation among genes in genome-scale data sets. Syst. Biol. 55:426–440.
Cardillo M., Bininda-Emonds O.R.P., Boakes E., Purvis A. 2004. A species-level phylogenetic supertree of marsupials. J. Zool. 264:11–31.
Chen D., Diao L., Eulenstein O., Fernandez-Baca D., Sanderson M.J. 2003. Flipping: a supertree construction method. In: Janowitz M., Lapointe F.-J., McMorris F.R., Mirkin B., Roberts F.S., editors. Bioconsensus. Providence (RI): American Mathematical Society (DIMACS series in discrete mathematics and theoretical computer science). p. 135–160.
Chen D., Eulenstein O., Fernandez-Baca D. 2004. Rainbow: a toolbox for phylogenetic supertree construction and analysis. Bioinformat-ics. 20:2872–2873.
Christin P.A., Besnard G., Samaritani E., Duvall M.R., Hodkinson T.R., Savolainen V., Salamin N. 2008. Oligocene CO2 decline promoted C4 photosynthesis in grasses. Curr. Biol. 18:37–43.
Colless D.H. 1981. Predictivity and stability in classifications: some comments on recent studies. Syst. Biol. 30:325–331.
Cotton J.A., Page R.D.M. 2003. Gene tree parsimony vs. uninode cod-ing for phylogenetic reconstruction from duplicate genes. Mol. Phy-logenet. Evol. 29:298–308.
Cotton J.A., Page R.D.M. 2004. Tangled trees from multiple mark-ers: reconciling conflict between phylogenies to build molecular supertrees. In: Bininda-Emonds O.R.P., editor. Phylogenetic su-pertrees: combining information to reveal the Tree of Life. Dor-drecht (The Netherlands): Kluwer Academic. p. 107–126.
Cotton J.A., Wilkinson M. 2007. Majority-rule supertrees. Syst. Biol. 56:445–452.
Creevey C.J., Fitzpatrick D.A., Philip G.K., Kinsella R.J., O’Connell M.J., Pentony M.M., Travers S.A., Wilkinson M., McInerney J.O. 2004. Does a tree-like phylogeny only exist at the tips in the prokaryotes? Proc. R. Soc. B. 271:2552–2558.
Creevey C.J., McInerney J.O. 2005. Clann: investigating phylogenetic information through supertree analyses. Bioinformatics. 21:390– 392.
Criscuolo A., Berry V., Douzery E.J.P., Gascuel O. 2006. SDM: a fast distance-based approach for (super)tree building in phyloge-nomics. Syst. Biol. 55:740–755.
Degnan J.H., DeGiorgio M., Bryant D., Rosenberg N.A. 2009. Prop-erties of consensus methods for inferring species trees from gene trees. Syst. Biol. 58:35–54.
Degnan J.H., Rosenberg N.A. 2006. Discordance of species trees with their most likely gene trees. PLoS Genet. 2:762–768.
Degnan J.H., Rosenberg N.A. 2009. Gene tree discordance, phyloge-netic inference, and the multispecies coalescent. Trends Ecol. Evol. 24:332–340.
Edwards K.J., Gadek P.A. 2001. Evolution and biogeography of Alec-tryon (Sapindaceae). Mol. Phylogenet. Evol. 20:14–26.
Estabrook G.F. 1992. Evaluating undirected positional congruence of individual taxa between two estimates of the phylogenetic tree for a group of taxa. Syst. Biol. 41:172–177.
Estabrook G.F., McMorris F.R., Meacham C.A. 1985. Comparison of undirected phylogenetic trees based on subtrees of four evolution-ary units. Syst. Zool. 34:193–200.
Eulenstein O., Chen D.H., Burleigh J.G., Fernandez-Baca D., Sanderson M.J. 2004. Performance of flip supertree construction with a heuristic algorithm. Syst. Biol. 53:299–308.
Felsenstein J. 1993. PHYLIP: phylogenetic inference package. Version 3.5c. Seattle (WA): University of Washington.
Forest F., Grenyer R., Rouget M., Davies T.J., Cowling R.M., Balmford A., Faith D.P., Manning J.C., Proches¸ S¸., van der Bank M., Reeves G., Hedderson T.A.J., Savolainen V. 2007. Preserving the evolutionary potential of floras in biodiversity hotspots. Nature. 445:757–760. Gatesy J., Matthee C., Desalle R., Hayashi C. 2002. Resolution of a
su-pertree/supermatrix paradox. Syst. Biol. 51:652–664.
Goloboff P.A., Catalano S.A., Mirande J.M., Szumik C.A., Arias J.S., K¨allersj¨o M., Farris J.S. 2009. Phylogenetic analysis of 73 060 taxa corroborates major eukaryotic groups. Cladistics. 25:211–230. Gordon A.D. 1986. Consensus Supertrees: the synthesis of rooted trees
containing overlapping sets of labeled leaves. J. Classif. 3:31–39. Harrington M.G., Edwards K.J., Johnson S.A., Chase M.W., Gadek P.A.
2005. Phylogenetic inference in Sapindaceae sensu lato using plas-tid matK and rbcL DNA sequences. Syst. Bot. 30:366–382.
Jones K.E., Purvis A., MacLarnon A., Bininda-Emonds O.R.P., Simmons N.B. 2002. A phylogenetic supertree of the bats (Mam-malia: Chiroptera). Biol. Rev. 77:223–259.
Kluge A.G. 1989. A concern for evidence and a phylogenetic hypothe-sis of relationships among Epicrates (Boidae, Serpentes). Syst. Zool. 38:7–25.
Kubatko L.S., Degnan J.H. 2007. Inconsistency of phylogenetic esti-mates from concatenated data under coalescence. Syst. Biol. 56: 17–24.
Landry P.A., Lapointe F.J., Kirsch J.A.W. 1996. Estimating phylogenies from lacunose distance matrices: Additive is superior to ultrametric estimation. Mol. Biol. Evol. 13:818–823.
Lapointe F.J., Cucumel G. 1997. The average consensus procedure: combination of weighted trees containing identical or overlapping sets of taxa. Syst. Biol. 46:306–312.
Lapointe F.J., Kirsch J.A.W., Hutcheon J.M. 1999. Total evidence, con-sensus, and bat phylogeny: a distance-based approach. Mol. Phylo-genet. Evol. 11:55–66.
Lapointe F.-J., Levasseur C. 2004. Everything you always wanted to know about the average consensus, and more. In: Bininda-Emonds O.R.P., editor. Phylogenetic supertrees: combining information to reveal the Tree of Life. Dordrecht (The Netherlands): Kluwer Aca-demic. p. 87–105.
Magall´on S., Castillo A. 2009. Angiosperm diversification through time. Am. J. Bot. 96:349–365.
Makarenkov V. 2001. T-Rex: reconstructing and visualizing phyloge-netic trees and reticulation networks. Bioinformatics. 17:664–668. Makarenkov V., Lapointe F.J. 2004. A weighted least-squares approach
for inferring phylogenies from incomplete distance matrices. Bioin-formatics. 20:2113–2121.
Marjoram P., Tavar´e S. 2006. Modern computational approaches for analysing molecular genetic variation data. Nat. Genet. 7:759–770.
Muellner A.N., Vassiliades D.D., Renner S.S. 2007. Placing Bieber-steiniaceae, a herbaceous clade of Sapindales, in a temporal and geographic context. Plant Syst. Evol. 266:233–252.
Muller J., Leenhouts P.W. 1976. A general survey of pollen types in Sapindaceae in relation to taxonomy. In: Ferguson I.K., Muller J., editors. The evolutionary significance of the exine. London: Aca-demic Press. p. 407–445.
Novacek M.J. 2001. Mammalian phylogeny: genes and supertrees. Curr. Biol. 11:R573–R575.
Page R.D.M. 2002. Modified mincut supertrees. Lect. Notes Comput. Sci. 2452:537–551.
Philip G.K., Creevey C.J., McInerney J.O. 2005. The Opisthokonta and the Ecdysozoa may not be clades: stronger support for the grouping of plant and animal than for animal and fungi and stronger support for the Coelomata than Ecdysozoa. Mol. Biol. Evol. 22:1175–1184. Price S.A., Bininda-Emonds O.R.P., Gittleman J.L. 2005. A complete
phylogeny of the whales, dolphins and even-toed hoofed mammals (Cetartiodactyla). Biol. Rev. 80:445–473.
Purvis A. 1995a. A composite estimate of primate phylogeny. Philos. Trans. R. Soc. Lond. B. 348:405–421.
Purvis A. 1995b. A modification to Baum and Ragan’s method for combining phylogenetic trees. Syst. Biol. 44:251–255.
Radlkofer L. 1933. Sapindaceae. In: Engler A., editor. Das Pflanzen-reich IV (Heft 98a-h). Leipzig (Germany): Verlag von Wilhelm Engelmann. p. 1–1539.
Ragan M.A. 1992. Phylogenetic inference based on matrix representa-tion of trees. Mol. Phylogenet. Evol. 1:53–58.
Robinson D.F., Foulds L.R. 1981. Comparison of phylogenetic trees. Math. Biosci. 53:131–147.
Rodrigo A.G. 1993. A comment on Baum method for combining phy-logenetic trees. Taxon. 42:631–636.
Rodrigo A.G. 1996. On combining cladograms. Taxon. 45:267–274. Ronquist F. 1996. Matrix representation of trees, redundancy, and
weighting. Syst. Biol. 45:247–253.
Salamin N., Hodkinson T.R., Savolainen V. 2002. Building supertrees: an empirical assessment using the grass family (Poaceae). Syst. Biol. 51:136–150.
Sanderson M.J., Purvis A., Henze C. 1998. Phylogenetic supertrees: as-sembling the trees of life. Trends Ecol. Evol. 13:105–109.
Savolainen V., Fay M.F., Albach D.C., Backlund A., van der Bank M., Cameron K.M., Johnson S. A., Lled ´o M.D., Pintaud J.-C., Powell M., Sheahan M.C., Soltis D.E., Soltis P.S., Weston P., Whitten W.M., Wurdack K.J., Chase M.W. 2000. Phylogeny of the eudicots: a newly complete familial analysis based on rbcL gene sequences. Kew Bull. 55: 257–309.
Semple C., Steel M. 2000. A supertree method for rooted trees. Discrete Appl. Math. 105:147–158.
Slowinski J.B., Page R.D.M. 1999. How should species phylogenies be inferred from sequence data? Syst. Biol. 48:814–825.
Smith A.S., Beaulieu J.M., Donoghue M.J. 2009. Mega-phylogeny ap-proach for compatarive biology: an alternative to supertree and su-permatrix approaches. BMC Evol. Biol. 9:37.
Springer M.S., deJong W.W. 2001. Phylogenetics—which mammalian supertree to bark up? Science. 291:1709–1711.
Stamatakis A. 2006. RAxML-VI-HPC: maximum likelihood-based phylogenetic analyses with thousands of taxa and mixed models. Bioinformatics. 22:2688–2690.
Stamatakis A., Hoover P., Rougemont J. 2008. A rapid bootstrap algo-rithm for the RAxML web-servers. Syst. Biol. 57:758–771.
Stoner C.J., Bininda-Emonds O.R.P., Caro T.M. 2003. The adaptive significance of coloration in lagomorphs. Biol. J. Linn. Soc. 79: 309–328.
Swofford D.L. 2002. PAUP*: phylogenetic analysis using parsi-mony (*and other methods). Version 4. Sunderland (MA): Sinauer Associates.
Thorne R.F. 2000. The classification and geography of the flower-ing plants: dicotyledons of the class Angiospermae. Bot. Rev. 66: 441–647.
Umadevi I., Daniel M. 1991. Chemosystematics of the Sapindaceae. Feddes Repert. 102:607–612.
Wilkinson M., Cotton J.A., Creevey C., Eulenstein O., Harris S.R., Lapointe F.J., Levasseur C., McInerney J.O., Pisani D., Thor-ley J.L. 2005. The shape of supertrees to come: tree shape re-lated properties of fourteen supertree methods. Syst. Biol. 54: 419–431.
Wilkinson M., Cotton J.A., Lapointe F.J., Pisani D. 2007. Proper-ties of supertree methods in the consensus setting. Syst. Biol. 56:330–337.
Wilkinson M., Pisani D., Cotton J.A., Corfe I. 2005. Measuring support and finding unsupported relationships in supertrees. Syst. Biol. 54:823–831.
Wilkinson M., Thorley J.L., Littlewood D.T.J., Bray R.A. 2001. Towards a phylogenetic supertree of Platyhelrmnthes? In: Littlewood D.T.J., Bray R.A., editors. Interrelationships of the Platyhelminthes. Lon-don: Taylor and Francis. p. 292–301.
Wojciechowski F., Sanderson M.J., Steele P., Liston A. 2000. Molecu-lar phylogeny of the ”temperate herbaceous tribes” of papilionoid legumes: a supertree approach. In: Herendeen P., Bruneau A., ed-itors. Advances in legume systematics. Kew (UK): Royal Botanic Gardens. p. 277–298.