Brain (1996), 119, 2085-2095
Striatal glucose metabolism and dopamine D
2
receptor binding in asymptomatic gene carriers and
patients with Huntington's disease
A. Antonini,1 K. L. Leenders,1-4 R. Spiegel,2 D. Meier,3 P. Vontobel,1 M. Weigell-Weber,2
R. Sanchez-Pernaute,5 J. G. de Yebenez,5 P. Boesiger,3 A. Weindl6 and R. P. Maguire1
1 PET Department, Paul Scherrer Institute, Vdligen,
2Institute of Medical Genetics, University of Zurich,
^institute of biomedical Engineering, University and ETH Zurich, ^Department of Neurology, University Hospital Zurich, Switzerland, 5Servicio de Neurologia, Fundacion
Jimenez Diaz, Madrid, Spain and the ^Department of Neurology, Technical University of Munich, Germany
Correspondence to: Professor K. L Leenders, PET Department, Paul Scherrer Institute, CH-5232 Vdligen, Switzerland
Summary
We used PET scans with the tracers []SF]fluorodeoxyglucose
(FDG) and [uC]raclopride (RACLO) to study glucose
metabolism and dopamine D2 receptor binding in the caudate
nucleus and putamen of 18 carriers of the Huntington's disease gene mutation (10 asymptomatic subjects and eight untreated symptomatic Huntington's disease patients in an early disease stage). We also performed MRI scans and measured the bicaudate ratio (BCR) in the same subjects. Data were compared with those from nine mutation-negative members of Huntington's disease families and separate groups of age matched controls. The PET scans were repeated 1.5-3 years later in six of the asymptomatic gene carriers. Symptomatic Huntington 's disease patients showed a marked reduction of FDG and RACLO uptake in the caudate nucleus and putamen and a significant increase of BCR. Asymptomatic mutation carriers revealed significant hypometabolism in the caudate nucleus and putamen. The RACLO binding was significantly decreased in the putamen. Decrements of caudate nucleus tracer uptake, particularly RACLO, correlated significantly with BCR increases in
both symptomatic and asymptomatic gene carriers. In asymptomatic carriers, metabolic and receptor binding decreases were also significantly associated with the CAG repeat number but not with the individual's age. Discriminant function analysis correctly classified clinical and genetic status in 24 of 27 subjects on the basis of their striatal PET values (83% sensitivity and 100% specificity). Three asymptomatic mutation carriers were classified/grouped together with mutation-negative subjects, indicating that these individuals had normal striatal RACLO and FDG uptake. Follow-up PET data from gene-positive subjects showed a significant reduction in the mean striatal RACLO binding of 6.3% per year. Striatal glucose metabolism revealed an overall non significant 2.3% decrease per year. These data indicate that asymptomatic Huntington's disease mutation carriers may show normal neuronal function for a long period of life. These findings also suggest that it may be possible to predict when an asymptomatic gene carrier will develop clinical symptoms from serial PET measurements of striatal function.
Keywords: Huntington's disease; PET; MRI; glucose metabolism; dopamine D2 receptors
Abbreviations: BCR = bicaudate ratio; FDG = [18F]fluorodeoxyglucose; GMI = glucose metabolic index; RACLO = ["CJraclopride; rCMRG = regional cerebral metabolic rate for glucose; ROI = region(s) of interest
Introduction
Huntington's disease is a dominantly inherited disorder characterized by progressive dementia and chorea. Symptomatic Huntington's disease patients show severe loss © Oxford University Press 1996
of striatal neurons (Vonsattel et al., 1985). In particular, striatal spiny neurons expressing dopamine receptors are primarily affected by the disease, whereas the presynaptic
dopaminergic system is not involved (Reisine et al., 1978; Spokes, 1980; Cross and Rosser, 1983; Reiner et al., 1988). However, because post-mortem material from asymptomatic gene carriers is extremely rare (Albin et al., 1992), very little is known about changes taking place in the neurons before the disease becomes clinically manifest. Knowledge of onset, duration and progression of neuronal impairment before clinical onset would also be relevant in view of possible future treatment of yet asymptomatic Huntington's disease mutation carriers with neuroprotective drugs or striatal implantation methods.
PET studies in Huntington's disease have focused mainly on the investigation of striatal glucose metabolism. Symptomatic Huntington's disease patients revealed significant hypometabolism in the basal ganglia (Kuwert et al., 1990), whereas a reduction (Hayden et al., 1987; Mazziotta et al., 1987) as well as normal glucose metabolism (Young et al., 1987) have been shown in the caudate nucleus in at risk subjects. In addition, PET studies of Huntington's disease patients and asymptomatic at risk subjects have also shown severe involvement of the postsynaptic dopaminergic system but no change of dopaminergic nerve terminals (Leenders et al., 1986; Hagglund et al., 1987; Brandt et al., 1990; Ichise et al., 1993; Turjanski et al., 1995; Weeks et al., 1996).
MRI has demonstrated tissue loss in the putamen and
caudate nucleus, not only of Huntington's disease patients (Harris et al., 1992), but also of asymptomatic carriers indicating that striatal atrophy may occur before the clinical onset of chorea (Aylward et al., 1994). On the other hand,
there is evidence suggesting that striatal metabolism can be significantly decreased in the absence of atrophy (Mazziotta et al., 1987) and that metabolic and structural changes may develop independently in the caudate nucleus (Grafton et al, 1992).
Since the Huntington's disease mutation has been discovered only recently (an expanded CAG triplet repeat in the IT15 gene on chromosome 4p16.3; Huntington's Disease Collaborative Research Group, 1993), most of the above mentioned studies reported only likelihood, without definitive assessment, of gene carrier status.
The purpose of this study was to assess the receptor and metabolic status of striatal projection neurons in genetically proven carriers of the Huntington's disease mutation. We used PET and the tracers RACLO (dopamine D2 antagonist) and FDG to investigate dopamine D2 receptor binding and glucose metabolism in eight symptomatic and 10 asymptomatic Huntington's disease mutation carriers. To assess the relationship between functional changes expressed by PET and anatomical changes in the striatal region, we also measured the BCR on MRI scans. In addition, we performed discriminant function analysis to assess whether the genetic and clinical status of the subjects could be predicted from putamen and caudate nucleus functional values.
Methods
Patients
Eight symptomatic Huntington's disease patients in an early stage of the disease were studied (mean age 44±6 years;
Table 1 Subjects in this study Subjects Age
(years) Early stage Huntington's disease
1 2 3 4 5 6 7 8 Mean age 34 40 40 52 43 43 46 48 (±SD) = 44 (±6) Sex (male/female) patients m m f m m m f m
Asymptomatic Huntington's disease mutation carriers 9 10 11 12 13 14 15 16 17 18 Mean age 21 27 28 29 30 41 35 34 27 26 (±SD) = 30 (±6) f m f f m f m m m f Disease duration (years) 3 2 2 3 1.5 1 1 4 -_ _ _ — — _ _ — _ CAG repeats Expanded 48 46 44 42 42 42 44 44 47 43 42 45 46 43 46 40 45 42 Normal 19 20 17 17 17 19 18 17 24 22 22 23 19 13 18 10 18 16 Inheritance (maternal/paternal) P m m P m m m m P P P P m P P m m P
Metabolism and receptor binding in Huntington 's disease 2087 ±SD here and throughout); their symptom duration was
between 5 months and 3 years (see Table 1); three patients were at stage I and one at stage II according to the Shoulson and Fahn scale (Shoulson and Fahn et ai, 1979). In addition, 10 asymptomatic carriers of the Huntington's disease mutation (mean age 30±6 years) were studied (Table 1). Subjects 5 and 6 were monozygotic twins and both had chorea onset at the age of 42 years. Among the 10 asymptomatic Huntington's disease carriers, Subjects 10, 11 and 14 were siblings and Subjects 9 and 13 were second cousins. The remaining subjects belonged to unrelated pedigrees. None of the individuals presented in this study had previously been exposed to neuroleptics or other drugs which may influence the dopaminergic system. Nine healthy mutation-negative members of Huntington's disease families (mean age 27±4 years; range 22-34 years) were also studied with both PET tracers as control subjects. Gene-negative subjects showed no difference in their PET values when compared with unrelated controls.
Each subject underwent a general neurological examination before PET scanning. None of the asymptomatic mutation carriers showed any sign of chorea, clinical abnormalities in eye movements or other 'soft signs', as defined according to a previously published scale (Young et al., 1986; Grafton et al.. 1990). One asymptomatic Huntington's disease carrier (no. 14) showed occasional subtle fidgeting of her limbs at rest during one of the two PET measurements, but no other abnormalities. This observation did not allow the diagnosis of Huntington's disease in this person. Clinical investigations were repeated in those asymptomatic gene carriers who had a second series of PET scans. On that occasion none of the subjects showed any sign of chorea. However, we detected 'soft signs' consisting of altered finger tapping control in one (no. 14) and increased latency in saccade initiation and mild slowing in saccade velocity in two of the six subjects (nos 13 and 14).
Separate groups of healthy controls were used for comparison. Data from the control subjects in this study have been published previously (Antonini et al., \993b, 1995). For RACLO. data from 14 controls in the age range of 21 —49 years (mean 3O±8 years) and for FDG, data from 20 other healthy subjects in the age range of 2 2 ^ 4 years (mean 34±6 years) were used. The study was approved by the ethical committee of the Zurich University Hospital. Informed consent was obtained from each individual.
Genetic analysis
Predictive testing was performed in subjects at risk for Huntington's disease according to recommended guidelines (World Federation of Neurology 1989: see also Skraastad et al.. 1991).
Standard procedures were used to isolate DNA from blood (Miller et al., 1988). Amplification of the expanded and normal (CAG)n-triplet sequences was carried out by polymerase chain reaction (PCR) using previously published
primers (Riess et al., 1993). Individuals with CAG repeat numbers higher than 37 were classified as Huntington's disease gene carriers. The normal range was assumed to be between 11 and 34 repeats (Huntington's Disease Collaborative Research Group, 1993).
PET scanning procedure
The scanner used was a CTI/Siemens type 933/04—16, with four rings, which records seven planes simultaneously (transaxial resolution after reconstruction is 6.5 mm full width at half maximum).
The subjects were positioned in the scanner using a personalized head mould prepared by pouring urethane foam into a polystyrene holder. The head was aligned parallel to the orbitomeatal line using a laser beam. The gantry field of view was chosen to cover the region containing the complete striatum and the upper half of the cerebellum. The same head mould and, where possible, the same gantry coordinates were used to guarantee precise repositioning. In six asymptomatic gene carriers a stereotactic head fixation and repositioning system (Fixster Instruments®, Stockholm, Sweden) was also used. This head fixation system was used in five of the six asymptomatic gene carriers who had follow-up scans. This stereotactic frame ensures head repositioning with an error of <1 mm.
After an initial 10 min transmission scan performed using an external 68Ge ring source, RACLO (Ehrin et al., 1987) or FDG were infused i.v. in 10 ml of physiological saline for 3 min. The injected dose for both tracers ranged from 112.2 to 226.4 MBq. The RACLO specific activity at the time of injection was on average 1765 MBq |imol~'. The FDG (16 time frames for a total of 48 min) and RACLO (20 time frames for a total of 58 min) scans were performed on separate occasions with an interval of
I day to 2 weeks.
The time course of plasma I8F activity was determined by sampling radial arterial blood. From the FDG scan and blood activity curves, parametric images of regional cerebral metabolic rate for glucose (rCMRG expressed in (imol min"1) were calculated on a pixel-by-pixel basis. The lumped constant used was 0.52.
PET data analysis
[
nC]Rac lop ride
Regions of interest (ROI) were placed on a video display unit in a standard template arrangement on the putamen (elliptical region of 250 mm2) and caudate nucleus (circular region of 62.5 mm2). An integral image was produced by adding the frames corresponding to the last 30 min of data acquisition. The ROI were defined on this image, on the plane where the maximal uptake was found and visually adjusted to maximize the average ROI value. They were then
superimposed on the dynamic data set to study time dependent data. Cerebellar ROI (one circular region of 780 mm2 over the cerebellar lobe of each hemisphere) were defined on one of the lower planes in which the outline of the cerebellar hemispheres was most clearly visible. For each time frame, averaged radioactivity of each ROI was determined and decay corrected to the start of tracer injection.
Specific RACLO binding in right and left putamen and caudate nucleus was calculated for each subject 35-58 min after tracer administration, using the ratio index of Farde et al. (1986):
RACLO index = (target ROI activity - cerebellar activity)/ cerebellar activity.
The RACLO index values from the right and left brain hemisphere were then averaged.
Longitudinal RACLO changes were calculated in % change per year of the caudate and putamen index using the following equation (Grafton et al., 1992):
% change per year = 100X[l - (2nd index/lst index)]/ (scan interval in years).
[
l8F]Fluorodeoxy glucose
The ROI were placed on the plane where the anatomical structure of putamen and caudate nucleus was most clearly visible and visually adjusted to maximize the average ROI value. The same standard template used for RACLO was applied to define striatal ROI. On the same plane a global ROI was defined (one ellipse adjusted in size to cover the whole brain). To reduce intersubject variability, rCMRG ROI values were then normalized to the corresponding global values to calculate a glucose metabolic index (GMI). Values of the right and left brain hemisphere were averaged. Longitudinal FDG changes were calculated using the same equation as for RACLO.
MRI data analysis
Subjects were studied with an MR Gyroscan (Philips) scanner operating at 1.5 T. Seven of the eight Huntington's disease patients and nine of the 10 asymptomatic mutation-positive individuals also had MRI scanning. Each subject had their MRI investigation within 1 week after PET. It was not possible to obtain MRI data from mutation-negative subjects. Twenty-five T2-weighted transverse contiguous slices (each 4 mm thick) were obtained using a spin-echo sequence from each subject as previously reported (Antonini et al., 1993a). The slice orientation was parallel to the orbitomeatal line. The axial plane which cut through the mid-axial section of the caudate nucleus was chosen. The BCR was calculated by dividing the minimal distance between the caudate indentations of the frontal horns by the distance between the outer tables of the skull along the same line, then multiplying by 100 (Barr et al., 1978). Patient PET and MRI data were
compared with those from a separate control group. Data regarding these healthy subjects have been published before (Antonini et al.,
Statistics
Data were analysed using the Systat (SYSTAT Inc., Evanston, 111., USA) statistic package. Mean values for each group were compared using analysis of variance (ANOVA). Correlation analysis was performed using single and multiple regression. Discriminant functional analysis was used to categorize subjects on the basis of their RACLO and FDG values in the putamen and caudate nucleus and their BCRs. Specificity [(true negative)/(true negative + false positive)] and sensitivity [(true positive)/(true positive + false negative)] were then calculated, based on discriminant analysis categorization obtained from each of the above-mentioned variables.
Results
Group comparisons
Figure 1 shows typical images of striatal FDG uptake and RACLO binding in one Huntington's disease patient (Subject 4) and two asymptomatic gene carriers (Subjects 9 and 10). Table 2 shows mean values for RACLO, FDG and BCR in the caudate nucleus and putamen in symptomatic and asymptomatic Huntington's disease carriers and controls.
Symptomatic Huntington 's disease patients
Caudate nucleus. Symptomatic Huntington's disease patients revealed severely reduced RACLO [F(l,20) = 230.9, P < 0.0001] and GMI [F(l,26) = 204.0, P < 0.0001] values and significantly increased BCR [F(l,15) = 63.8, P < 0.0001] compared with unrelated controls. Compared with asymptomatic mutation carriers, symptomatic Huntington's disease patients showed significantly lower FDG [F(l,16) = 131.0, P < 0.0001] and RACLO [F(l,16) = 28.9, P < 0.0001] values and increased BCR [F(l,14) = 22.5, P < 0.0003]. No correlation was present between the RACLO index and GMI in the symptomatic Huntington's disease (Fig. 2A). The BCR increases correlated significantly with decrements of RACLO binding (r = 0.88, P < 0.006) (Fig. 3) but not with FDG changes. No correlation was found between RACLO, GMI or BCR values and the individual's age or CAG number.
Putamen. Symptomatic Huntington's disease patients showed a reduced RACLO [F(l,20) = 156.2, P < 0.0001] and FDG [F(l,26) = 86.8, P < 0.0001] index compared with controls. Compared with asymptomatic mutation carriers, symptomatic Huntington's disease patients revealed a
Metabolism and receptor binding in Hunfington 's disease 2089
Huntingtons Disease
[18F]FDG
Clinically manifest
Asymptomatic gene carriers
[11C]Raclopride
Fig. 1 Representative PET images of FDG {top row) and RACLO {bottom row) at the mid-striatal level from: on the left, a symptomatic
Huntington's disease patient (no. 4) showing marked reduction of striatal glucose metabolism and RACLO binding; in the middle, an asymptomatic mutation-positive subject (no. 9) showing reduced striatal glucose metabolism and RACLO binding and on the right, an asymptomatic mutation-positive subject (no. 10) still showing values in the control range. The RACLO images were obtained by adding the frames corresponding to the last 30 min of data acquisition. Each FDG and RACLO images is scaled relative to common maximum and background levels.
significant reduction of FDG [F(l,16) = 33.4, P < 0.0001] and RACLO [F(1,I6) = 44.1, P < 0.0001] values. The RACLO and FDG decreases were not significantly correlated (Fig. 2B). The RACLO, GMI or BCR values did not correlate with the individual's age or CAG number.
Asymptomatic mutation carriers
Caudate nucleus. Asymptomatic mutation carriers showed significantly reduced FDG values [F(l,28) = 8.0, P < 0.009] compared with unrelated controls, but no significant change in RACLO and BCR values. The BCR increases correlated significantly with decrements of RACLO (r = 0.76, P < 0.02) (Fig. 3) and of FDG (r = 0.75, P < 0.02) (Fig. 2A). No correlation was present between RACLO and FDG values. The GMI values did not correlate with the individual's age or CAG number. The RACLO index was significantly
correlated with the CAG repeat length (r = -0.652; P < 0.04) but not with the subject's age.
Putamen. Subjects with the asymptomatic mutation showed reduced RACLO [F(\,26) = 7.1, P < 0.02] and FDG [F(l,26) = 7.5, P < 0.02) compared with controls. The RACLO and FDG decrements were significantly correlated (r = 0.69, P < 0.03) (Fig. 2B). The CAG repeat number significantly correlated with the RACLO index (r = -0.740; P < 0.02) and GMI values (r = -0.761; P < 0.009) (Fig. 4A and B). No correlation was found with the individual's age.
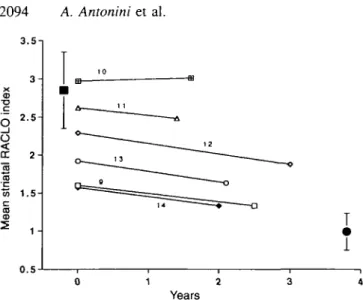
RACLO and FDG follow-up scans
Figure 5 shows representative images of FDG (left) and RACLO (right) at the mid-striatal level from one asymptomatic mutation-positive subject (no. 12) at the time of the first PET measurements and 3 years later.
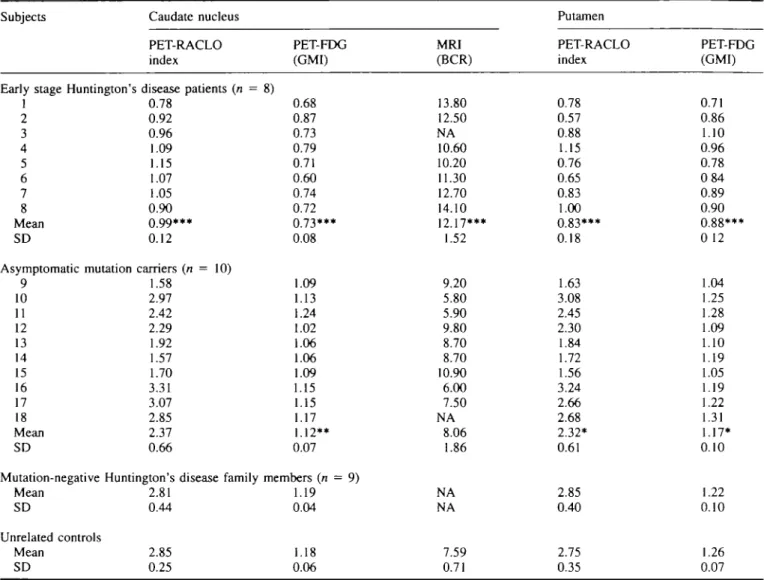
Table 2 Results from PET and MR1 scans Subjects
Early stage Huntington'. 1 2 3 4 5 6 7 8 Mean SD Asymptomatic mutation 9 10 11 12 13 14 15 16 17 18 Mean SD Caudate nucleus PET-RACLO index > disease patients (n = 0.78 0.92 0.96 1.09 1.15 1.07 1.05 0.90 0.99*** 0.12 carriers (n = 10) 1.58 2.97 2.42 2.29 1.92 1.57 1.70 3.31 3.07 2.85 2.37 0.66
Mutation-negative Huntington's disease family Mean SD Unrelated controls Mean SD 2.81 0.44 2.85 0.25 PET-FDG (GMI) 8) 0.68 0.87 0.73 0.79 0.71 0.60 0.74 0.72 0.73*** 0.08 .09 .13 .24 .02 .06 .06 .09 .15 .15 .17 .12** 0.07 members (n = 9) .19 0.04 1.18 0.06 MRI (BCR) 13.80 12.50 NA 10.60 10.20 11.30 12.70 14.10 12.17*** 1.52 9.20 5.80 5.90 9.80 8.70 8.70 10.90 6.00 7.50 NA 8.06 1.86 NA NA 7.59 0.71 Putamen PET-RACLO index 0.78 0.57 0.88 1.15 0.76 0.65 0.83 1.00 0.83*** 0.18 1.63 3.08 2.45 2.30 1.84 1.72 1.56 3.24 2.66 2.68 2.32* 0.61 2.85 0.40 2.75 0.35 PET-FDG (GMI) 0.71 0.86 1.10 0.96 0.78 084 0.89 0.90 0.88*** 0 12 1.04 1.25 1.28 1.09 1.10 1.19 1.05 1.19 1.22 1.31 1.17* 0.10 1.22 0.10 1.26 0.07 NA = not available. ••*/> < 0.0001, **P < 0.01 and *P < 0.02 (ANOVA compared with controls).
After 1.5-3 years, RACLO values were significantly reduced in the six asymptomatic mutation carriers in the caudate nucleus (P < 0.03) and putamen (P < 0.03). Changes of FDG values did not reach statistical significance (caudate, P = 0.21; putamen, P = 0.058). Interestingly, the only asymptomatic gene carrier who showed no measurable PET change was one of the three individuals classified as normal by discriminant function analysis. Since the putamen and caudate nucleus showed similar degrees of change in all subjects, values from the two regions were averaged to calculate an overall %reduction for the whole striatum. Striatal RACLO values in each subject are plotted as a function of time in Fig. 6. On the first PET scan, mean striatal values for RACLO and FDG were 2.15±0.52 and 1.13±0.09. In the follow-up PET scans values were 1.90±0.6 for RACLO and 1.08±0.12 for FDG. The overall decline was 6.3% per year for RACLO and 2.3% per year for FDG. We did not detect any difference in the rate of progression in relation to the individual's CAG repeat number or the gender of the affected parent.
Discriminant function analysis
Discriminant functional analysis was first performed on the three groups (Huntington's disease patients, asymptomatic mutation carriers and mutation-negative relatives) considering RACLO and FDG uptake in the caudate nucleus and putamen each as separate variables. The best categorization was obtained with caudate nucleus FDG uptake which showed 83% sensitivity and 78% specificity. Putamen-FDG revealed a 78% sensitivity and 66% specificity. The RACLO sensitivity was 78% for the caudate nucleus (specificity 66%) and 78% for the putamen (specificity 78%). However, when considering the four dependent variables together, discrimin-ant analysis classification was consistent with clinical and genetic status in 24 of 27 individuals with a 84% sensitivity and a specificity of 100% (Wilks' lambda = 0.065; [F(8,42) = 15.3, P < 0.0001]. The remaining three subjects were asymptomatic gene carriers who were assigned to the same category as mutation-negative controls, indicating that these individuals had normal RACLO and FDG uptake in the caudate nucleus and putamen (Fig. 7). We also performed
! 1
(A)
Metabolism and receptor binding in Huntington s disease 2091 (A) EB
A j
THE A 0 1.5- 1251 - 0.75- 0.5-0.5 (B) < 1 e » 1.5 2 RACLO Index A A 2 . 5 f\ 1 A 1 3 3 E Affl 0 0.5 1 1.6 2 2.S 3 3.5 RACLO indexFig. 2 Scatter diagram of the caudate nucleus (A) and putamen (B) FDG-GMI and RACLO indices for symptomatic (solid circles), asymptomatic mutation carriers (open triangles) and mutation-negative Huntington's disease family members (squares). The three asymptomatic carriers classified as normal by
discriminant function analysis are indicated by large open triangles. Mean values of RACLO and GMI for unrelated healthy controls are indicated by the solid square. Error bars indicate 2XSD of the control mean.
discriminant analysis on MRI BCR data. Since MRI data for the mutation-negative group were not available, we used data from symptomatic and asymptomatic carriers, and from a separate control group. Specificity for the BCR was 66% and its sensitivity 76%.
Multiple regression analysis
Stepwise multiple regression analysis was performed on data from all symptomatic and asymptomatic mutation carriers to determine the relative contribution of sex, age, parental transmission and CAG repeat number to the prediction of RACLO, FDG and BCR values. Only the combination of the CAG repeat number and the individual's age significantly predicted all variables.
Results for the caudate nucleus were for FDG, F = 16.2 (adjusted R2 = 0.640, P < 0.005); for RACLO, F = 28.2
(adjusted R2 = 0.762, P < 0.001); for BCR, F = 44.2 (adjusted
R2 = 0.852, P < 0 . 0 0 l ) . cr O 10 CD A A A
Caudate RACLO index
Fig. 3 Scatter diagram of the caudate nucleus RACLO index and MRI-BCR for symptomatic (solid circles) and asymptomatic mutation carriers (open triangles).
Results for the putamen were: for FDG, F = 8.2 (adjusted
R2 = 0.459, P < 0.005); for RACLO, F = 22.9 (adjusted R2 = 0.721, P < 0.001).
Discussion
Our study demonstrates that asymptomatic Huntington's disease mutation carriers may show normal striatal metabolism and receptor function early in life. On the other hand, symptomatic Huntington's disease patients revealed a severe hypometabolism and loss of striatal dopamine D2 receptor binding sites.
Previous PET studies have already shown reduced glucose metabolism in the caudate nucleus of Huntington's disease patients (Hayden et al., 1987; Mazziotta et al., 1987; Kuwert etai, 1990). However, the finding of glucose hypometabolism does not indicate which neuronal subpopulation is primarily affected by the genetic mutation. Neuropathological studies have revealed that striatal neurons expressing dopamine receptors are affected early in Huntington's disease (Reisine et al., 1978; Spokes, 1980; Cross and Rosser, 1983; Reiner et al., 1988). Since dopamine D2 receptors are mainly located on postsynaptic membranes, the reduction of striatal RACLO binding can be considered a direct marker of neuronal loss in Huntington's disease-mutation carriers. Because loss of binding sites was more severe in symptomatic than asymptomatic mutation carriers, we suggest that choreatic symptoms become clinically manifest only when receptor density, and thus neuronal density, is below a certain threshold.
In our study, metabolic and receptor decrements were associated with significant increases of the MRI BCR. The relationship between anatomical and functional changes in
(A) CD n c o
I
2
a. r=0 74; P<0.02 CD CD c CO (B) 42 44 CAG r=0.76; P< 0.009 CAGFig. 4 Scatter diagram of the putamen RACLO index (A) and
FDG-GMI values (B) with individual CAG repeat numbers in asymptomatic gene carriers. The RACLO and FDG values did not correlate with individual subject age, neither did the CAG number.
Huntington's disease has never been clearly addressed before. Barr et al. (1978) showed a significant enlargement of the bicaudate diameter in patients with clinically manifest Huntington's disease. Ayl ward et al. (1994) found a significant reduction of basal ganglia volume in 10 asymptomatic carriers indicating that anatomical changes may be present before chorea is clinically evident. However, Grafton et al. (1992) found no correlation between the rate of change of caudate size and glucose metabolism in nine asymptomatic at risk subjects and suggested that metabolic loss and atrophy may develop independently. In addition, Mazziotta et al. (1987) showed significant hypometabolism but no evidence of caudate atrophy at CT scanning in subjects at risk for Huntington's disease. Indeed, in our study asymptomatic Huntington's disease gene carriers showed no significant BCR changes in spite of significant caudate nucleus hypometabolism. This finding suggests that, at least in the pre-symptomatic phase of the disease, striatal atrophy is
not a major contributor to the reduced striatal function in Huntington's disease.
We also found that the CAG repeat number and the individual's age were the only two significant predictors of MRI and PET changes when considering all symptomatic and asymptomatic Huntington's disease gene carriers. In particular we found that in the asymptomatic carrier group, even in the narrow range of repeats in our patient sample (40-47), the CAG repeat length (but not age) still correlated significantly with both PET functional values. The finding of a significant association between metabolic and receptor binding decreases, and size of the Huntington's disease mutation is in keeping with previous genetic studies indicating that the CAG repeat number is the main determinant of Huntington's disease onset and progression (Ashizawa et al., 1994; Garcia-Ruiz et al., 1995). However, the mechanisms by which the expansion of the CAG repeats causes the Huntington's disease phenotype are not completely understood. The enlarged CAG repeat is translated into a protein, named huntingtin, which has been detected in neuronal cell bodies and nerve endings, has unknown function and shows no specific regional distribution (Landwehrmeyer etai, 1995; Trottier et al., 1995). The prominence of neuronal loss in the striatum indicates that striatal projection neurons may have some still unknown characteristics that makes them particularly vulnerable to the Huntington's disease mutation product.
The glucose metabolism data and receptor binding in the putamen and caudate nucleus were consistent with genetic and clinical status in 24 of 27 of subjects with a sensitivity of 83% and 100% specificity. Hayden et al. (1987) reported a significant hypometabolism in only three of eight individuals at high risk (37%). On the other hand, Grafton et al. (1990) reported a relative sensitivity of 75% for caudate nucleus metabolism data, which is similar to our results, but only 33% for the BCR. In contrast to other authors (Young et al., 1986; Grafton et al., 1990) we did not detect soft signs in our asymptomatic mutation carriers at the time of the first PET measurements. This may be due to the lower mean age of our asymptomatic carriers compared with other studies. Also differences in the size of the CAG expansion between the investigated patient populations may explain discrepancies between the above mentioned studies regarding sensitivity of PET or MRI measurements, or frequency of mild neurological abnormalities in asymptomatic carriers.
Follow-up scans showed a significant 6.3% decline per year of striatal RACLO binding and an insignificant 2.3% reduction of glucose metabolism in our asymptomatic gene carriers. Only one subject (no. 10) showed no metabolic or receptor decrement after 2 years: this subject was one of the three individuals classified as normal by discriminant function analysis. Based on published data on test-retest variability of FDG and RACLO values, the metabolic and receptor binding changes in our subjects exceeded those one would expect if they were determined only by chance (Grafton et al., 1992; Volkow et al., 1993). In addition, decrements
- Metabolism and receptor-binding in~Huntington 's disease 2093
V
1 st scan
FDG
RACLO
2nd scan
(36 months later)
Fig. 5 Representative images of FDG (left) and RACLO values (right) at the mid-striatal level from an asymptomatic mutation-positive subject (no. 12) at the time of the first PET measurements (top row) and 3 years later (bottom row). The second scan series shows reduced striatal glucose metabolism (-15%) and RACLO binding (-18%) compared with the first one.
were greater than those we would expect due to normal ageing. To our knowledge, there is no evidence of a decline in striatal glucose metabolism with ageing. Conversely, we have previously reported that striatal RACLO uptake declines 0.6% per year in normal subjects. However, this would account for only 10% of the mean year decrease we have reported in our six asymptomatic carriers. The 2.3% loss per year of striatal glucose metabolism in asymptomatic carriers is similar to the 3.1% per year reported earlier by Grafton et al. (1992). These authors estimated that, given a metabolic loss of 2-3% per year, at least 15 gene carriers should be scanned with a time interval of 42 months between the two PET studies to detect a statistically significant reduction in caudate glucose metabolism. In our study RACLO decrements were more prominent and reached statistical significance after an average time interval of 2 years in only six subjects. This suggests that dopamine D2 receptor binding may be a
more sensitive measure of outcome in terms of striatal neuronal loss than glucose metabolism. Our data also suggest that, assuming a constant decline in RACLO binding, an asymptomatic gene carrier starting from the control mean will reach a RACLO index value 2XSD below the normal mean after 4.5 years. After a further 9 years, he will reach a value 2XSD above the mean of symptomatic Huntington's disease patients, when their chorea becomes clinically manifest.
In conclusion, our results demonstrate that molecularly proven carriers of the Huntington's disease mutation can show normal neuronal function for many years, as expressed by regional glucose consumption and dopamine D2 receptor binding. Our findings also suggest that the measurement of striatal metabolism and dopamine D2 receptor binding can be used as a specific marker of disease progression in Huntington's disease.
3.5-. 3 - 2.52 - 1.5-CD 1 -0 . 5 0 1 2 3 4 Years
Fig. 6 Scatter diagram of the caudate nucleus RACLO index from
the first and second scans in six asymptomatic mutation carriers. The solid square shows the control mean; the solid circle shows the mean of the Huntington's disease patients. Error bars indicate 2XSD of the mean. Numbers identify the asymptomatic mutation carriers as listed in Table 1.
HD patients Asymptomatic mutation +
Control (mutation -) Fig. 7 Scatter diagram of the score obtained from the
discriminant function analysis of symptomatic and asymptomatic mutation carriers and mutation-negative Huntington's disease (HD) family members, based on RACLO and FDG values of caudate nucleus and putamen. The three asymptomatic carriers classified as normal by the analysis are indicated with large filled triangles.
Acknowledgements
The Swiss Huntington's Disease Foundation is gratefully acknowledged for its cooperation and support. We are also indebted to Professor K. Hess of the Department of
Neurology, University Hospital, Zurich and to Dr Braga, Bern, Switzerland for patient referral.
References
Albin RI, Reiner A, Anderson KD, Dure LS, Handelin B, Balfour R, et al. Preferential loss of striato-external palhdal projection neurons in presymptomatic Huntington's disease. Ann Neurol 1992; 31:425-30.
Antonini A, Leenders KL, Meier D, Oertel WH, Boesiger P, Anliker M. T2 relaxation time in patients with Parkinson's disease. Neurology 1993a; 43: 697-700.
Antonini A, Leenders KL, Reist H, Thomann R, Beer HF, Locher J. Effect of age on D2 dopamine receptors in normal human brain
measured by positron emission tomography and ["C]raclopride. Arch Neurol 1993b; 50: 474-80.
Antonini A, Vontobel P, Psylla M, Gunther I, Maguire PR, Missimer J, et al. Complementary positron emission tomographic studies of the striatal dopaminergic system in Parkinson's disease. Arch Neurol
1995; 52: 1183-90.
Ashizawa T, Wong L-J C, Richards CS, Caskey CT, Jankovic J. CAG repeat size and clinical presentation in Huntington's disease. Neurology 1994; 44: 1137—43.
Aylward EH, Brandt J, Codori AM, Mangus RS, Barta PE, Harris GJ. Reduced basal ganglia volume associated with the gene for Huntington's disease in asymptomatic at-risk persons. Neurology 1994; 44: 823-8.
Barr AN, Heinze WJ, Dobben GD, Valvassori GE, Sugar O. Bicaudate index in computerized tomography of Huntmgton disease and cerebral atrophy. Neurology 1978; 28: 1196-200.
Brandt J, Folstein SE, Wong DF, Links J, Dannals RF, McDonnell-Sill A, et al. D2 receptors in Huntington's disease: positron emission tomography findings and clinical correlates. J Neuropsychiatry Clin Neurosci 1990; 2: 20-7.
Cross A, RossorM. Dopamine D-l and D-2 receptors in Huntington's disease. Eur J Pharmacol 1983; 88: 223-9.
Ehrin E, Gawell L, Hogberg T, de Paulis T, Strom P. Synthesis of (methoxy-3H)- and (methoxy-"C)-labelled raclopride. Specific
dopamine-D2 receptors ligands. J Labelled Comp Radiopharm 1987;
24: 931-40.
Farde L, Hall H, Ehrin E, Sedvall G. Quantitative analysis of Do dopamine receptor binding in the living human brain by PET. Science 1986; 231: 258-61.
Garcia-Ruiz PJ, del Barrio A, Barroso T, Tortosa EG, Benitez J, Astarloa R, et al. Huntington's disease: a multidisciplinary study. Eur J Neurol 1995; 2: 185-90.
Grafton ST, Mazziotta JC, Pahl JJ, St. George-Hyslop P, Haines JL, Gusella J, et al. A comparison of neurological, metabolic, structural, and genetic evaluations in persons at risk for Huntington's disease. Ann Neurol 1990; 28: 614-21.
Grafton ST, Mazziotta JC, Pahl JJ, St. George-Hyslop P, Haines JL, Gusella J, et al. Serial changes of cerebral glucose metabolism and caudate size in persons at risk for Huntington's disease. Arch Neurol
Metabolism and receptor binding in Huntington 's disease 2095
Hagglund J, Aquilonius SM, EckemSs S, Hartvig P, Lundquist H, Gullberg P, et al. Dopamine receptor properties in Parkinson's disease and Huntington's chorea evaluated by positron emission tomography using "C-N-methyl-spiperone. Acta Neurol Scand
1987; 75: 87-94.
Harris GJ, Pearlson GD, Peyser CE, Aylward EH, Roberts J, Barta PE, et al. Putamen volume reduction on magnetic resonance imaging exceeds caudate changes in mild Huntington's disease. Ann Neurol 1992; 31: 69-75.
Hayden MR, Hewitt J. Stoessl AJ, Clark C, Ammann W, Martin WRW. The combined use of positron emission tomography and DNA polymorphisms for preclinical detection of Huntington's disease. Neurology 1987; 37: 1441-7.
Huntington's Disease Collaborative Research Group. A novel gene containing a trinucleotide repeat that is expanded and unstable on Huntington's disease chromosomes [see comments]. Cell 1993; 72: 971-83. Comment in: Cell 1993; 72: 817-8.
Ichise M, Toyama H, Fomazzari L, Ballinger JR, Kish JC. Iodine-123-IB2M dopamine D2 receptor and technetium-99m-HMPAO brain perfusion SPECT in the evaluation of patients with, and subjects at risk for, Huntington's disease. J Nucl Med 1993; 34: 1274-81.
Kuwert T, Lange HW, Langen KJ, Herzog H, Aulich A, Feinendegen LE. Cortical and subcortical glucose consumption measured by PET in patients with Huntington's disease. Brain 1990; 113: 1405-23. Landwehrmeyer GB, McNeil SM, Dure LS, Ge P, Aizawa H, Huang Q, et al. Huntington's disease gene: regional and cellular expression in brain of normal and affected individuals. Ann Neurol 1995; 37: 218-30.
Leenders KL, Frackowiak RSJ, Quinn N, Marsden CD. Brain energy metabolism and dopaminergic function in Huntington's disease measured in vivo using positron emission tomography. Mov Disord 1986; 1: 69-77.
Mazziotta JC, Phelps ME, Pahl JJ, Huang SC, Baxter LR, Riege WH, et al. Reduced cerebral glucose metabolism in asymptomatic subjects at risk for Huntington's disease. N Engl J Med 1987; 316: 357-62.
Miller SA, Dykes DD, Polesky HF. A simple salting out procedure for extracting DNA from human nucleated cells. Nucleic Acids Res 1988; 16: 1215.
Reiner A, Albin RL, Anderson KD, D'Amato CJ, Penney JB, Young AB. Differential loss of striatal projection neurons in Huntington disease. Proc Natl Acad Sci USA 1988; 85: 5733-7.
Reisine TD, Fields JZ, Bird ED, Spokes E, Yamamura HI.
Characterization of brain dopaminergic receptors in Huntington's disease. Commun Psychopharmacol 1978; 2: 79-84.
Riess O, Noerremoelle A, Soerensen SA, Epplen JT. Improved PCR conditions for the stretch of (CAG)n repeats causing Huntington's
disease [published erratum appears in Hum Mol Genet 1993; 2: 1523]. Hum Mol Genet 1993; 2: 637.
Shoulson I, Fahn S. Huntington's disease: clinical care and evaluation [editorial]. Neurology 1979; 29: 1-3.
Skraastad MI, Verwest A, Bakker E, Vegter-van der Vhs M, van Leeuwen-Cornelisse I, Roos RA, et. al. Presymptomatic, prenatal, and exclusion testing for Huntington disease using seven closely linked DNA markers. Am J Med Genet 1991; 39: 217-22. Spokes EGS. Neurochemical alterations in Huntington's chorea. A study of post-mortem brain tissue. Brain 1980; 103: 179-210. Trottier Y, Devys D, Imbert G, Saudou F, An I, Lutz Y, et al. Cellular localization of the Huntington's disease protein and discrimination ofthe normal and mutated form [see comments]. Nat Genet 1995; 10: 104-10. Comment in: Nat Genet 1995; 10: 3-4. Turjanski N, Weeks R, Dolan R, Harding AE, Brooks DJ. Striatal D, and D2 receptor binding in patients with Huntington's disease
and other choreas: a PET study. Brain 1995; 118: 689-96. Volkow ND, Fowler JS, Wang GJ, Dewey SL, Schyler D, MacGregor R, et al. Reproducibihty of repeated measures of carbon-11-raclopride binding in the human brain [published erratum appears in J Nucl Med 1993; 34: 838], J Nucl Med 1993; 34: 609-13. Vonsattel JP, Myers RH, Stevens TJ, Ferrante RJ, Bird ED, Richardson EP Jr. Neuropathological classification of Huntington's disease. J Neuropathol Exp Neurol 1985; 44: 559-77.
Weeks RA, Lawrence AD, Sahakian BJ, Harding AE, Robbins TW, Brooks, DJ. The relationship between striatal dopamine status and cognitive performance in asymptomatic mutation carriers of Huntington's disease. Neurology 1996; 46 (Supp 1): 386. World Federation of Neurology: Research Committee Research Group on Huntington's Chorea. Ethical issues policy statement on Huntington's disease molecular genetics predictive test. J Neurol Sci 1989; 94: 327-32.
Young AB, Shoulson I, Penney JB, Starosta-Rubinstein S, Gomez F, Travers H, et al. Huntington's disease in Venezuela: neurologic features and functional decline. Neurology 1986; 36: 244-9. Young AB, Penney JB, Starosta-Rubinstein S, Markel D, Berent S, Rothley J, et al. Normal caudate glucose metabolism in persons at risk for Huntington's disease. Arch Neurol 1987; 44: 254—57.
Received September 14, 1995. Revised May 2, 1996. Accepted July 19, 1996