The composition and metabolic activity of child gut microbiota
demonstrate differential adaptation to varied nutrient loads in
an
in vitro model of colonic fermentation
Amanda N. Payne, Christophe Chassard, Yannick Banz & Christophe Lacroix
Institute of Food, Nutrition and Health, ETH Zu¨rich, Zu¨rich, Switzerland
Correspondence: Christophe Lacroix, ETH Zu¨rich, Institute of Food, Nutrition and Health, Laboratory of Food Biotechnology, Schmelzbergstrasse 7, 8092 Zu¨rich, Switzerland. Tel.: +41 44 632 48 67; fax: +41 44 632 14 03; e-mail: [email protected]
Received 27 September 2011; revised 30 January 2012; accepted 6 February 2012. Final version published online 27 March 2012.
DOI: 10.1111/j.1574-6941.2012.01330.x
Editor: Julian Marchesi
Keywords
gut microbiota; in vitro gut fermentation; dietary modulation.
Abstract
The extent to which the dietary loads of simple sugars, carbohydrates, protein, and fiber impact colonic fermentation in children is unknown. This study assessed the impact of dietary energy on gut microbial communities and metabolism using a three-stage in vitro continuous fermentation model. Two separate models, replicating the proximal, transverse, and distal colon regions, were inoculated with immobilized fecal microbiota from one of two female children. Three different fermentation media were designed to examine the effects of prevalent Western dietary trends on gut microbiota. Media composi-tions reflected obese (high energy), normal weight (normal energy), and ano-rectic (low energy) child dietary intakes and were alternately supplied to each microbiota during separate fermentation periods. Gut microbiota demonstrated differential metabolic and compositional adaptation to varied substrate avail-ability. High energy medium was strongly butyrogenic, resulting in significant stimulation of butyrate-producing members of clostridia cluster XIVa, whereas members of cluster IV demonstrated greater adaptive variability. Normal and low energy nutrient loads induced significantly less metabolic activity in both microbiota, with low energy medium inducing a broad reorganization of the commensal community structure. These results suggest a concerted metabolic adaptation in response to nutrient load, exercised by different microbial popu-lations, indicating substantial redundancy in gastrointestinal metabolic path-ways.
Introduction
A dichotomy in eating behavior, exemplified on one hand by increasing obesity and conversely by calorie-restrictive diets and eating disorders, is on the rise in Western socie-ties. Seventeen per cent of U.S. children aged 2–19 are currently classified as overweight or obese representing a threefold rise since 1980 (Eberhardt et al., 2005). High fructose corn syrup, refined carbohydrates, and dietary fats, all major dietary components not predominating the preagricultural hominin age, are considered hallmarks of the ‘Western’ diet (Kopelman, 2000; Cordain et al., 2005). The significant nutrient load of these components coupled to reduced physical activity has been associated
with the development of type-2 diabetes mellitus, chronic cardiovascular disease, hyperlipidemia, and hyperinsulin-emia in children and young adults (Berenson et al., 1998). On the other hand, it is estimated that 10% of adolescents have at some point struggled with an eating disorder (Academy for Eating Disorders, http://www. aedweb.org). Extreme dietary restriction is the character-istic of anorexia nervosa and may include refusal of food intake, avoidance of certain foods, extreme exercise, and purging behaviors (Fernstrom et al., 1994; Affenito et al., 2002). Clinical studies aimed at dissecting anorectic eating behavior have observed severe caloric restriction ranging from 80% to as little as 40% of normal daily energy intakes (Fernstrom et al., 1994; Affenito et al., 2002).
MICR
Despite the abundance of data depicting the impact both obese and anorectic lifestyles impart upon host physiology, there is increasing interest in understanding the impact these highly variable nutrient loads confer upon the resident gut microbiota.
Commensal microorganisms create a beneficial symbi-otic relationship with the human host and are primarily responsible for dietary energy extraction as well as attenu-ation of infection and inflammattenu-ation (Cummings & Macfarlane, 1997; Backhed et al., 2005). 16S rRNA gene-based sequencing techniques have implied changes within the commensal community structure may potentially con-tribute to the development of multiple pathologies and metabolic diseases including inflammatory bowel disease and obesity (Elson et al., 1995; Sartor, 1997; Ley et al., 2005). Several studies have highlighted a correlation between the gut microbial community structure and obes-ity (Eckburg et al., 2005; Ley et al., 2005, 2006; Turnb-augh et al., 2006; Nadal et al., 2009), while other attempted correlations of obesity with changes in individ-ual gut microbial populations have not succeeded (Dun-can et al., 2008; Schwiertz et al., 2010). A counter hypothesis suggests that metabolic activity and not com-position of the gut microbiota might be more relevant to the development of obesity, and higher levels of short chain fatty acids (SCFA) have been reported in obese vs. normal-weight adult subjects (Schwiertz et al., 2010). Similarly, higher levels of propionate and butyrate were detected in feces of obese children, whereas normal-weight children harbored higher concentrations of intermediate metabolites, suggesting exhaustive substrate utilization by obese microbiota (Payne et al., 2011b). SCFA production resulting from microbial fermentation of hydrolyzed dietary starches, fibers, and sugars indeed provide an additional 10% daily dietary energy to the host, which may be used for de novo hepatic triglyceride and glucose synthesis (McNeil, 1984; Scheppach, 1994; Backhed et al., 2004; Flint et al., 2008). As such, a mere increase of 1% in metabolic activity could provide an additional 20 kcal day 1based on a 2000 kcal day 1diet, resulting in nearly 1 kg of weight gain annually. Compa-rably, little knowledge exists regarding gut microbial fer-mentation in starved populations with most studies directed at elderly and aging populations (Macfarlane et al., 2004; van Tongeren et al., 2005; Tiihonen et al., 2010). While higher levels of methanogens have been observed in anorexic patients, description of the commen-sal flora during anorectic feeding and nutrient deprivation remains at large (Armougom et al., 2009).
The aim of this study was to employ a three-stage in vitro continuous gut fermentation model to investigate the impact highly variable nutrient loads confer upon the composition and metabolic activity of gut microbiota in
children. A major feature of this in vitro gut fermentation model is the use of fecal microbiota immobilized within a porous, nonbiodegradable polysaccharide matrix (Cinquin et al., 2006a, b). The resulting fecal beads are used to inoculate a proximal colon-replicating bioreactor (R1) that subsequently supplies the in series-connected trans-verse (R2) and distal (R3) colon reactors during continu-ous fermentation (Cinquin et al., 2004, 2006a, b; Zihler et al., 2010). Two continuous intestinal fermentation models were separately inoculated with immobilized feces from one of two female subjects, one of which was cate-gorized as obese based on gender- and age-specific BMI percentiles from the Centers for Disease Control (http:// ww.cdc.gov). The impact of variable nutrient loading was assessed by supplying the different fermentation media during separate fermentation periods. A re-stabilization period was performed between each medium switch in each system to attenuate any experimentally induced changes to the gut microbiota prior to introducing new experimental conditions. Gut microbiota compositions and metabolic activities were measured during pseudo-steady-state conditions of each model, consistent with data reporting of in vitro gut fermentation systems (Payne et al., 2011a).
Materials and methods
Bacterial strains and culture conditions
Roseburia intestinalis (DSM 14610) and Blautia hansenii (DSM 20583) were purchased from German Collection of Microorganisms and Cell Cultures (DSMZ, Braunschweig, Germany). Escherichia coli (ATCC 25288), Bacteroides fragi-lis (ATCC 25285T), Bifidobacterium longum (ATCC 15707), and Lactobacillus rhamnosus GG (ATCC 53103) were obtained from American Type Culture Collection (ATCC, Manassas, VA). Anaerobic culture methods were used with O2-free CO2sparged Hungate tubes sealed with
butyl-rub-ber stoppers (Dutscher SAS, Brumath, France) for cultiva-tion of R. intestinalis, B. hansenii, B. fragilis, B. longum, and L. rhamnosus GG (Bryant, 1972). Strains were grown at 37° C in 10 mL yeast extract-casitone-fatty acid (YCFA) media supplemented with 2% eachD-glucose and soluble starch
(Sigma, Buchs, Switzerland) as previously described (Dun-can et al., 2002a). Escherichia coli was grown aerobically overnight at 37°C in Luria-Bertani (LB) broth.
Fecal sample collection
Single fecal samples came from two female children, ages 8 and 11. Based on gender- and age-specific BMI percen-tiles from the Centers for Disease Control (http://www. cdc.gov), the younger child was classified as obese (child
A; BMI= 21) and the older as normal weight (child B; BMI= 18). Neither child had been exposed to antibiotic treatment for the past 3 months. Children and parents gave written consent and both consumed occidental diets. Fresh fecal samples were deposited in sterile plastic con-tainers (Dutscher SA). Concon-tainers were maintained under anaerobiosis by use of anaerobic sacks (Anaerocult A min; Merck KGaA, Darmstadt, Germany). Fecal samples were delivered to the laboratory per courier within 2 h of defecation and immediately processed for immobilization.
Immobilization procedure
Fecal immobilization was performed under strict anaero-bic conditions in an anaeroanaero-bic chamber (Coy Laborato-ries, Ann Arbor, MI) containing 5% (v/v) hydrogen and balance N2.Fecal samples were maintained under
anaero-biosis and immobilized in 1–2 mm gel beads composed of gellan (2.5% w/v) and xanthan gums (0.25% w/v) and sodium citrate (0.2% w/v) as previously described (Cin-quin et al., 2004, 2006a, b).
Fermentation media preparation
HE, NE, and LE media were based on the medium of Macfarlane et al. with slight modifications: addition of granular amylopectin maize starch andD-fructose (Sigma)
(Gibson & Wang, 1994; Macfarlane et al., 1998). Dry matter compositions and rational design of each medium are given in Supporting Information, Table S1. pH was adjusted to 5.5 using 5 M HCl prior to autoclaving. Media were placed overnight in an anaerobic chamber (Coy Laboratories) prior to usage.
Batch fermentation
Batch fermentations were performed for 48 h under strict anaerobic conditions in two separate custom-stirred flat bottom glass bioreactors (Sixfors; Ismatec, Glattbrugg, Switzerland) as previously described (Cleusix et al., 2008). Briefly, each R1 (working volume 150 mL) was inoculated with 30% (v/v) freshly prepared fecal beads from one child donor resulting in two replicate fermentations, des-ignated A and B. To facilitate the best nutritional environ-ment for establishment and colonization of each individual microbiota in vitro, each replicate fermentation model was initially supplied the medium complementary to the native host environment. Fresh HE medium was supplied to R1 containing fecal beads from the obese child (A) and NE medium supplied to R1 inoculated with fecal beads from the normal-weight child (B). Temperature was set to 37°C and pH maintained at 5.5 to simulate the adolescent proximal colon (Hernandez et al., 1979).
Continuous fermentation
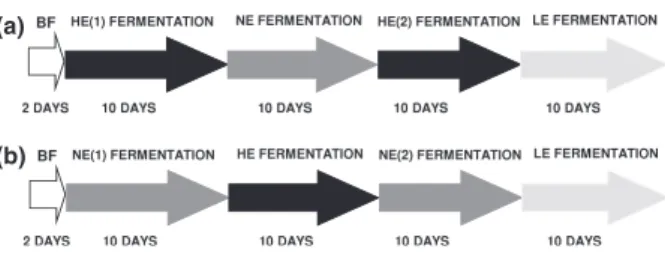
The switch from batch to continuous fermentation pro-ceeded by connecting the transverse (R2) and distal (R3) reactors, half-filled with sterile fermentation medium, in series to R1. R1 was continuously fed fermentation med-ium using a peristaltic pump at a flow rate of 37.5 mL 1 h. Fermented medium from R1 was trans-ferred to R2 and R3 (working volume 300 mL, respec-tively) using a multi-head peristaltic pump. Total retention time of each system was 20 h with individual reactor retention times of R1: 4 h, R2: 8 h, and R3: 8 h, representing an average of reported colonic retention times of the adolescent large intestine (Casasnovas et al., 1991; Sutcliffe et al., 2006). Reactor volumes were con-trolled by adjusting the heights of harvesting tubes. Tem-peratures were set at 37°C and pH maintained at 5.5 (R1) and 6.2 (R2) by the addition of 5 M NaOH. pH was monitored but control was deemed unnecessary for R3 as it normalized to distal colon physiological condi-tions of 6.8. Each 42-day fermentation was divided into four periods of 10 days each (Fig. 1a and b). Media changes occurred after pseudo-steady-state conditions were reached, indicated by < 20 mM change in total SCFA production over 3 days (Fig. S1). Effluent samples (10 mL) were collected daily for metabolite, TGGE (temperature gradient gel electrophoresis), and quantita-tive PCR (qPCR) analysis.
Metabolite analysis by high-performance liquid chromatography (HPLC)
SCFA were determined by HPLC as previously described (Cleusix et al., 2008). SCFA were analyzed in duplicate daily to check system stability (Fig. S1). Mean metabolite concen-trations were calculated from duplicate samples of the last (a)
(b)
Fig. 1. Overview of intestinal fermentation experiments during different fermentation periods. (a) Fermentation model A. (b) Fermentation model B. BF: batch fermentation; HE(1) high energy medium fermentation; NE: normal energy medium fermentation; HE (2): re-stabilization period with high energy medium; LE: low-energy medium fermentation. (b) Fermentation model B inoculated with normal-weight microbiota: BF: batch fermentation; NE(1) normal energy medium fermentation; HE: high energy medium fermentation; NE(2): re-stabilization period with normal energy medium; LE: low-energy medium fermentation.
3 days of each fermentation period, representing pseudo-steady-state conditions, except where noted (Fig. S1).
Nucleic acid extraction
Genomic DNA was isolated from cultivated strains using the Wizard®Genomic DNA Purification Kit (Promega AG, Du¨bendorf, Switzerland). The FastDNA Spin Kit for Soil (Qbiogene AG, Basel, Switzerland) was used for fecal and fermentation effluent DNA extractions. DNA was extracted from 250 mg fresh feces and 1 mL fermentation effluent and quantified using the Nanodrop® ND-1000 Spectro-photometer (Witec AG, Littau, Switzerland) at 260 nm.
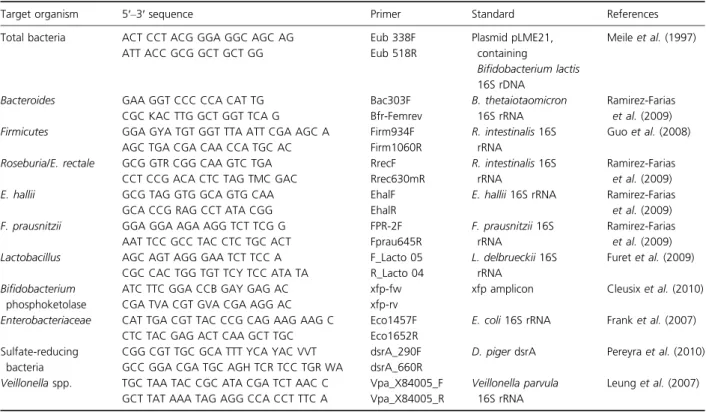
qPCR analysis
Amplification and detection of DNA by qPCR were per-formed with a 7500 Fast Real-Time PCR System (Applied Biosystems Europe BV, Zug, Switzerland) using optical-grade 96-well plates. Duplicate sample analysis was rou-tinely performed in a total volume of 25lL using SYBR® Green PCR Master Mix (Applied Biosystems) containing standardized 100 nglL 1 template DNA diluted either 1 : 10 or 1 : 100 depending upon target species and 200 nM of both forward and reverse primers (Table 1). Total bacteria were quantified using plasmid pLME21 containing a 16S rRNA gene fragment of Bifidobacterium lactis aligning to position numbers 15–1432 of the E. coli
16S rRNA gene (Brosius et al., 1978; Meile et al., 1997). Standard curves were routinely performed for each qPCR run using serial dilutions of control standard amplicons generated using the primer sets and target species listed in Table 1. PCR conditions consisted of initial activation at 95°C for 10 min, 40 cycles of denaturation at 95 °C for 15 s, annealing at 60°C for 30 s, and elongation at 60°C for 30 s. Data from duplicate samples were ana-lyzed using the SEQUENCE DETECTION Software Version 1.4
(Applied Biosystems). Mean copy numbers of populations were calculated from the last 3 days of each fermentation period, representing pseudo-steady-state conditions, except where noted (Fig. S1).
PCR amplification of 16S rRNA gene
DNA (100 ng lL 1) was used to PCR amplify the vari-able V2-V3 16S rRNA gene sequence using 200 nM uni-versal primers HDA-1GC (CGC CCG GGG CGC GCC CCG GGC GGG GCG GGG GCA CGG GGGG AC TCC TAC GGG AGG CAG CAG T) and HDA-2 (GTA TTA CCG CGG CTG CTG GCA C) and a modified protocol of Ogier et al. (Ogier et al., 2002). PCR reactions con-sisted of 29 Fermentas PCR Mastermix (19 PCR Buffer, 2 mM MgCl2, 0.2 mM each dNTP and 1 U Taq
polymer-ase) diluted 1 : 1 with sterile ultra-pure water (Milipore AG). Samples were amplified on a Biometra Personal CyclerTM (Biometra, Chaˆtel-St-Denis, Switzerland): 94°
Table 1. Group and species-specific 16S rRNA gene-targeted primers used in this study
Target organism 5′–3′ sequence Primer Standard References
Total bacteria ACT CCT ACG GGA GGC AGC AG Eub 338F Plasmid pLME21,
containing
Bifidobacterium lactis 16S rDNA
Meile et al. (1997)
ATT ACC GCG GCT GCT GG Eub 518R
Bacteroides GAA GGT CCC CCA CAT TG Bac303F B. thetaiotaomicron
16S rRNA
Ramirez-Farias et al. (2009)
CGC KAC TTG GCT GGT TCA G Bfr-Femrev
Firmicutes GGA GYA TGT GGT TTA ATT CGA AGC A Firm934F R. intestinalis 16S rRNA
Guo et al. (2008)
AGC TGA CGA CAA CCA TGC AC Firm1060R
Roseburia/E. rectale GCG GTR CGG CAA GTC TGA RrecF R. intestinalis 16S rRNA
Ramirez-Farias et al. (2009)
CCT CCG ACA CTC TAG TMC GAC Rrec630mR
E. hallii GCG TAG GTG GCA GTG CAA EhalF E. hallii 16S rRNA Ramirez-Farias
et al. (2009)
GCA CCG RAG CCT ATA CGG EhalR
F. prausnitzii GGA GGA AGA AGG TCT TCG G FPR-2F F. prausnitzii 16S
rRNA
Ramirez-Farias et al. (2009) AAT TCC GCC TAC CTC TGC ACT Fprau645R
Lactobacillus AGC AGT AGG GAA TCT TCC A F_Lacto 05 L. delbrueckii 16S rRNA
Furet et al. (2009) CGC CAC TGG TGT TCY TCC ATA TA R_Lacto 04
Bifidobacterium phosphoketolase
ATC TTC GGA CCB GAY GAG AC xfp-fw xfp amplicon Cleusix et al. (2010)
CGA TVA CGT GVA CGA AGG AC xfp-rv
Enterobacteriaceae CAT TGA CGT TAC CCG CAG AAG AAG C Eco1457F E. coli 16S rRNA Frank et al. (2007) CTC TAC GAG ACT CAA GCT TGC Eco1652R
Sulfate-reducing bacteria
CGG CGT TGC GCA TTT YCA YAC VVT dsrA_290F D. piger dsrA Pereyra et al. (2010) GCC GGA CGA TGC AGH TCR TCC TGR WA dsrA_660R
Veillonella spp. TGC TAA TAC CGC ATA CGA TCT AAC C Vpa_X84005_F Veillonella parvula 16S rRNA
Leung et al. (2007) GCT TAT AAA TAG AGG CCA CCT TTC A Vpa_X84005_R
C for 5 min, 35 cycles of 94°C for 3 min, 58 °C for 30 s, 68°C for 1 min and finally 68 °C for 7 min.
TGGE analysis of PCR amplicons
TGGE gels (16 cm9 16 cm 9 1 mm) were composed of 6% acrylamide/bis-acrylamide 37.5 : 1 (Sigma), 7 M urea (Sigma), and 1.59 Tris Acetate EDTA (TAE) buffer (Muyzer et al., 1993). TGGE was performed with 50 ng PCR amplicons using a Dcode universal mutation system (Bio-Rad, Reinach, Switzerland). A custom marker was created by mixing equal concentrations of PCR amplicons of B. fragilis, E. coli, R. intestinalis, B. hansenii, B. longum, and L. rhamnosus GG. Electrophoresis conditions included a prerun of 20 min at 20 V followed by 16 h at 70 V in 1.59 TAE buffer. Temperature was increased from 66 to 70 °C using a ramp rate of 0.4. Gels were stained for 30 min in ethidium bromide and destained for 1 h in dH2O prior to imaging.
TGGE band cloning and sequencing
TGGE bands were excised and stored overnight at 4°C in 10 mM Tris-EDTA (TE) buffer. DNA was precipitated overnight at 20°C by the addition of 0.1 volume 3 M sodium acetate (pH 5.5) and 3 volumes 100% ethanol. PCR amplification conditions of precipitated DNA were identical to those described above except the forward pri-mer HDA-1 lacked the GC-clamp. Amplicons were ligated into the pGEM-T Easy Vector (Promega). One microlitre of ligation product was mixed with 40 lL XL-1 blue electrocompetent cells (Stratagene, Amsterdam, the Netherlands) on ice. Electroporation was performed at 2500 V. Cells were immediately transferred to 960lL 37°C SOC media and incubated at 37 °C for 1 h. 100 lL of serial dilutions were plated on LB agar plates (1.5% w/v) containing 5-bromo-4-chloro-3-inodlyl-b-D
-galactopyranoside [X-gal; final concentration of 80lg mL 1, prepared in dimethylformamide (DMF)] and isopropyl-1-thio-b-D-galactopyranoside (IPTG, final
concentration of 20 mM, prepared in sterile dH2O).
Plates were incubated aerobically overnight at 37°C. Multiple clones per TGGE band were grown overnight in 3 mL LB broth supplemented with 6% ampicillin. Plasmids were isolated using the GeneJETTM Plasmid Miniprep Kit (Fermentas, Le Mont-sur-Lausanne, Swit-zerland). Insert size and presence were verified by PCR. Plasmid inserts were sequenced (Microsynth AG, Balgach Switzerland) using the T7 sequencing primer. Sequences were compared to GenBank (http://www.ncbi.nlm.nih. gov/genbank/) and the Ribosomal Database Project (http://rdp.cme.msu.edu/index.jsp) using BLAST (Altschul
et al., 1997). Sequences with percentage identity of
97% or higher were considered to represent the same species.
Statistical analysis
Results are presented as means± SE. Mean copy numbers were transformed to their base 10 logarithmic values for variance homogeneity. One-way ANOVA was performed to
test the effects of varying nutrient loads on bacterial pop-ulations and SCFA production using JMP 8.0 (SAS
Insti-tute Inc., Cary, NC). When significant differences were found below P< 0.05, treatment means were compared using the Tukey–Kramer HSD test. Principal component analysis of mean-centered copy number data and metabo-lite concentrations were performed with the prcomp func-tion of the stats package of the R statistical language,
version 2.13.1 (http://www.r-project.org/).
Results
Microbial diversity of fecal microbiota
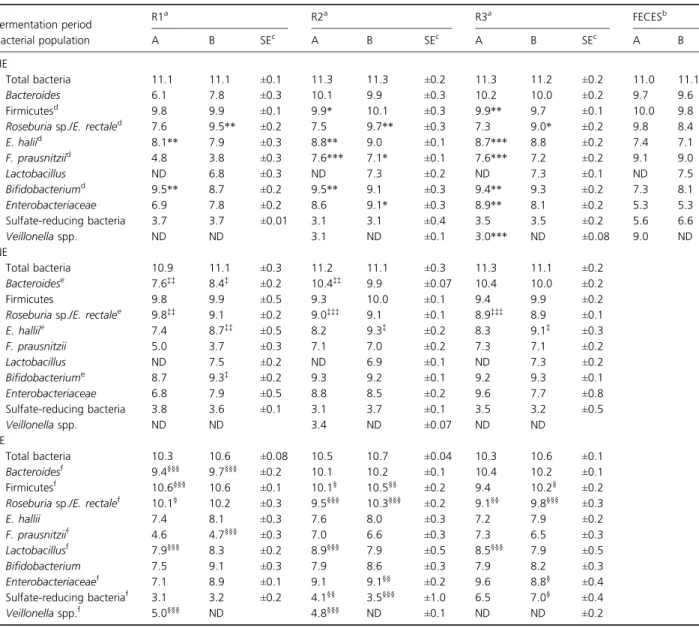
qPCR results of ten microbial populations plus total bac-teria present in feces of both child donors are given in Table 2. With the exception of lactobacilli in child A (obese) and Veillonella in child B (normal weight), both of which were not detected presumably due to population numbers below the 3 log10 copies g 1 detection limit of
the qPCR assay, qualitative diversity of both microbiota was highly similar. Quantitative differences between the two microbiota were observed for only a few evaluated populations. Higher populations of Firmicutes, Eubacterium hallii, and Roseburia/Eubacterium rectale were observed in feces from child A and higher sulfate-reducing bacteria (SRB), Bifidobacteria in child B (Table 2).
Effect of high energy nutrient loading on the microbial community structure
The impact of HE medium fermentation was examined for the adaptation of the microbial community structure to high energy availability. Samples from the last 3 days of each fermentation period were routinely chosen for all community analyses as pseudo-steady-state fermentation conditions had been established (Fig. S1). Results were compared to those obtained during NE medium fermen-tation. The qualitative community structure remained similar to feces with neither lactobacilli nor Veillonella detected in models A and B, respectively, likely a function of population numbers below the assay detection limit of 3 log10 copies g 1 (Table 2). Bacteroides were
reproduc-ibly and significantly lower in proximal colon reactors (6.1 and 7.8 log10 copies 16S rRNA gene g 1
fermenta-tion effluent, model A and B, respectively) and is a direct result of the low pH (5.5) maintained in R1 for proximal colon simulation. Bacteroides numbers rebounded in both R2 and R3 where circumneutral pH conditions (e.g. pH 6 –7.5) favorable for Bacteroides growth prevailed; however, high nutrient loading produced no significant effect on this population (Table 2; HE). A significant increase in
Bifidobacteria (P< 0.005) was observed in all three reac-tors of model A. Firmicutes demonstrated a similar response to HE medium fermentation. In particular, Firmicutes in R2 and R3 of model A demonstrated a pref-erence for high energy conditions (Table 2; HE). Contrib-uting to the increase in Firmicutes during HE medium fermentation was Roseburia/E. rectale and E. hallii, both
Table 2. Bacterial populations measured by qPCR in effluent samples in each reactor of replicate in vitro fermentation models during HE, NE, and LE media fermentation
Fermentation period R1 a R2a R3a FECESb Bacterial population A B SEc A B SEc A B SEc A B HE Total bacteria 11.1 11.1 ±0.1 11.3 11.3 ±0.2 11.3 11.2 ±0.2 11.0 11.1 Bacteroides 6.1 7.8 ±0.3 10.1 9.9 ±0.3 10.2 10.0 ±0.2 9.7 9.6 Firmicutesd 9.8 9.9 ±0.1 9.9* 10.1 ±0.3 9.9** 9.7 ±0.1 10.0 9.8
Roseburia sp./E. rectaled 7.6 9.5** ±0.2 7.5 9.7** ±0.3 7.3 9.0* ±0.2 9.8 8.4
E. haliid 8.1** 7.9 ±0.3 8.8** 9.0 ±0.1 8.7*** 8.8 ±0.2 7.4 7.1 F. prausnitziid 4.8 3.8 ±0.3 7.6*** 7.1* ±0.1 7.6*** 7.2 ±0.2 9.1 9.0 Lactobacillus ND 6.8 ±0.3 ND 7.3 ±0.2 ND 7.3 ±0.1 ND 7.5 Bifidobacteriumd 9.5** 8.7 ±0.2 9.5** 9.1 ±0.3 9.4** 9.3 ±0.2 7.3 8.1 Enterobacteriaceae 6.9 7.8 ±0.2 8.6 9.1* ±0.3 8.9** 8.1 ±0.2 5.3 5.3 Sulfate-reducing bacteria 3.7 3.7 ±0.01 3.1 3.1 ±0.4 3.5 3.5 ±0.2 5.6 6.6 Veillonella spp. ND ND 3.1 ND ±0.1 3.0*** ND ±0.08 9.0 ND NE Total bacteria 10.9 11.1 ±0.3 11.2 11.1 ±0.3 11.3 11.1 ±0.2 Bacteroidese 7.6‡‡ 8.4‡ ±0.2 10.4‡‡ 9.9 ±0.07 10.4 10.0 ±0.2 Firmicutes 9.8 9.9 ±0.5 9.3 10.0 ±0.1 9.4 9.9 ±0.2
Roseburia sp./E. rectalee 9.8‡‡ 9.1 ±0.2 9.0‡‡‡ 9.1 ±0.1 8.9‡‡‡ 8.9 ±0.1
E. halliie 7.4 8.7‡‡ ±0.5 8.2 9.3‡ ±0.2 8.3 9.1‡ ±0.3 F. prausnitzii 5.0 3.7 ±0.3 7.1 7.0 ±0.2 7.3 7.1 ±0.2 Lactobacillus ND 7.5 ±0.2 ND 6.9 ±0.1 ND 7.3 ±0.2 Bifidobacteriume 8.7 9.3‡ ±0.2 9.3 9.2 ±0.1 9.2 9.3 ±0.1 Enterobacteriaceae 6.8 7.9 ±0.5 8.8 8.5 ±0.2 9.6 7.7 ±0.8 Sulfate-reducing bacteria 3.8 3.6 ±0.1 3.1 3.7 ±0.1 3.5 3.2 ±0.5 Veillonella spp. ND ND 3.4 ND ±0.07 ND ND LE Total bacteria 10.3 10.6 ±0.08 10.5 10.7 ±0.04 10.3 10.6 ±0.1 Bacteroidesf 9.4§§§ 9.7§§§ ±0.2 10.1 10.2 ±0.1 10.4 10.2 ±0.1 Firmicutesf 10.6§§§ 10.6 ±0.1 10.1§ 10.5§§ ±0.2 9.4 10.2§ ±0.2
Roseburia sp./E. rectalef 10.1§ 10.2 ±0.3 9.5§§§ 10.3§§§ ±0.2 9.1§§ 9.8§§§ ±0.3
E. hallii 7.4 8.1 ±0.3 7.6 8.0 ±0.3 7.2 7.9 ±0.2 F. prausnitziif 4.6 4.7§§§ ±0.3 7.0 6.6 ±0.3 7.3 6.5 ±0.3 Lactobacillusf 7.9§§§ 8.3 ±0.2 8.9§§§ 7.9 ±0.5 8.5§§§ 7.9 ±0.5 Bifidobacterium 7.5 9.1 ±0.3 7.9 8.6 ±0.3 7.9 8.2 ±0.3 Enterobacteriaceaef 7.1 8.9 ±0.1 9.1 9.1§§ ±0.2 9.6 8.8§ ±0.4 Sulfate-reducing bacteriaf 3.1 3.2 ±0.2 4.1§§ 3.5§§§ ±1.0 6.5 7.0§ ±0.4 Veillonella spp.f 5.0§§§ ND 4.8§§§ ND ±0.1 ND ND ±0.2
R1, proximal colon reactor; R2, transverse colon reactor; R3, distal colon reactor.
aData are mean log
10copies 16S rRNA gene g 1fermentation effluent; ND: not detected. bData are mean log
10copies 16S rRNA gene g 1feces; ND: not detected. c
SE: standard errors of the mean of replicates A and B.
dBacterial populations that were significantly higher during HE vs. NE medium fermentation are denoted by significance level: *P < 0.05,
**P < 0.005, ***P < 0.0001.
e
Bacterial populations that were significantly higher during NE vs. HE medium fermentation are denoted by significance level: ‡P< 0.05,
‡‡P< 0.001,‡‡‡P< 0.0001.
butyrate-producing members of clostridia cluster XIVa. Significant stimulation within this clostridia cluster was observed with individual subpopulation differences between replicate models. Roseburia/E. rectale were signif-icantly higher (P-values ranging from < 0.05 to < 0.005) in model B and E. hallii (P-values ranging from < 0.005 to < 0.0001) in model A (Table 2; HE). Conversely, F. prausnitzii, a butyrate-producing member of clostridia cluster IV, demonstrated a pH-specific response to high energy conditions. F. prausnitzii were significantly ele-vated in R2 and R3 (P< 0.05 model B and P < 0.0001 model A, respectively) however remained significantly low in R1. This observation is analogous to the low Bactero-ides populations observed in R1 and is also presumably a function of the low pH maintenance in this reactor.
Effect of normal energy nutrient loading on the microbial community structure
NE medium supplementation produced a favorable response by Bacteroides, resulting in significantly higher populations in R1 (P < 0.05 to P < 0.001) and also in R2 in comparison with high energy conditions (Table 2; NE). Clostridia cluster XIVa again demonstrated individual sub-population differences between replicate models. A signifi-cant increase in Roseburia/E. rectale during normal nutrient availability was observed in all three reactors of model A (9.8, 9.0, and 8.9 log10copies 16S rRNA gene g 1
fermentation effluent, respectively), with this increase cor-responding to nearly 2 log10 in comparison with the HE
medium populations (7.6, 7.5, and 7.3 log10 copies 16S
rRNA gene g 1fermentation effluent, respectively). Eubac-terium hallii were more abundant during normal energy conditions in all three reactors of model B (8.7, 9.3, and 9.1 log10copies 16S rRNA gene g 1fermentation effluent,
respectively) vs. the HE medium population (7.9, 9.0, and 8.8 log10copies 16S rRNA gene g 1fermentation effluent,
respectively). Neither lactobacilli nor Veillonella were detected during NE medium fermentation in models A and B, respectively. Veillonella populations in model A demonstrated a mixed and pH-dependent response to both high and normal energy conditions, particularly in R3 (Table 2; HE and NE). Furthermore, Veillonella remained relatively stable in R2 but were not detected in R1 during either nutrient load, analogous to the absence of low pH-intolerant Bacteroides and F. prausnitzii in this proximal colon reactor.
High energy nutrient loading confers a butyrogenic effect on metabolic activity
The effect of high energy nutrient loading was investi-gated for alterations to the commensal metabolic activity.
SCFA concentrations in fermentation effluent samples from all three reactors were analyzed during pseudo-steady-state conditions (Table 3). SCFA concentrations gradually increased from R1 to R3 because of the accu-mulation of product in the system, consistent with opera-tion of this in vitro model design (Cinquin et al., 2004, 2006a, b). Propionate production was mostly unaffected by nutrient load with both HE and NE media resulting in similar propionate levels (Table 3). HE medium fermen-tation resulted in significantly higher acetate production in model A. Butyrate production was most significantly stimulated (P-value range of < 0.05 to < 0.005) across all three reactors during high energy conditions (Table 3). Interestingly, increased butyrate production in model B during HE medium fermentation occurred in the pres-ence of similar acetate production during both NE and HE medium fermentation suggesting preferential conver-sion of acetate to butyrate during high energy availability. Overall, metabolic activities during HE medium fermen-tation were increased by approximately 30% in compari-son with normal energy conditions, which is in agreement with the 25% increase of fermentable carbohy-drate added to the NE medium in creating the HE med-ium (Table S1).
Low substrate availability produces a distinct response in both microbial community adaptation and metabolic activity
The response of individual gut microbial populations dur-ing nutrient deprivation was investigated usdur-ing a low energy medium consisting of approximately 40% less avail-able fermentavail-able substrate vs. NE medium (Tavail-able S1). Quantitative results demonstrated a surprising number of populations thriving during low energy conditions (Table 2; LE). Significant increases in Firmicutes, Roseburi-a/E. rectale, and SRB were all observed, although the level of significance was highly varied and dependent upon reac-tor conditions (Table 2; LE). Interestingly, R1 demon-strated increased populations in Bacteroides, F. prausnitzii, and Veillonella, all pH-sensitive populations previously demonstrating repressed number under both normal and high nutrient conditions (Table 2; LE). Roseburia/E. rectale increased on average half a log10in comparison with
nor-mal energy conditions. SRB represented the most respon-sive population to reduced energy availability with > 2 log10 increases in R2 and R3 (Table 2; LE). A similar
trend was observed for Veillonella in model A with signifi-cant increases (P-values ranging from< 0.005 to < 0.001) in all three reactors. A surprising and unexpected lactoba-cilli bloom was observed in model A were population num-bers went from below detection in feces, HE, and NE nutrient loads to approximately 8 log10 copies 16S rRNA
gene g 1fermentation effluent, reaching numbers consis-tently observed in model B (Table 2).
Metabolic activity of commensal microbiota demon-strated a concerted adaptation in response to reduced nutrient availability. Total SCFA, acetate, butyrate, and propionate were all negatively affected with significant (P-values of< 0.0001) production decreases ranging from 35% to 50% in comparison with both high and normal nutrient loads, in agreement with the 40% reduction in nutrient availability (Table 3).
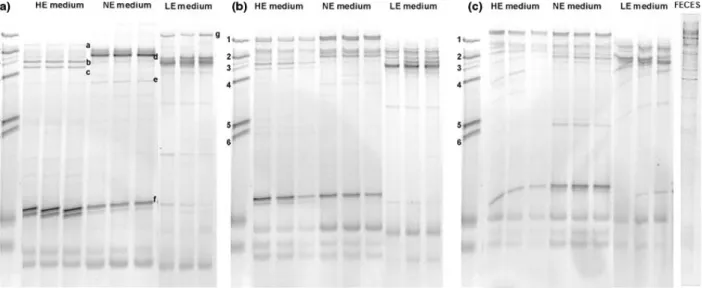
Qualitative assessment of biodiversity by TGGE
TGGE profiles of pseudo-steady-state HE, NE, and LE fermentation periods in each reactor of models A and B are illustrated in Figs 2a–c and 3a–c, respectively. TGGE was selected to qualitatively demonstrate changes to the biodiversity as a function of varied substrate availability. Bands displaying significant changes in relative intensity were chosen for cloning and sequence analysis to identify species impacted by each fermentation medium as a com-plement to quantitative qPCR assessment. Changes in nutrient loading resulted in highly visible shifts within the biodiversity in all three reactors of both replicate models, with the most evident changes in R1 (Figs 2a and 3a). Sequence analysis of clones from the HE vs. NE fermentation period in both R1 identified members of the Firmicutes as predominately impacted, qualitatively con-firming results obtained with qPCR. Enterococcaceae and Clostridiaceae (Table 4; model A clones a–c) and Eubacte-rium eligens ATCC 27750 and E. rectale ATCC 33656 (Table 4; model B clones c–d) were stimulated during high- vs. normal energy nutrient loading. Analysis of clones obtained during NE medium fermentation con-firmed quantification of higher populations of E. hallii and Bifidobacterium in model B (Table 4; model B clones a, and b, respectively) and supported the qPCR data for Roseburia sp./E. rectale in model A (Fig. 2a–c and Table 4; model A clones d–e). Furthermore, the decrease in Bifidobacterium in R1 of model A during NE medium fermentation was substantiated by cloning and sequencing a band with decreased relative intensity corresponding to Bifidobacterium adolescentis L2-32 in model A (Fig. 2a and Table 4; model A clone f). TGGE profiling of the LE medium vs. NE medium also supports the qPCR quanti-fied increase of Bacteroides, with the appearance of a band corresponding to species with high homology to Bactero-ides ovatus ATCC 8483 in R1 of model A (Fig. 2a; clone g). It should be noted that all sequence data reported are partial and the 200 bp sequence should be treated with some caution and used primarily as a guide. However, the region of sequence used for analysis includes the vari-able V3 region of the bacterial 16S rRNA gene, previously
Table 3. SCFA concentrations and ratios in effluent samples of each reactor of replicate in vitro fermentation models during HE, NE, and LE medium fermentation Fermentation period R1 % SCFA R2 % SCFA R3 % SCFA FECES % SCFA Metabolite a AB A B S E b AB A B S E b AB A B S E b AB A B HE Total SCFA 124.8 * 128.7 100 100 ± 3.3 167.9 ** 173.6 100 100 ± 5.9 191.8 ** 177.9 100 100 ± 4.1 77.2 108.4 100 100 Acetate 70.7 * 52.9 56.6 41.1 ± 1.4 96.8 ** 94.1 57.6 54.2 ± 2.1 114.5 ** 99.4 59.7 55.9 ± 1.6 41.8 56.4 54.1 52.0 Butyrate 51.5 * 73.1 ** 41.3 56.8 ± 1.5 60.5 ** 64.3 ** 36.0 37.0 ± 3.2 62.8 ** 62.2 * 32.7 34.9 ± 2.1 25.5 28.1 33.0 25.9 Propionate 2.6 2.7 2.1 2.1 ± 0.4 10.7 15.3 6.4 8.8 ± 0.6 14.4 16.2 7.6 9.2 ± 0.5 9.9 23.9 12.9 22.1 NE Total SCFA 102.1 116.6 100 100 ± 6.5 147.1 154.5 100 100 ± 2.3 165.8 149.1 100 100 ± 1.2 Acetate 56.1 72.2 54.8 70.0 ± 4.1 76.8 97.1 52.2 62.8 ± 1.0 93.9 91.4 56.6 61.3 ± 7.6 Butyrate 43.1 41.6 42.2 35.6 ± 0.6 53.8 40.6 36.6 26.3 ± 0.9 53.9 44.1 32.5 29.6 ± 1.6 Propionate 3.1 2.8 3.0 2.4 ± 1.8 16.5 16.8 11.2 10.9 ± 0.4 17.9 13.7 10.9 9.1 ± 2.4 LE Total SCFA 48.0 ††† 48.6 †††† 100 100 ± 2.5 64.0 ††† 69.4 ††† † 100 100 ± 3.2 74.1 ††† 78.8 †† 100 100 ± 2.7 Actetate 27.4 ††† 19.8 † 57.1 40.7 ± 1.7 36.8 †† 39.2 ††† 57.5 56.5 ± 2.4 46.1 ††† 46.7 †† 62.2 59.2 ± 1.9 Butyrate 18.8 † 24.9 39.1 51.2 ± 0.6 21.6 ††† 22.8 ††† † 33.8 32.9 ± 0.7 21.5 ††† 23.5 ††† 29.0 29.8 ± 0.7 Propionate 1.8 3.9 †††† 3.8 8.1 ± 0.2 5.6 †† 7.4 ††† † 8.7 10.6 ± 0.1 6.5 ††† 8.6 †† 8.8 11.0 ± 0.2 R1, proximal colon reactor; R2, transverse colon reactor; R3, distal colon reactor. SCFA concentrations significantly higher during HE vs. NE medium fermentation are denoted by significance level: *P < 0.05 and ** P < 0.005. SCFA concentrations significantly reduced during LE vs. NE medium fermentation are denoted by significance level: †P < 0.05, ††P < 0.005, ††† P < 0.001, and †††† P < 0.0001. aData are expressed as mM and are mean values calculated for the last 3 days of each fermentation period. bSE: standard errors of the mean of replicates A and B.
demonstrated to be an excellent indicator of phylogeny (McCaig et al., 2001; Jensen et al., 2004).
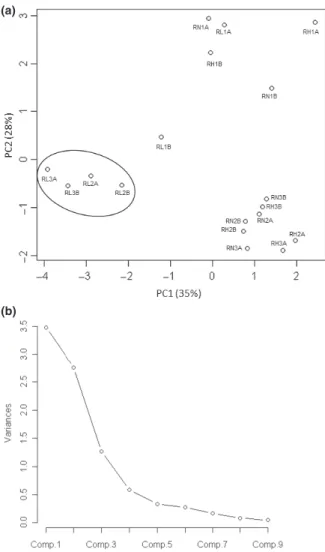
Multivariate analysis of nutrient loading on community structure and metabolic activity
Principal component analysis (PCA) was applied to mean-centered copy number data and metabolite concen-trations to reveal intrinsic treatment patterns within data. Lactobacilli and Veillonella were excluded from analysis as
their populations were not detected in feces of both child A and B, respectively. PCA demonstrated a replicative robustness of each model, highlighted by the clustering of the separately simulated transverse and distal colon region (Figs 4a and 5a). R1 consistently failed to demonstrate any specific clustering ability, a likely influence of the low population numbers observed for Bacteroides and F. pra-usnitzii as function of low pH maintenance in this reac-tor. Nutrient loading resulted in a differential impact on community structure and metabolic activity. A concerted
Fig. 2. TGGE profiles of fermentation model A during each nutrient load. (a) R1; (b) R2; (c) R3. HE medium: high energy fermentation; NE medium: normal energy fermentation; LE medium: low energy fermentation. FECES: fecal TGGE profiles. Marker strains denoted by numbers on right: 1: Bacteroides fragilis; 2: Roseburia intestinalis; 3: Blautia hansenii; 4: Escherichia coli; 5: Bifidobacterium longum; 6: Lactobacillus rhamnosus GG. Bands excised for cloning denoted by lower case letters.
Fig. 3. TGGE profiles of fermentation model B during each nutrient load. (a) R1; (b) R2; (c) R3. NE medium: normal energy fermentation; HE medium: high energy fermentation; LE medium: low energy fermentation. FECES: fecal TGGE profiles. Marker strains denoted by numbers on right: 1: Bacteroides fragilis; 2: Roseburia intestinalis; 3: Blautia hansenii; 4: Escherichia coli; 5: Bifidobacterium longum; 6: Lactobacillus rhamnosus GG. Bands excised for cloning denoted by lower case letters.
and distinct community clustering pattern was observed for LE medium fermentation only (Fig. 5a). Conversely, R2 and R3 of both NE and HE medium fermentation aggregated together, suggesting that both normal and overabundant substrate loads impose a similar impact upon circumneutral microbial community structures. Random aggregation of R1, regardless of nutrient load, was observed (Fig. 4). PCA of SCFA production during variable substrate availability demonstrated a significant nutrient load-specific effect (Fig. 5a). With the exception of R1 supplied HE medium, several distinctive clustering patterns were identified. Clusters aggregated as a function of the metabolic response to HE, NE, and LE nutrient supply and simulated colon region (Fig. 5a).
Discussion
This study represents the first description of the impact highly variable nutrient loads confer upon the commensal microbiota in children using a three-stage in vitro model of colonic fermentation. A major challenge of this study was designing fermentation media to accurately simulate the various dietary conditions and respective nutrient loads. The composition of each medium was designed after thorough investigation of published dietary records of obese, normal-weight, and anorexic children. While high levels of fat intake are generally associated with the ‘Western’ diet and obesity, in vitro fermentation models are ill-equipped for testing diets with fat content, as aggregation of fat globules results in consistent blockage of the fermentation pumps. However, dietary investiga-tion revealed major differences in protein, fiber, and sugar consumption between obese and normal-weight children, justifying the decision to focus on these nutri-tional compounds (Fernstrom et al., 1994; Ludwig et al., 1999; Nicklas et al., 2001; Affenito et al., 2002; Aeberli et al., 2007a, b; Wright et al., 2007). Significantly, more protein (P< 0.05), lower fiber (P < 0.05), and twice the
amount of fructose were identified as major constituents of obese vs. normal-weight child dietary loads (Beyer et al., 2005; Aeberli et al., 2007a, b). Anorectic diets, characterized by severe caloric restriction (40–80% of total daily energy intake), demonstrated increased carbo-hydrate/protein ratios (Fernstrom et al., 1994; Affenito et al., 2002). Based on this information, we decided to utilize a previously published and validated fermentation medium, supplemented with D-fructose and amylopectin
maize starch, as NE medium from which the HE and LE media were subsequently based (Macfarlane et al., 1998). Media compositions and justifications are accurately described in Table S1.
Feces used in this study came from two female chil-dren, highly similar in composition with the exception of lactobacilli and Veillonella (Table 2). As one of the two subjects was deemed to be obese, each replicate in vitro fermentation model was initially supplied the fermenta-tion medium containing the nutrient load most similar to the corresponding host gastrointestinal environment. The rationale behind this experimental design was to provide the microbiota the best opportunity to effectively quanti-tatively and qualiquanti-tatively establish their populations in vitro. Comparison of initial fermentation periods (Fig. 1a and b, HE(1), and NE(1), respectively) with fecal microbiota demonstrates the effectiveness of this approach, as population numbers were highly comparable (Table 2). A re-stabilization period was performed between switching experimental nutrient loads to attenu-ate any experimentally induced changes to the microbiota composition (Table S2) and metabolic activity (Table S3). High energy nutrient loading was highly butyrogenic with butyrate production significantly higher (P-values ranging from< 0.05 to < 0.005) in comparison with nor-mal and low energy conditions (Table 3). Roseburia/E. rectale and E. hallii, both subpopulations of clostridia cluster XIVa, responded favorably to increased nutrient availability. Surprisingly, different relative contributions
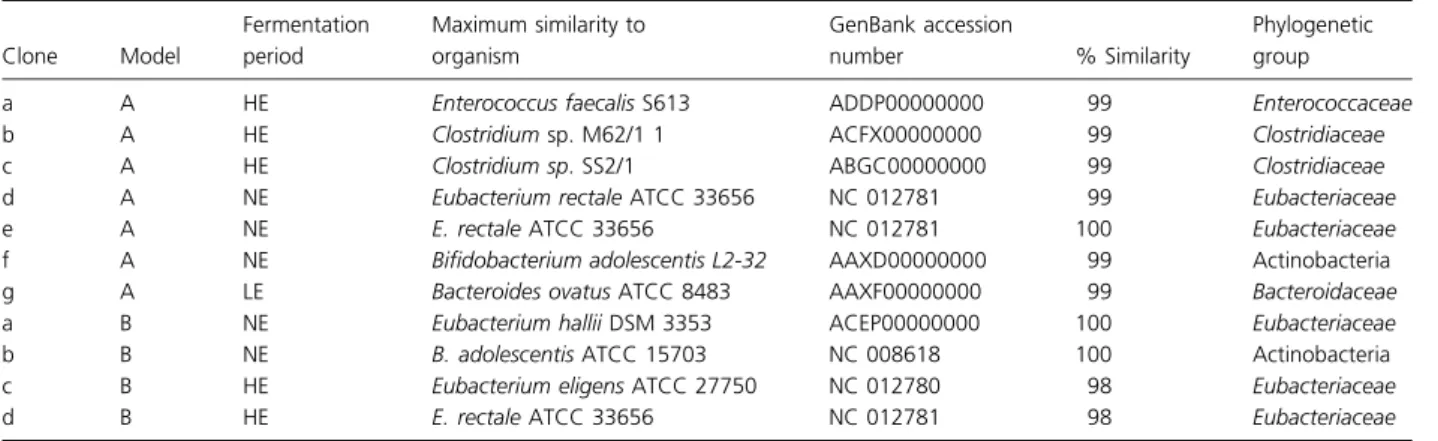
Table 4. Closest nucleotide matches of GenBank sequences to excised TGGE bands
Clone Model Fermentation period Maximum similarity to organism GenBank accession number % Similarity Phylogenetic group
a A HE Enterococcus faecalis S613 ADDP00000000 99 Enterococcaceae
b A HE Clostridium sp. M62/1 1 ACFX00000000 99 Clostridiaceae
c A HE Clostridium sp. SS2/1 ABGC00000000 99 Clostridiaceae
d A NE Eubacterium rectale ATCC 33656 NC 012781 99 Eubacteriaceae
e A NE E. rectale ATCC 33656 NC 012781 100 Eubacteriaceae
f A NE Bifidobacterium adolescentis L2-32 AAXD00000000 99 Actinobacteria
g A LE Bacteroides ovatus ATCC 8483 AAXF00000000 99 Bacteroidaceae
a B NE Eubacterium hallii DSM 3353 ACEP00000000 100 Eubacteriaceae
b B NE B. adolescentis ATCC 15703 NC 008618 100 Actinobacteria
c B HE Eubacterium eligens ATCC 27750 NC 012780 98 Eubacteriaceae
of each subpopulation were observed between replicates. Roseburia/E. rectale were primarily stimulated and likely responsible for the increased butyrate production in model B during high energy conditions, whereas E. hallii predominated in model A (Table 2). Normal nutrient conditions resulted in the opposite effect on both sub-populations with E. hallii responding favorably in model B and Roseburia/E. rectale in model A. However, F. prausnitzii, a butyrate-producing member of clostridia cluster IV, demonstrated a pH-dependent response to
high energy load with low growth observed in R1. Despite rebounding population numbers in R2 and R3, F. prausnitzii produced a concerted and lesser response to HE medium in comparison with both Roseburia/E. rectale and E. hallii (Table 2). Gram-positive anaerobes demonstrate great variability in their ability to thrive at pH < 6.7 (Duncan et al., 2009). As such the demon-strated differences between clostridia cluster XIVa and IV in thriving at low pH suggest variable species-specific adaptive capacities. Furthermore, these results suggest a (a)
(b)
Fig. 4. (a) PCA plot of the effect of nutrient load on community structure and (b) Scree plot of PCA component variances. RN1A: NE medium R1 model A; RN2A: NE medium R2 model A; RN3A: NE medium R3; model A; RH1A: HE medium R1 model A; RH2A: HE medium R2 model A; RH3A: HE medium R3 model A; RL1A: LE medium R1 model A; RL2A: LE medium R2 model A; RL3A: LE medium R3 model A; RN1B: NE medium R1 model B; RN2B: NE medium R2 model B; RN3B: NE medium R3; model B; RH1B: HE medium R1 model B; RH2B: HE medium R2 model B; RH3B: HE medium R3 model B; RL1B: LE medium R1 model B; RL2B: LE medium R2 model B; RL3B: LE medium R3 model B. Circles denote nutrient load-dependent clusters.
(a)
(b)
Fig. 5. (a) PCA plot of the effect of nutrient load on metabolic activity and (b) Scree plot of PCA component variances. RN1A: NE medium R1 model A; RN2A: NE medium R2 model A; RN3A: NE medium R3; model A; RH1A: HE medium R1 model A; RH2A: HE medium R2 model A; RH3A: HE medium R3 model A; RL1A: LE medium R1 model A; RL2A: LE medium R2 model A; RL3A: LE medium R3 model A; RN1B: NE medium R1 model B; RN2B: NE medium R2 model B; RN3B: NE medium R3; model B; RH1B: HE medium R1 model B; RH2B: HE medium R2 model B; RH3B: HE medium R3 model B; RL1B: LE medium R1 model B; RL2B: LE medium R2 model B; RL3B: LE medium R3 model B. Circles denote nutrient load-dependent clusters.
potential struggle between intrinsic microbiota regulatory factors and nutrient availability in determining popula-tion growth and metabolic activity. Nevertheless, despite differences observed within clostridia cluster XIVa, the capacity for subtle inter-population shifts in inducing the same reproducible metabolic effect are effectively demon-strated. The majority of butyrate produced in the gut occurs via the butyryl CoA/acetate CoA pathway; how-ever, butyrate production via butyrate kinase activity has also been reported (Louis et al., 2004). Fermentation of various nonstarch polysaccharides was shown to differen-tially impact butyrate production by inducing either buty-ryl CoA/acetate CoA transferase or butyrate kinase in the gastrointestinal tract of weaned pigs (Metzler-Zebeli et al., 2010). Sequence analysis of clones excised from TGGE profiles during the HE fermentation period predominately identified butyrate-producing Firmicutes, further substan-tiating the observed qPCR results (Tables 2 and 4). While most cluster XIVa isolates possess either butyryl CoA/ acetate CoA transferase or butyrate kinase activity, some species of Lachnospiraceae and Eubacteriaceae exhibit both (Duncan et al., 2002a, b). It is possible that the differ-ences observed within the different clostridia cluster XIVa subpopulations of E. hallii and Roseburia/E. rectale in the two models during NE and HE medium fermentation was a function of different butyrate production pathways, induced by intermediate metabolite (e.g. lactate) availabil-ity. Eubacterium hallii are known lactate-utilizing, buty-rate-producing species, whereas no significant ability to use lactate has been detected in R. intestinalis or E. rectale (Duncan et al., 2004). Furthermore, E. hallii may produce butyrate from acetate, lactate as well as carbohydrates (Duncan et al., 2004; Sato et al., 2008).
Nutrient deprivation produced a concerted and distinct metabolic and community restructuring effect. Metabolic activities were significantly lower and represented 35–50% of normal energy metabolic activity, consistent with the 40% reduction in fermentable energy (Table 3). SRB demonstrated the most substantial response to low energy conditions (Table 2; LE). SRB have been implicated in the pathology of inflammatory bowel disease, and it is widely postulated that SRB-mediated production of hydrogen sulfide may be culprit (Macfarlane et al., 2009a, b). SRB have also been described as efficient mucin-utilizers owing to the release of sulfate during mucin degradation (Gibson et al., 1988). Although the nutrient load, including micronutrients, was reduced by 40% in the low energy medium, mucin concentrations remained the same for each medium. Hence, it is possible that SRB are able to outcompete other commensal organ-isms during periods of nutrient starvation by the ability to utilize sulfate resulting from mucin degradation. A sig-nificant lactobacilli bloom was observed, particularly in
model A and was a surprising observation as lactobacilli remained below detection during both HE and NE med-ium fermentation and in feces (Table 2). It is possible that lactobacilli are capable of maintaining growth through scavenging a wide variety of complex substrate under nutrient limitation. As such, lactate could become a central key intermediate metabolite under starvation conditions. Previous results have also demonstrated an inhibitory effect of SRB on butyrate production by E. hal-lii (Marquet et al., 2009). Taken together, this hypothesis could explain the simultaneous blooms of lactobacilli and lactate-utilizing SRB and Veillonella and subsequent reduction in lactate-utilizing, butyrate-producing E. hallii but not acetate-utilizing, butyrate-producing Roseburia/ E. rectale during low energy conditions. Succinate pro-duction and utilization could also possibly account for the ecological reshuffling during nutrient deprivation and should be included in future metabolic analyses. While the metabolism and ecology of SRB are well documented in environmental microbiology and Veillonella are recog-nized as early colonizers of Western infants, their exact roles in the healthy gut remain poorly understood (Adler-berth & Wold, 2009). These results however suggest a complex hierarchy and network of cross-feeding mediated by numerically smaller populations, which may be poised to outcompete populations accustomed to sufficient nutrient availability.
PCA of normal, high, and low energy loading on com-munity structure and metabolic activity demonstrated the reproducibility and robustness of this fermentation model (Figs 4a and 5a). Community structure clusters were pre-dominately a function of simulated colonic conditions. Normal and high energy-dependent community struc-tures of the transverse and distal colon regions formed one distinct cluster, suggesting that community structures are relatively robust with little substantial change during normal and overabundant nutrient supply (Fig. 4a). Con-versely, LE medium produced a distinct cluster (Fig. 4a). No specific intrinsic effect of high and normal energy loading on the community structures in R1 of both mod-els could be demonstrated and is likely a function of the low population numbers of circumneutral pH favoring Bacteroides, F. prausnitzii, SRB, and Enterobacteriaceae (Duncan et al., 2009) in this reactor owing to low pH. Similar results were observed using PCA to assess the effects of nutrient load on metabolic activity (Fig. 5a). In this case, metabolic activity in each simulated colonic region clustered according to the nutrient load supplied. Thus, nutrient load appears to be a greater determinant of metabolic activity. While these observations are consis-tent with previous reports of diet-induced changes to the gut microbiota (Ley et al., 2006; Duncan et al., 2008; Santacruz et al., 2009; Schwiertz et al., 2010), our results
highlight the impact nutrient deprivation imparts upon the gut microbiota. Furthermore, despite changes to microbial community structures, microbiota demon-strated a concerted metabolic adaption suggesting over-lapping and redundant metabolic pathways, exercised by different population members.
A frequent misconception of in vitro gut fermentation modeling is that each model attempts to be an exact 1 : 1 replicate of intestinal and host physiology. However, host physiology cannot be unequivocally reproduced in this in vitro model design and results generated represent a microbial response independent of host modulatory mechanisms (Payne et al., 2011a, b). Furthermore, the robustness of the model is dependent upon composi-tional and metabolic stability of the microbiota, so that any observed effects on community structure and meta-bolic activity are indeed a function of experimental treat-ment and not an artifact of adaptation of the microbiota to in vivo simulated conditions (Payne et al., 2011a, b). Nevertheless, the robustness of this model was demon-strated both quantitatively and by PCA and is consistent with the effects of nutrient loading on the gut microbiota in vivo (Jumpertz et al., 2011). Although microbiota-spe-cific effects on the clostridia cluster XIVa community structure were observed as a function of varied substrate availability, the use of a single microbiota each precludes the ability to ascertain the significance of these effects with the difference in host weight status. Multiple repetitions of this study using obese and normal-weight microbiota are necessary in definitively attributing any of these results to weight status. In conclusion, this study identified several interesting and novel trends regarding the impact dietary nutrient loads may confer upon the resident gut microbiota, suggesting the need to better elucidate the relationship between community member-ship and metabolic pathways encoded by the commensal gut community.
Acknowledgements
The authors report no conflicts of interest. This work was supported by ETHIIRA grant ETH-18 08-02 and approved by the ETH ethics committee (EK 2009-N-01).
References
Adlerberth I & Wold AE (2009) Establishment of the gut microbiota in Western infants. Acta Paediatr
98: 229–238.
Aeberli I, Kaspar M & Zimmermann MB (2007a) Dietary intake and physical activity of normal weight and
overweight 6 to 14 year old Swiss children. Swiss Med Wkly 137: 424–430.
Aeberli I, Zimmermann MB, Molinari L, Lehmann R, l’Allemand D, Spinas GA & Berneis K (2007b) Fructose intake is a predictor of LDL particle size in overweight schoolchildren. Am J Clin Nutr 86: 1174–1178.
Affenito SG, Dohm FA, Crawford PB, Daniels SR & Striegel-Moore RH (2002) Macronutrient intake in anorexia nervosa: The National Heart, Lung, and Blood Institute Growth and Health Study. J Pediatr 141: 701–705. Altschul SF, Madden TL, Schaffer AA, Zhang J, Zhang Z,
Miller W & Lipman DJ (1997) Gapped BLAST and PSI-BLAST: a new generation of protein database search programs. Nucleic Acids Res 25: 3389–3402.
Armougom F, Henry M, Vialettes B, Raccah D & Raoult D (2009) Monitoring bacterial community of human gut microbiota reveals an increase in Lactobacillus in obese patients and methanogens in anorexic patients. PLoS ONE 4: e7125 1–8.
Backhed F, Ding H, Wang T, Hooper L, Koh GY, Nagy A, Semenkovich CF & Gordon JI (2004) The gut microbiota as an environmental factor that regulates fat storage. P Natl Acad Sci USA 101: 15718–15723.
Backhed F, Ley RE, Sonnenburg JL, Peterson DA & Gordon JI (2005) Host-bacterial mutualism in the human intestine. Science 307: 1915–1920.
Berenson GS, Srinivasan SR, Bao WH, Newman WP, Tracy RE, Wattigney WA & Study BH (1998) Association between multiple cardiovascular risk factors and atherosclerosis in children and young adults. N Engl J Med 338: 1650–1656. Beyer PL, Caviar EM & McCallum RW (2005) Fructose intake
at current levels in the United States may cause
gastrointestinal distress in normal adults. J Am Diet Assoc 105: 1559–1566.
Brosius J, Palmer JL, Kennedy JP, Noller & HE (1978) Complete nucleotide sequence of the 16S ribosomal RNA gene from Escherichia coli. P Natl Acad Sci USA 78: 4801–4805.
Bryant MP (1972) Commentary on the Hungate technique for culture of anaerobic bacteria. Am J Clin Nutr 25: 1324– 1328.
Casasnovas AB, Cives RV, Jeremias AV, Castrogago M, Cadranel S & Sierra RT (1991) Measurement of colonic transit-time in children. J Pediatr Gastroenterol Nutr 13: 42–45.
Cinquin C, Le Blay G, Fliss I & Lacroix C (2004)
Immobilization of infant fecal microbiota and utilization in an in vitro colonic fermentation model. Microb Ecol 48: 128–138.
Cinquin C, Le Blay G, Fliss I & Lacroix C (2006a)
Comparative effects of exopolysaccharides from lactic acid bacteria and fructo-oligosaccharides on infant gut microbiota tested in an in vitro colonic model with immobilized cells. FEMS Microbiol Ecol 57: 226–238. Cinquin C, Le Blay G, Fliss I & Lacroix C (2006b) New
three-stage in vitro model for infant colonic fermentation with immobilized fecal microbiota. FEMS Microbiol Ecol 57: 324– 336.
Cleusix V, Lacroix C, Vollenweider S & Le Blay G (2008) Glycerol induces reuterin production and decreases Escherichia coli population in an in vitro model of colonic fermentation with immobilized human feces. FEMS Microbiol Ecol 63: 56–64.
Cleusix V, Lacroix C, Dasen G, Leo M & Le Blay G (2010) Comparative study of a new quantitative real-time PCR targeting the xylulose-5-phosphate/fructose-6-phosphate phosphoketolase bifidobacterial gene (xfp) in faecal samples with two fluorescence in situ hybridization methods. J Appl Microbiol 108: 181–193.
Cordain L, Eaton SB, Sebastian A, Mann N, Lindeberg S, Watkins BA, O’Keefe JH & Brand-Miller J (2005) Origins and evolution of the Western diet: health implications for the 21st century. Am J Clin Nutr 81: 341–354.
Cummings JH & Macfarlane GT (1997) Colonic microflora: nutrition and health. Nutrition 13: 476–478.
Duncan SH, Hold GL, Harmsen HJ, Stewart CS & Flint HJ (2002a) Growth requirements and fermentation products of Fusobacterium prausnitzii, and a proposal to reclassify it as Faecalibacterium prausnitzii gen. nov., comb. nov. Int J Syst Evol Microbiol 52: 2141–2146.
Duncan SH, Barcenilla A, Stewart CS, Pryde SE & Flint HJ (2002b) Acetate utilization and butyryl coenzyme A (CoA): acetate-CoA transferase in butyrate-producing bacteria from the human large intestine. Appl Environ Microbiol 68: 5186– 5190.
Duncan SH, Louis P & Flint HJ (2004) Lactate-utilizing bacteria, isolated from human feces, that produce butyrate as a major fermentation product. Appl Environ Microbiol 70: 5810–5817.
Duncan SH, Lobley GE, Holtrop G, Ince J, Johnstone AM, Louis P & Flint HJ (2008) Human colonic microbiota associated with diet, obesity and weight loss. Int J Obes 32: 1720–1724.
Duncan SH, Louis P, Thomson JM & Flint HJ (2009) The role of pH in determining the species composition of the human colonic microbiota. Environ Microbiol 11: 2112–2122. Eberhardt MS, Ogden C, Engelgau M, Cadwell B, Hedley AA
& Saydah SH (2005) Prevalence of overweight and obesity among adults with diagnosed diabetes– United States, 1988–1994 and 1999–2002 (Reprinted from MMWR, vol 53, pg 1066–1068, 2004). JAMA 293: 546–547.
Eckburg PB, Bik EM, Bernstein CN et al. (2005) Diversity of the human intestinal microbial flora. Science 308: 1635– 1638.
Elson CO, Sartor RB, Tennyson GS & Riddell RH (1995) Experimental models of inflammatory bowel disease. Gastroenterology 109: 1344–1367.
Fernstrom MH, Weltzin TE, Neuberger S, Srinivasagam N & Kaye WH (1994) 24-Hour Food-Intake in Patients with Anorexia-Nervosa and in Healthy Control Subjects. Biol Psychiatry 36: 696–702.
Flint HJ, Bayer EA, Rincon MT, Lamed R & White BA (2008) Polysaccharide utilization by gut bacteria: potential for new
insights from genomic analysis. Nat Rev Microbiol 6: 121– 131.
Frank DN, Amand ALS, Feldman RA, Boedeker EC, Harpaz N & Pace NR (2007) Molecular-phylogenetic characterization of microbial community imbalances in human
inflammatory bowel diseases. P Natl Acad Sci USA 104: 13780–13785.
Furet JP, Firmesse O, Gourmelon M, Bridonneau C, Tap J, Mondot S, Dore´ J & Corthier G (2009) Comparative assessment of human and farm animal faecal microbiota using real-time quantitative PCR. FEMS Microbiol Ecol 68: 351–362.
Gibson GR & Wang X (1994) Enrichment of bifidobacteria from human gut contents by oligofructose using continuous culture. FEMS Microbiol Lett 118: 121–127.
Gibson GR, Cummings JH & Macfarlane GT (1988) Use of a 3-Stage continuous culture system to study the effect of mucin on dissimilatory sulfate reduction and
methanogenesis by mixed populations of human gut bacteria. Appl Environ Microbiol 54: 2750–2755. Guo X, Xia X, Tang R, Zhou J, Zhao H & Wang K (2008)
Development of a real-time PCR method for Firmicutes and Bacteroidetes in faeces and its application to quantify intestinal population of obese and lean pigs. Lett Appl Microbiol 47: 367–373.
Hernandez RJ, Gutowski D & Guire KE (1979) Capacity of the colon in children. AJR Am J Roentgenol 133: 683–684. Jensen TK, Teglbjaerg PS, Lindboe CF & Boye M (2004)
Demonstration of Brachyspira aalborgi lineages 2 and 3 in human colonic biopsies with intestinal spirochaetosis by specific fluorescent in situ hybridization. J Med Microbiol 53: 341–343.
Jumpertz R, Le DS, Turnbaugh PJ, Trinidad C, Bogardus C, Gordon JI & Krakoff J (2011) Energy-balance studies reveal associations between gut microbes, caloric load, and nutrient absorption in humans. Am J Clin Nutr 94: 58–65. Kopelman PG (2000) Obesity as a medical problem. Nature
404: 635–643.
Leung KP, Price RR, Viscount HB & Stanley MC (2007) Targeted profiling of oral bacteria in human saliva and in vitro biofilms with quantitative real-time PCR. Biofouling 23: 203–213.
Ley RE, Backhed F, Turnbaugh P, Lozupone CA, Knight RD & Gordon JI (2005) Obesity alters gut microbial ecology. P Natl Acad Sci USA 102: 11070–11075.
Ley RE, Turnbaugh PJ, Klein S & Gordon JI (2006) Microbial ecology: human gut microbes associated with obesity. Nature 444: 1022–1023.
Louis P, Duncan SH, McCrae SI, Millar J, Jackson MS & Flint HJ (2004) Restricted distribution of the butyrate kinase pathway among butyrate-producing bacteria from the human colon. J Bacteriol 186: 2099–2106.
Ludwig DS, Majzoub JA, Al-Zahrani A, Dallal GE, Blanco I & Roberts SB (1999) High glycemic index foods, overeating, and obesity. Pediatrics 103: E26.
Macfarlane GT, Macfarlane S & Gibson GR (1998) Validation of a three-stage compound continuous culture system for investigating the effect of retention time on the ecology and metabolism of bacteria in the human colon. Microb Ecol 35: 180–187.
Macfarlane GT, Bartosch S, Fite A & McMurdo MET (2004) Characterization of bacterial communities in feces from healthy elderly volunteers and hospitalized elderly patients by using real-time PCR and effects of antibiotic treatment on the fecal microbiota. Appl Environ Microbiol 70: 3575– 3581.
Macfarlane GT, Blackett KL, Nakayama T, Steed H & Macfarlane S (2009a) The gut microbiota in inflammatory bowel disease. Curr Pharm Des 15: 1528–1536.
Macfarlane S, Steed H & Macfarlane GT (2009b) Intestinal bacteria and inflammatory bowel disease. Crit Rev Clin Sci 46: 25–54.
Marquet P, Duncan SH, Chassard C, Bernalier-Donadille A & Flint HJ (2009) Lactate has the potential to promote hydrogen sulphide formation in the human colon. FEMS Microbiol Lett 299: 128–134.
McCaig AE, Glover LA & Prosser JI (2001) Numerical analysis of grassland bacterial community structure under different land management regimens by using 16S ribosomal DNA sequence data and denaturing gradient gel electrophoresis banding patterns. Appl Environ Microbiol 67: 4554–4559.
McNeil NI (1984) The contribution of the large intestine to energy supplies in man. Am J Clin Nutr 39: 338–342. Meile L, Ludwig W, Rueger U, Gut C, Kaufmann P, Dasen G,
Wenger S & Teuber T (1997) Bifidobacterium lactis sp. nov., a moderately oxygen tolerant species isolated from
fermented milk. Syst Appl Microbiol 20: 57–64.
Metzler-Zebeli BU, Hooda S, Pieper R, Zijlstra R, van Kessel AG, Mosenthin R & Ga¨nzle MG (2010) Non-starch polysaccharides modulate bacterial microbiota, pathways for butyrate production, and abundance of pathogenic Escherichia coli in the gatrointestinal tract of pigs. Appl Environ Microbiol 76: 392–3701.
Muyzer G, de Waal EC & Uitterlinden AG (1993) Profiling of complex microbial populations by denaturing gradient gel electrophoresis analysis of polymerase chain reaction-amplified genes coding for 16S rRNA. Appl Environ Microbiol 59: 695–700.
Nadal I, Santacruz A, Marcos A et al. (2009) Shifts in clostridia, bacteroides and immunoglobulin-coating fecal bacteria associated with weight loss in obese adolescents. Int J Obes 33: 758–767.
Nicklas TA, Baranowski T, Cullen KW & Berenson G (2001) Eating patterns, dietary quality and obesity. J Am Coll Nutr 20: 599–608.
Ogier JC, Son O, Gruss A, Tailliez P & Delacroix-Buchet A (2002) Identification of the bacterial microflora in dairy products by temporal temperature gradient gel electrophoresis. Appl Environ Microbiol 68: 3691–3701.
Payne AN, Zihler A, Chassard C & Lacroix C (2011a) Advances and perspectives in in vitro human gut fermentation modeling. Trends Biotechnol 30: 17–25. Payne AN, Chassard C, Zimmermann MB, Mu¨ller P, Stinca S &
Lacroix C (2011b) The metabolic activity of gut microbiota in obese children is increased compared with normal-weight children and exhibits more exhaustive substrate utilization. Nutr Diabetes 1: e12. doi:10.1038/nutd.2011.8.
Pereyra LP, Hiibel SR, Riquelme MVP, Reardon KF & Pruden A (2010) Detection and Quantification of Functional Genes of Cellulose-Degrading, Fermentative, and Sulfate-Reducing Bacteria and Methanogenic Archaea. Appl Environ Microbiol 76: 2192–2202.
Ramirez-Farias C, Slezak K, Fuller Z, Duncan A, Holtrop G & Louis P (2009) Effect of inulin on the human gut
microbiota: stimulation of Bifidobacterium adolescentis and Faecalibacterium prausnitzii. Br J Nutr 101: 541–550. Santacruz A, Marcos A, Warnberg J et al. (2009) Interplay
between weight loss and gut microbiota composition in overweight adolescents. Obesity 17: 1906–1915.
Sartor RB (1997) The influence of normal microbial flora on the development of chronic mucosal inflammation. Res Immunol 148: 567–576.
Sato T, Matsumoto K, Okumura T, Yokoi W, Naito E, Yoshida Y, Nomoto K, Ito M & Sawada H (2008) Isolation of lactate utilising butyrate-producing bacteria from human feces and in vivo administration of Anaerostipes caccae strain L2 and galacto-oligosaccharides in a rat model. FEMS Microbiol Ecol 66: 528–536.
Scheppach W (1994) Effects of short chain fatty acids on gut morphology and function. Gut 35: S35–S38.
Schwiertz A, Taras D, Schafer K, Beijer S, Bos NA, Donus C & Hardt PD (2010) Microbiota and SCFA in lean and overweight healthy subjects. Obesity (Silver Spring) 18: 190– 195.
Sutcliffe JR, King SK, Hutson JM, Cook DJ & Southwell BR (2006) Gastrointestinal transit in children with chronic idiopathic constipation. Pediatr Surg Int 25: 465–472. Tiihonen K, Ouwehand AC & Rautonen N (2010) Human
intestinal microbiota and healthy ageing. Ageing Res Rev 9: 107–116.
Turnbaugh PJ, Ley RE, Mahowald MA, Magrini V, Mardis ER & Gordon JI (2006) An obesity-associated gut microbiome with increased capacity for energy harvest. Nature 444: 1027–1031.
van Tongeren SP, Slaets JPJ, Harmsen HJM & Welling GW (2005) Fecal microbiota composition and frailty. Appl Environ Microbiol 71: 6438–6442.
Wright JD, Borrud LG, McDowell MA, Wang CY, Radimer K & Johnson CL (2007) Nutrition assessment in the National Health And Nutrition Examination Survey 1999-2002. J Am Diet Assoc 107: 822–829.
Zihler A, Gagnon M, Chassard C, Hegland A, Stevens MJA, Braegger CP & Lacroix C (2010) Unexpected consequences of administering bacteriocinogenic probiotic strains for
Salmonella populations, revealed by an in vitro colonic model of the child gut. Microbiology 156: 3342–3353.
Supporting Information
Additional Supporting Information may be found in the online version of this article:
Fig. S1. Daily total SCFA concentrations measured during the entire 40 day continuous fermentation.
Table S1. HE, NE and LE fermentation media dry matter compositions.
Table S2. Bacterial populations measured by qPCR in effluent samples in each reactor of replicate in vitro fer-mentation models during the re-stabilization period. Table S3. SCFA concentrations and ratios in effluent samples of each reactor of replicate in vitro fermentation models during the re-stabilization period.
Please note: Wiley-Blackwell is not responsible for the content or functionality of any supporting materials sup-plied by the authors. Any queries (other than missing material) should be directed to the corresponding author for the article.