Obtaining
Party Positions on Immigration in Switzerland:
Comparing
Different Methods
D
IDIERR
UEDINUniversity of Neuchâtel
Abstract: The position of political parties on policy issues is crucial for many questions of political science, including studies of political representation. This research note examines different methods for obtaining party positions on immigration in retrospective. Party positions are obtained using pooled expert surveys, manual coding of party manifestos with a conventional codebook, manual coding of manifestos using check-lists, and automatic coding of manifestos using Wordscores and a dictionary of keywords respectively. In addition, positions from a media analysis and a retrospec-tive evaluation of researchers in the field of immigration are used. The results suggest that most methods differentiate the same order of party positions. While there are high correlations between many methods, the different methods tend not to agree on the exact positions. The automatic dictionary approach does not seem to measure party positions reliably.
KEYWORDS: Migration, Political science, Political parties, Elections
Introduction
No matter how precisely the political space is perceived, political parties are understood as differentiating themselves in terms of preferred policies. Although the positions of left and right are probably the most common way to describe the political space, other issue domains are of central interest to political science – notably for questions of political rep-resentation or the success of social movements. One such issue domain is immigration, a domain that has characterized party politics in many Western European countries in recent years, including Switzerland. This research notes compares how the party positions obtained using different methods compare over time. Whereas expert surveys usually col-lect information on party positions at the time of the survey, the other methods considered reconstruct party positions in retrospective. In this sense, the research note addresses the issue of how to best obtain party positions backwards in time. There are different methods for estimating the positions of political parties on various issues, and the jury is still out on which method is the most suitable, valid or reliable (compare special issue edited by Marks 2007). This is particularly the case for specific issue domains and retrospective estimates of party positions.
The research note speaks to two audiences. On the one hand researchers interested in measurement of party positions will probably examine the degree to which different meth-ods identify the same party positions. Various correlations between methmeth-ods are reported.
On the other hand, those interested in Swiss parties will probably be more interested in the actual positions rather than the different methods that can be employed. Party positions are presented for all major parties in Switzerland.
In many situations, expert surveys are the preferred approach for identifying party posi-tions (Benoit and Laver 2007; Klemmensen, Hobolt, and Hansen 2007). Expert surveys are relatively cost effective compared to manual approaches and do not need additional data processing for deriving party positions. Indeed, expert surveys are often seen as authorita-tive and taken as the standard against which different methods are compared (Helbling and Tresch 2011; Laver and Garry 2000; Lowe et al. 2011). This is followed in this paper to some degree, although expert surveys are not without critiques. For example, expert sur-veys often do not differentiate between party leaders, and party activists, and criteria for placing parties are often poorly specified (Budge 2000). There are also applications where expert surveys are simply not available, such as for studies focusing on party positions in the regional context (e.g. Giger, M€uller, and Debus 2011), or for analyses covering past positions of parties when no expert surveys were carried out. For example, only recently have expert surveys begun to include questions on the position on immigration more systematically.
One method is the use of political texts to obtain party positions, namely using party manifestos. Political texts have the advantage that the time series can be extended back-wards as long as archival copies of the manifestos are available. Content analysis is also used because experts seem unable to position parties reliably in retrospective; they might place parties in a more static way than they really were (McDonald, Mendes, and Kim 2007; Benoit and Laver 2007; Klemmensen, Hobolt, and Hansen 2007). More generally, party manifestos may allow detailed measurement of party positions that is unaffected by party behaviour, and might even lead to more valid estimates of party positions than expert surveys (Budge 2000; Laver and Garry 2000; Benoit, Laver, and Mikhaylov 2009; Lowe et al. 2011). By contrast, media analysis to obtain party positions is very much affected by party behaviour, but is hailed as more relevant than party manifestos (Kriesi et al. 2006; Helbling and Tresch 2011; Kriesi et al. 2012).
This research note considers different methods and examines the extent to which they lead to the same estimates of party positions – a test of correlational validity (Carmines and Zeller 1979). Of course different methods have been compared, both for left-right posi-tions (e.g. Benoit and Laver 2007; Chen 2011; Rooduijn and Pauwels 2011; Klemmensen, Hobolt, and Hansen 2007) and European integration (Marks et al. 2007; Netjes and Bin-nema 2007; Ray 2007; Whitefield et al. 2007). Studies generally find that manifesto-based approaches are as feasible as expert surveys, and that automatic approaches can lead to valid estimates of party positions. Similarly, Helbling and Tresch (2011) show that posi-tions derived from media analyses are accurate. In this research note I am interested in party positions on immigration and include considerations of changes over time. In con-trast to generic issues such as political left and right, or social issues, it is possible that for some parties and some years a particular issue is not salient and thus absent from the manifestos. In many cases, much less space is dedicated to immigration than to other issues such as the economy. This means shorter relevant passages: less data to work with. With less data it might become difficult to obtain nuanced positions. Finally, particular to immigration is the possibility that immigration may only be mentioned when it is opposed; the status quo of allowing certain immigrants may not be mentioned at all.
Data limitations aside, scepticism remains whether automatic approaches to positioning parties can be as accurate as manual coding. It can be argued that– because of the human
involvement in coding – manual coding is more valid than automated coding. Indeed, manual coding allows for fine-graded positioning of parties on multiple issues. Expert sur-veys are also limited in their ability to reliably position parties in retrospective. McDonald et al. (2007) formulate a clear expectation that retrospective expert assessments underesti-mate the dynamics of party positions. Like other expert-based approaches, they may be sensitive to day-to-day politics and ignore other aspects that inform party positions. This is even more the case for media analyses, where aspects of newsworthiness may bias which parties are covered in the news and in what way. Particularly positions at the extreme may be reported more frequently. Among automatic approaches to coding political texts, Chen (2011) reports that a dictionary-based approach leads to better results than Wordscores. Whilst the intuition once again is that human involvement– this time in creating a dictio-nary of keywords – outperforms automatic approaches, the many successful applications of Wordscores seem to weaken the argument to some degree. By comparing different methods, this research note heeds to calls for data triangulation when positioning political parties (Marks 2007; Marks et al. 2007). Whilst focusing on triangulation on the basis of method, different data sources are invariably used. Even though expert positions will be used as the baseline for comparison, this research note remains agnostic as to whether expert positions or manifesto-based approaches are more valid.
Methods
This research note compares four types of methods for estimating party positions: pooled expert surveys, a retrospective survey, several manifesto-based approaches, and media analysis. All methods are described in more detail in the following paragraphs. In each case, party positions on immigration were estimated for the elections between 1995 and 2011, with the retrospective survey going back to 1991. Where necessary, estimates were rescaled to a scale from 0 to 20 to allow comparability. All methods were applied to the five largest Swiss parties. The parties are the Greens (GPS), the Socialists (SPS), the Christian Democrats (CVP), the Liberals (FDP), and the People’s Party (SVP).
Pooled Expert Surveys
There is no expert survey available positioning Swiss parties on immigration for the entire period covered in this research note. Indeed, expert surveys have only recently begun ask-ing question on immigration more systematically. To obtain a time series, positions from a range of expert surveys were pooled (Lubbers, Gijsberts, and Scheepers 2002; Benoit and Laver 2006; Ladner, Schwarz, and Fivaz 2009; EUI 2009; Hooghe et al. 2010; Bakker et al. 2012), and averaged using a 7-year moving average. Since they fit the time trends, for recent years data from Smartvote (Politools 2011) and Parteienkompass (HEP Verlag and Politools 2007) were also added. Smartvote positions parties on the basis of candidate sur-veys; the Parteienkompass combines a range of sources, including roll call data and party positions in referendums and popular initiatives. These additional data could be left out without substantively affecting the reported results, but their inclusion reduces the influ-ence of individual data points. The use of a moving average means that the position for a given party in 2003, for instance, is taken as the average of all positions available between 2000 and 2006. Put differently, in addition to the year in question – in this case 2003 – three years before and after are also included. The chosen approach reflects the intuition that party positions evolve gradually rather than change abruptly, and implies that party
positions on immigration exist at all times – not merely in the context of elections. The long time span for the moving average was also necessary to bridge gaps in coverage, notably during the earlier years covered. While this approach invariably smoothes changes between years, it also lowers the impact of individual estimates that may be considered outliers. The same substantive results can be obtained with 5-year moving averages; for shorter averaging periods the time series of the pooled expert survey becomes disrupted.
Whilst expert surveys can be pooled, as is done in this research note, there are issues of comparison because of different wordings that may affect comparability (Converse and Traugott 1986; Davidov, Schmidt, and Billiet 2010; Foddy 1993; Sirken et al. 1999). These issues are not addressed in this research note, and no modifications were applied beyond a simple rescaling to the 0 to 20 scale. Although depending on the research it may be more appropriate to use methods other than moving averages to address the lack of data for some of the years, such as choosing the closest available survey for each election year. Indeed, I have also considered only using expert estimates from election years where avail-able, with the mean of the closest surveys before and after an election in other cases.1 In the case of expert surveys that include a question on immigration in Switzerland, the differences are negligible (r = 0.99). The implication of this alternative approach is that party positions are best determined during.
Retrospective Survey
The retrospective survey was carried out at the Swiss Forum for Migration and Population Studies (SFM) at the University of Neuch^atel. All academic staff of the institute were invited to place the major parties on immigration issues. The question was asked for the current legislative period (2011), as well backwards over time to 1991– hence largely a ret-rospective assessment. The survey was carried out at the beginning of June 2011, an elec-tion year where immigraelec-tion was a salient issue. The 9 respondents all work on various aspects of immigration issues, mostly within Switzerland. As such they can be considered experts or specialists on immigration, yet to my knowledge none of them is an explicit expert on the Swiss party system. The fact that all researchers work at the same institute can be considered problematic, as this increases the likelihood that the same view on party politics is shared. The reported numbers are a priori likely to overestimate agreement among respondents.
The respondents were given a list of the five biggest parties in Switzerland (SVP, SPS, FDP, CVP, GPS), and asked to write the party acronyms on a blank scale (horizontal). The endpoints were labelled as liberal and restrictive, with a visible mid-point. A separate scale was used for each legislative period (vertical). The question asked the respondents to place parties (write their acronym) on immigration issues overall. Respondents were asked to place parties without referring to any source or indeed using any kind of evidence to back up their estimates. Some of the respondents expressed concern at the single scale, suggesting that there are different aspects of immigration policies that need to be differen-tiated. Others were concerned that they were unable to remember, particularly since they may have been too young to be interested in politics for the early years covered. Despite their initial concerns, most respondents placed all the parties for all the years. I encouraged them to include their ‘best estimate’, but everyone was given the option not to place parties at all.
1
At a later stage, the responses were coded on a scale from 0 (liberal) to 20 (restric-tive), with a midpoint at 10. The response was measured using the centre of the written party acronym as the party placement to ensure a systematic approach. The respondents were unaware of this procedure. Should they have meant the left of the party acronym to refer to the party position, the average bias would be less than half a point per respondent. Given the low degree of agreement outlined below, this difference seems negligible. The mean position from all respondents is used as the party position, with standard deviations calculated to give an indication of the spread of estimated party positions.
Content Analysis of Party Manifestos
There are two fundamental approaches for obtaining party positions from manifestos. On the one hand, the manifesto is perceived as data to be coded. Each statement or section of a manifesto is assigned a position on one or multiple political domains. A codebook is used, but the coders use their own judgements as to which wordings constitute evidence for a certain position. A well-established project using manual coding is the Comparative Manifesto Project (Volkens et al. 1995; Budge et al. 2001; Klingemann et al. 2006), where so-called quasi-sentences are coded manually. The approach by the CMP can in some cases lead to unexpected positions when compared to expert positions (e.g. Benoit and Laver 2006). More importantly, however, the available codes in the CMP are unsuitable to estimate party positions on immigration. The codes available (607: multiculturalism: posi-tive, 608: multiculturalism: negaposi-tive, and 705: underprivileged minority groups) confound immigration issues with other political issues. For example, code 705 makes no distinction between immigrants as minorities, national minorities, or minorities such as homosexuals and the disabled.
On the other hand, the relative frequency of words and expressions in manifestos can be used as data. In this case, party positions are derived from the fact that the parties empha-size different aspects of immigration in their manifestos, and with that different words are used at different frequencies. Even where the same issues are treated, they tend to be framed in different ways, which is reflected in the words chosen. The underlying assump-tion is that a more frequent use of a word or expression associated with a particular posi-tion means that the party is closer to said posiposi-tion. For instance, a party repeatedly referring to social inequalities is likely to be politically left, based on the observation that parties on the left tend to highlight issues of inequality. In the case of immigration, the different frames are apparent in references to ‘illegal immigrants’ or ‘sans papiers’, two terms with clear connotations against and in favour of immigration respectively. Approaches based on word frequencies use this information to derive party positions.
For all manifesto-based approaches – be they manual or automatic –, analyses were restricted to parts of the party manifestos about immigration. These sections were manu-ally chosen, although an inclusive dictionary of keywords was used to aid selection. The keywords were tested to ensure that they err on the inclusive side and highlight false posi-tives that were discarded by the coders. The guiding question was “is this sentence about immigration or integration?” In the following, references to party manifestos actually refer to the subset described. For automatic approaches the difference to the full manifes-tos can be crucial, both because of word frequencies and because keyword matches may carry different meaning out of context. German language manifestos were used for all parties.
Manual Coding: Sentence by Sentence
The manual coding of manifestos used a conventional codebook applied to natural sen-tences. More common than coding natural sentences is the division of texts into individual quasi-sentences. Quasi-sentences are either natural sentences, or parts of a sentence judged to have an independent meaning. This additional effort does not seem necessary, since nat-ural sentences also lead to valid estimates (D€aubler et al. 2012). The codebook included a number of variables to capture the position of immigration in a nuanced way. Of relevance for this research note is the positional question (“What is the position toward the issue?” – ranging from “strongly restrictive to migrants/ conservative/ pro-national residents/ mono-cultural” to “Strongly open to migrants/ progressive/ cosmopolitan/ multi-mono-cultural”). Five response categories were available, from positive (+1) to negative toward immigration ( 1), and examples were included to aid coding. The mean position of all claims by a party is taken as the party position. This position was rescaled to 0 to 20, with no other modifi-cations applied. More specifically, the mean position is increased by 1 and then multiplied by 10 to invert the position, taken away from 20 to give the reported party positions.
Check-list: Manifesto as Unit of Analysis
The check-list approach is similar to the manual sentence by sentence coding of party manifestos outlined above, but uses the entire manifesto as the unit of analysis. This fol-lows the tradition of Harmel et al. (1995; see also Gudbrandsen 2010). For the check-list approach, a questionnaire using 19 questions was created, with some of the questions drawing heavily on questions in Eurobarometer and the EU Profiler. The EU Profiler is a voting advice application allowing voters to identify their closest party in an election in a multidimensional policy space by answering a series of questions. A number of these ques-tions treat aspects of immigration. The structure of the check-list was designed to resemble the codebook used for the manual coding of natural sentences. The coders are asked to first read the sections of the manifesto about immigration. They then answered the ques-tions of the check-list as if it were a survey. To ensure that the answers chosen draw on the manifestos – and not on preconceptions the coders may have – a snippet of supporting text was required for each answer. The 19 questions covered skilled migration, restrictive immigration policies, whether immigrants should accept culture and values, the link between immigration and international terrorism, removing illegal immigrants, whether there are too many refugees, economic demand for immigrants, acquisition of citizenship, obstacles to refugee status, rights to family reunion, transnational activities of immigrants, removal of criminal immigrants, crime, impact on wages, political participation, racism, and local traditions. Factor analysis was used to confirm that these items all tap into the same underlying concept. For each statement, a positive, negative, or neutral position could be chosen – 3 categories. The sum of all questions is taken as the party position, rescaled to the 0 to 20 scale used. More specifically, the sum of all questions is increased by 19 and multiplied by 20/38, taken away from 20 to give the reported party positions.
Dictionary Approach: Matching Keywords
The automatic dictionary coding was implemented using Will Lowe’s Yoshikoder (Lowe 2009). The dictionary was developed in multiple stages. This was done in the context of the European Project SOM. Since the actual coding is done by a computer – there are no
human coders involved who would spot the obvious false positive – the dictionary needs to be carefully thought through. The initial plan to develop and refine the dictionary used by Laver and Garry (2000) was dropped, and word frequencies of the British National Party (BNP) manifesto were used as the starting point. This results in a first list of key-words that focuses on anti-immigration positions. Drawing on expert knowledge within the project, this initial list of keywords was expanded and refined to create a first dictio-nary. The dictionary was then translated into several language including German, and back-translated to reduce translation effects (Behling and Law 2000) and to improve the dictionary. This version was then piloted on British, Spanish, and Swiss-German manifes-tos to further refine the keywords and assign scores to the keywords. Each time a keyword is matched in the party manifesto, the assigned score is added to a tally, and the total number divided by the number of words in the manifesto is used to derive party positions. It lies in the nature of this approach that there are no direct translations of these scores to party positions. The conversion was derived post-hoc, using the range of observed scores as reference, matching these linearly to positions close to 0 and 20. The conversion factor (180) does not appear specific to Switzerland, although it is very likely a function of aver-age manifesto length, the dictionary, and the issue studied. Depending on the application, such post-hoc based approaches to rescaling can be problematic, although the correlations presented in this research note will not be affected.
Wordscores
Wordscores2 are a computerized approach to coding texts based on word frequencies. Being automatic, Wordscores are necessarily reliable, and there are many indications that estimated obtained using Wordscores are valid for analyses in various languages (Benoit and Laver 2008; Lowe 2008; Lowe et al. 2011; Martin and Vanberg 2008). The approach has successfully been used in many contexts, including the positions of cantonal parties in Switzerland (Giger, M€uller, and Debus 2011). A problem particular to Wordscores stems from the fact that Wordscores often appear less reliable at the edges: the extreme positions (Lowe et al. 2011). Depending on the research question, the exact positions at the edges are of crucial interest. For instance, we might be interested in changing positions of parties at the extreme right. Moreover, the choice of reference texts is not a trivial task. One way is to rely on expert surveys to reference manifestos (e.g. Benoit and Laver 2006 item 19: policies designed to help asylum seekers and immigrants integrate into society; Hooghe 2005 items 25 and 27: immigration, and integration of immigrants respectively). A chal-lenge in the case of immigration is that it seems difficult to find clear pro-migration stances for reference: parties with more immigrant-friendly policies tend to include them as part of wider concerns for equality and diversity and therefore write very little specifically about immigration. What is more, focusing on immigration, it is conceivable that in certain years other issues dominate to the extent that the issue is not mentioned in the party manifesto. This may affect all parties of interest in a particular year, or specific parties in a particular
2I have also used Wordfish to estimate party positions (Slapin and Proksch 2008), using Will Lowe’s JFreq
soft-ware and his Austin package in R. The 2003 manifestos of the GPS and the SVP were used to indicate policy directions as identification strategy– the most extreme positions in the data set according to the expert data. The resulting party positions suggest implausible radical changes of around 10 points from election to election. The exception to this pattern was the SVP which was identified as moderately anti-immigrant throughout the period covered (compare e.g. Dolezal 2012). This might be a result of the short texts available.
year or more generally. Furthermore, it is unclear how Wordscores performs on texts that are not actually about the issue in question; manual coding and the automatic dictionary approach would result in a missing value. To avoid this problem, subsets of manifestos were used verified to be about immigration.
Wordscores were carried out using Will Lowe’s JFreq software (Lowe 2010) and Austin package in R. A stemmer was applied, and the 20 most commonly used words in the man-ifestos were removed (stop words), as were numbers and currencies. Different methods for referencing were used and compared. The positions reported in this research note use 2003 as reference texts – setting them to the positions of Benoit and Laver (2006). This leads to stronger correlations with expert positions for the predicted positions than using the GPS and SVP as reference texts for all years. The estimated party positions were rescaled, because the figures provided by Austin were unrealistic (face validity). The lack of fit for raw figures was as expected; the lack of fit for the rescaled figures provided by Austin is caused by the assumptions used by the software – which proved inappropriate in this instance. As in the case of the automatic dictionary approach, rescaling was done post-hoc, based on the observed values. The raw scores minus 4.4, and then multiplied by 8 provide a rough rescaling to get close to the 0 to 20 scale used in this research note.
Media Analysis
As part of the project SOM, a large-scale claims analysis was carried out (Berkhout and Sudulich 2011). A claims analysis examines statements in news media where a political actor calls for change in policy. It allows for individual parties to be identified, but for many claims made by political parties the positional variable – the position of the party toward immigration – was not coded. As a result, only a relatively small number of esti-mated party positions are available for each party and election year (range = 0 to 32). The positional variable captures the position toward immigration on the same 5-point scale as described above in the context of manual coding. In fact, the same question wording was used to maximize comparability. The rationale for including data based on such a small number of cases is partly to test whether such limited data can lead to adequate estimates. Even though the positions of five years are combined – election year and two years before and after –, many recorded instances fall into election years. Restricting the view to elec-tion years further attenuates problems of small numbers. As outlined in the context of manual coding, the mean position is taken as the party position, rescaled to 0 to 20, and at least for the five biggest parties considered in this research note, the estimates seem plausible (face validity). The estimates from the media analysis still have to be interpreted with great care and findings may not be applicable to other media studies. Like other media studies, the intuition is to capture party positions in the context of electoral campaigns and constrained by the media. While these may not be sincere positions, these are likely the positions to which voters react (however, see Pellikaan and Walter (2010) for an extensive critique of media analysis to obtain party positions).
Findings
Position of Parties by Method
In a first step, the estimated positions for each party are examined. Figure 1 presents the estimated party positions on immigration for the four biggest parties (SPS, CVP, FDP,
and SVP). In each instance, different methods are included. The position of the GPS is not included for presentational reasons, but it is discussed in the main text, along with meth-ods that were not included in figure 1 for reasons of clarity. Correlations between methmeth-ods will be presented further below.
Starting with the SVP, all methods suggest that the SVP is anti-immigrant, which is plausible – indicating face validity. The different methods, however, to not agree on the
Figure 1: Party Positions on Immigration by Method.
Notes: The estimated party positions using different methods. Given are the positions for the years 1995 to 2011 of the SVP, FDP, CVP, and SPS respectively. The different methods are pooled expert surveys (solid), manual coding of party manifestos (dashed), the check-list approach (dotted), a retrospective survey (long-dashed), and Wordscores (two-dashed). The y-axis gives the position on immigration on a scale from 0 (liberal) to 20 (restrictive).
exact position of the SVP, some of which may be due to rescaling. Most methods identify a shift toward more restrictive policies over time, but it is not quite clear when this shift occurred. The pooled expert data suggest a shift between 1995 and 2003, with less change thereafter. By contrast, the manifesto-based manual coding and the check-list approach suggest a continuous shift. More stable is the retrospective assessment where no significant shift in position can be identified. This may be an artefact of the method. Wordscores places the SVP at the restrictive end, but identifies a trend toward more liberal positions. There is less agreement with positions from expert data and manual coding for the dictio-nary approach (not shown in figure 1). Large changes from year to year can be observed in this case. If anything, the dictionary approach suggests a trend toward more liberal positions, including positions that are at the liberal end of the scale: The position for 2007 is estimated to be 7.7. The positions derived from the media study largely mirror the check-list, with the exception of the estimate for 2011, where the media study suggests a rather unexpected shift toward more liberal positions, namely a position of 13.6.
Of the five parties examined in this research note, the FDP seems the most difficult party to pin down. The different methods suggest different trends and a wide range of pos-sible positions. All the positions are in the centre, slightly to the more restrictive end. The pooled expert surveys suggest a steady shift toward more liberal positions. This is some-what mirrored by the check-list, albeit the check-list suggests a more abrupt change between 1999 and 2003. The Wordscores estimates are also largely in agreement with the shift toward more liberal positions identified by the pooled expert surveys. The manual coding also indicates a shift toward more liberal positions, but the change is much more significant, beginning at a more restrictive position (15.8 in 1995), and leading to a rather liberal position in 2011 (5.6). The opposite trend – toward more restrictive positions – is suggested by the retrospective survey, where a steady trend toward more restrictive posi-tions is indicated. This trend toward more restrictive posiposi-tions is also suggested by the dic-tionary approach, with the exception of an unexpected value for 2011: 1.3 is a very liberal position. The media study indicates relatively liberal positions throughout the period, par-ticularly in 1999 (6.2).
The situation is much clearer for the CVP, where most methods come with similar esti-mates, and suggest little movement around the centre, perhaps slightly toward the more restrictive end. Manual coding and the retrospective survey both suggest a small but steady trend toward more restrictive positions, whereas the pooled expert surveys and the check-list do not indicate such a change. The Wordscores differ somewhat in that they indicate a shift toward more liberal positions over time. Not shown in figure 1 are the estimates from the media study that indicate relatively large changes from election to election, and the dictionary approach which suggests a very significant shift from rather restrictive positions to centrist/liberal ones between 1995 and 1999. After 1999 no significant changes are observed.
The Socialists pose an interesting challenge, since immigration is not treated in the party manifesto in 1995 and 2011. There are other documents in which the party takes a position on immigration, but for reasons of comparability, these were not coded. As with the other parties, the retrospective survey suggests a relatively stable pattern, albeit with a clear trend to less liberal positions after 2003. In contrast to the retrospective survey, both the pooled expert surveys and the manual coding suggest a shift to more liberal positions in 2003. Interestingly, the check-list suggests the opposite development – toward more liberal positions –, but it indicates less liberal positions overall. The dictionary approach equally suggests a trend toward more liberal positions between 1999 and 2007, although the
estimate for 1999 is centrist rather than liberal, with a position of 9.2. Similarly, the media study indicates a trend toward more liberal positions over the entire period. The estimates from Wordscores also suggest relatively liberal positions, but with just two data points there is no clear trend visible over time.
The Greens are an interesting case when it comes to immigration. On the one hand, all estimates agree that the Greens have a liberal position – with the exception of the dictio-nary approach that indicates large and inexplicable changes over time (including a position at the restrictive end in 1995: 17.9). On the other hand, there is significant spread in the estimated positions (from very liberal to rather centrist), and some methods suggest signifi-cant changes over time. As with the other parties, the retrospective survey suggests a stable position, in this case at the liberal end. The pooled expert surveys agree for the past three elections, but for 1999 and particularly 1995 suggests less liberal positions, namely 3.5 in 1995. Similarly, the check-list indicates relatively stable positions, albeit all somewhat less liberal. Here the difference to manual coding is noteworthy, because both rely on the same passages of the party manifestos. During the period covered, the Greens dedicated very lit-tle of their manifesto to immigration, which makes manifesto-based approaches invariably challenging. While the check-list approach suggests a relative stable development over time, the manual coding suggests a trend toward more restrictive positions, particularly in 2011, with an estimated position of 8.7. Wordscores, where available, are in line with the check-list, as are the estimates from the media study.
Combining the results presented in figure 1, it is striking to see that there are clear dif-ferences between the methods, although the long-term trends tend to be the same: the changes by the FDP and SVP are picked up by many methods in one form or another. More importantly, there is no apparent pattern in the differences between methods, with no clear bias for any of the methods presented. The persisting differences between meth-ods, however, suggest that relying on a single method may simply mask existing errors, particularly in the case of issue domains for which relevant sections in party manifestos can be short.
Methods by Party
Rather than looking at each party in turn, a different approach is to look at each method and see how parties are placed. As in the previous section, this allows to assess the face validity of the different approaches. The information is essentially the same as in the previ-ous section, but this presentation allows for a different assessment – and additional data are shown in the figure.
As visible in figure 2, the estimated party positions provided by the pooled expert sur-veys are relatively stable over time. Apparent is a shift toward more restrictive positions of the SVP. We also note that the positions of the FDP and CVP are very similar, a situation repeated for the GPS and SPS. This means that the pooled expert surveys distinguish three very different positions on immigration.
Compared to the expert surveys, the manual coding of party manifestos suggests much more change over time, notably for the FDP. For the SVP a shift toward more restrictive positions is outlined, but with more variation than what the expert surveys suggest. There is only limited information on the SPS, because immigration was not mentioned in the party manifesto in two of the years covered. For the years covered, their estimated position is similar to that of the Greens. In contrast to the expert surveys, the positions for the FDP and CVP are dissimilar when manually coding manifestos. For the FDP, a
clear shift toward more liberal positions is identified, whereas the position of the CVP is noticeably stable over time.
The check-list approach leads to estimates of relatively stable trajectories over time. The order or rank of parties is the same as in the pooled expert surveys – the SVP at the restrictive end, the FDP and CVP in the centre, and the SPS and GPS at the liberal end. By contrast, the positions derived from check-lists are less spread out: generally more
cen-Figure 2: Party Positions by Method.
Notes:The estimated party positions using different methods. Given are the positions for the years 1995 to 2011 of the SVP (two-dashed), FDP (long-dashed), CVP (dotted), SPS (solid) and GPS (dashed) respectively. The dif-ferent methods are pooled expert surveys, manual coding of party manifestos, the check-list approach, a retrospec-tive survey, Wordscores, and the dictionary approach. The y-axis gives the position on immigration on a scale from 0 (liberal) to 20 (restrictive).
trist positions are estimated. As in the expert surveys, for the SVP a shift toward more restrictive positions is outlined. The check-list approach also indicates a shift toward more liberal positions for the FDP, but a less significant one than the one suggested by the manual coding.
The retrospective survey suggests the most stable positions over time. It can be specu-lated that a retrospective assessment introduces biases that gloss over changes that actually took place (McDonald, Mendes, and Kim 2007). However, it is worth highlighting that the estimated positions are not entirely static. Like in the expert surveys, we find three dis-tinctive positions: the SVP at the restrictive end, the FDP and CVP in the centre– tending toward the restrictive –, and the SPS and GPS at the liberal end. The position of the FDP and the CVP seem indistinguishable. In contrast to the expert surveys, in the retrospective survey it is suggested that the positions of the SPS and GPS increasingly diverge: The posi-tion of the SPS is estimated to have recently become more centrist rather than liberal.
For the retrospective survey, standard deviations are available. Whilst they indicate significant disagreement over the exact position of parties– the range of possible positions is considerable – the three general positions (restrictive, centrist, liberal) are nonetheless clearly visible, and there is hardly any overlap between these positions. Standard deviations range from 0.7 to 5.1, with a median of 3.1. Interestingly, perhaps, the standard deviations are not uniform over time for all parties. For the SVP and CVP, the rate of agreement is largely constant over time. For the FDP, the positions in the past seem less certain than more recent ones. This is probably what we would expect from a retrospective survey (McDonald, Mendes, and Kim 2007). By contrast, for the SPS and GPS, there is surpris-ing agreement on their position in the past, particularly for the period 1991–1999. For more recent years, the exact position seems less clear. It might be that short-cuts are the reason for these low standard errors in earlier years, namely that (unconsciously) left–right positions are substituted for the position on immigration. More generally, however, the relatively high standard errors may be problematic for some applications, and the fact that standard errors are unevenly distributed over time can indicate problems of the method rather than diffuse party positions. While this corroborates scepticism with the ability of experts to place parties reliably in retrospective, there is more to retrospective assessments than the artificial stability of positions identified by McDonald et al. (2007).
Not included in figure 2 are the results from the media analysis. Despite relying on a small number of cases for most parties and election years, the general order of positions is in line with the pooled expert surveys and the manual coding of party manifestos. Accord-ing to the media analysis, at the liberal end, the positions of the GPS and SPS are relatively moderate compared to the estimates from other methods. In the centre, the positions of the FDP and CVP seem less stable, but this may largely be due to the small number of cases.
Because the manifestos from 2003 are used as reference texts, Wordscores provides a patchy picture: party positions are estimated for four election years. According to the Wordscores estimates, the position of the SVP at the restrictive end is relatively distinct from the other parties. An important difference to the pooled expert surveys or the check-list approach is that Wordscores suggest a trend toward more liberal position for the SVP. This defies common knowledge and expert positions. For most years the order or rank of parties matches the pooled expert surveys, but the three groups – restrictive, centrist, and liberal – are not readily identifiable. However, in absolute terms, the positions of the SPS and GPS are not as liberal as in the pooled expert surveys, for instance. For 2007, Word-scores suggest a rather centrist position for the SPS, and thus a slightly different order of party positions.
The picture of the automatic dictionary approach is unclear and not in line with the other methods. For all the parties, there are significant changes from year to year. Overall, the dictionary approach seems to suggest a trend toward more liberal positions, with the FDP being a possible exception. The similarity of positions for the SVP and the GPS defies common knowledge and expert positions. It might simply be that the dictionary approach is unsuited to pick up changes in the political debate on immigration over time.
Correlations between Methods
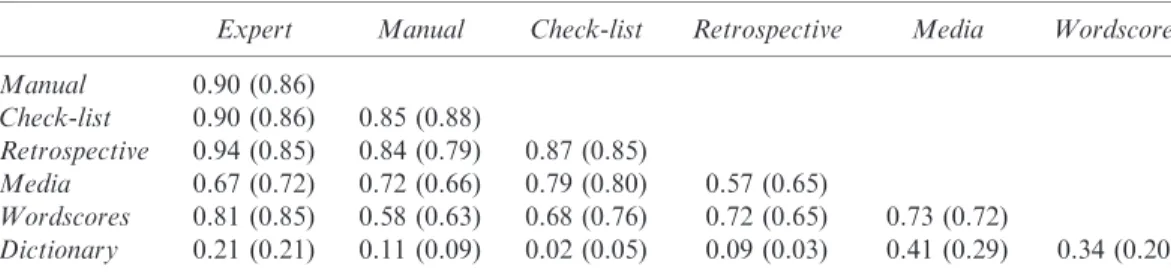
The correlations between the estimates derived using different methods constitute a test of correlational validity. They offer a more systematic approach than the considerations of face validity in the previous two sections. Both Pearson’s correlations (r) and Spearman rank correlations (q) are reported, catering for linear relationships and monotonous rela-tionships respectively. The importance of each coefficient to some degree depends on the research question, but as will be apparent, the same substantive results are obtained. As visible in table 1, for most methods the correlation coefficients are high (r > 0.70). Excep-tions are principally the correlaExcep-tions between the dictionary approach and all other meth-ods in the bottom row. Other exceptions are the correlations between manual coding and Wordscores, between the check-list approach and Wordscores, and between the media analysis and the retrospective assessment. These generally high correlations are a reflection of the fact that the different methods generally agree on the order of the party positions on immigration. The correlations for the automatic dictionary approach are generally lower, whereas correlations for Wordfish are not shown, ranging from 0.44 (q = 0.16) with Wordscores to 0.67 (q = 0.67) for the retrospective assessment. The correlation with the pooled expert surveys is 0.64 (q = 0.59).
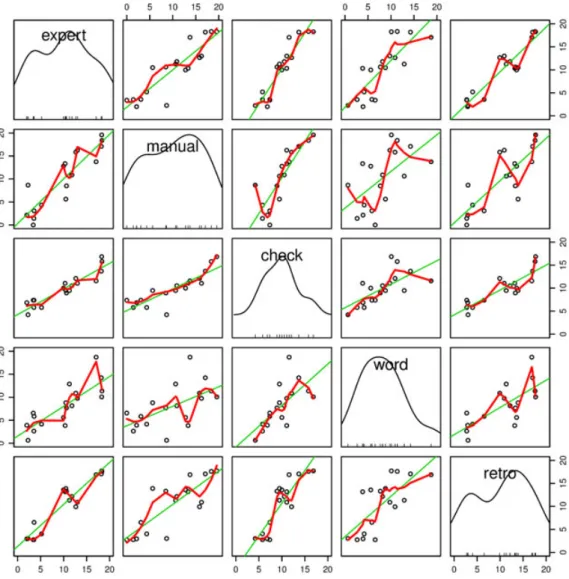
Figure 3 makes it visible that the high correlation coefficients outlined in table 1 are lar-gely driven by the differences between parties, and not by the relatively smaller differences of parties across time. This is apparent when considering the clusters of party positions for each party. In figure 3, greater differences to the green linear fit line indicate a poorer fit of parties over time. For each party, the average position tends to be close to the fit line, while some of the individual estimates in the cluster– referring to the different years stud-ied – differ to a somewhat larger extent. Indeed, the points within each cluster are not always parallel to the fit line.
The density plots included in the central box for each method (figure 3) are interesting in that they give us an indication how the different methods see the political space on the immigration domain. The pooled expert surveys suggest a bimodal distribution with two peaks in the centre and relatively strong tails: parties with clearly restrictive or liberal
Table 1: Correlations between Party Positions by Method
Expert Manual Check-list Retrospective Media Wordscores
Manual 0.90 (0.86) Check-list 0.90 (0.86) 0.85 (0.88) Retrospective 0.94 (0.85) 0.84 (0.79) 0.87 (0.85) Media 0.67 (0.72) 0.72 (0.66) 0.79 (0.80) 0.57 (0.65) Wordscores 0.81 (0.85) 0.58 (0.63) 0.68 (0.76) 0.72 (0.65) 0.73 (0.72) Dictionary 0.21 (0.21) 0.11 (0.09) 0.02 (0.05) 0.09 (0.03) 0.41 (0.29) 0.34 (0.20)
positions. This is largely mirrored by the retrospective assessment. The distribution identi-fied by the manual coding of manifestos tends toward bimodal: a peak at the centre– restrictive end, and a smaller one at the liberal end. The check-list approach is unimodal, and it is clearly more centrist than the expert surveys. Not shown in figure 3, the distribu-tion for the media study is bimodal, albeit with the higher peak at the liberal end, and a smaller peak at the restrictive end. Incidentally, the distribution of the automatic dictio-nary approach is almost identical. It could be speculated that the distribution in the media
Figure 3: Correlations between Party Positions by Method.
Notes:Scatterplot matrix showing the correlation between party positions obtained different methods. Shown are the pooled expert surveys, manual coding of party manifestos, the check-list approach, Wordscores, and a retro-spective survey. Included in green is the linear fit (straight line), as well as a loess smooth in red. The density dis-tribution of each method is included in the central boxes.
study reflects a liberal bias in the media, were it not for the results from Wordscores – which are based on party manifestos and hence unaffected by media representation. The distribution for Wordscores is unimodal, but very clearly skewed with many more posi-tions at the liberal end.
For Wordscores, I have tried different ways to use reference texts. As expected, the cor-relation between expert positions and Wordscores is somewhat higher where more manifes-tos were used as references. The correlation is higher when both 2003 and 2011 are used as references, for example, than when only 2003 is used as reference. More interestingly, noticeably higher correlations can be achieved when referencing all the parties in one year – as is done here – than referencing the two extreme parties (GPS, SVP) in each year. Put differently, the correlations are higher when a range of positions is referenced rather than just the extremes. Within this, more references lead to higher correlations – which can be understood as more accurate estimates.
The results in this section are less encouraging for the automatic dictionary approach than for the other approaches. The absence of significant correlations in table 1 is surpris-ing, given the extensive preparation of the dictionaries used. However, the situation is slightly different when we look at the correlations between methods for each year. Table 2 shows the correlations between estimates from the pooled expert surveys and a selection of other methods for each election year. When interpreting this table, it should be borne in mind that these correlation coefficients are based on five data points.
As expected from the results presented up to this point, the correlations in table 2 are generally high. There are two noteworthy differences. First, the correlation between the pooled expert surveys and manual coding is significantly lower in 2011 than in the other election years. This is caused by disagreement on the positions of the FDP and the SVP. Second, there is a relatively high correlation between the pooled expert surveys and the dictionary approach in 2003. This is the temporal context in which the dictionary was developed. The correlations for Wordfish are not shown in table 2, ranging from 0.19 (q = 0.4) to 0.83 (q = 0.6) with no apparent pattern.
Discussion
This research note asked whether different methods for obtaining party positions on immi-gration lead to similar estimates of party positions. More specifically, it examined whether party manifestos, retrospective assessments, and a limited media study can be used to
Table 2: Correlations with Expert Positions
1995 1999 2003 2007 2011
Expert—Manual 0.90 (0.8) 0.96 (1.0) 0.97 (0.9) 0.97 (0.9) 0.72 (0.4)
Expert—Check-list 0.92 (0.8) 0.96 (0.9) 0.84 (0.9) 0.95 (0.9) 0.99 (0.8)
Expert—Retrospective 0.98 (0.9) 0.99 (0.9) 0.97 (0.9) 0.96 (0.9) 0.96 (1.0)
Expert—Wordscores 0.97 (0.8) 0.92 (0.9) Ref. 0.92 (0.9) 0.88 (1.0)
Expert—Dictionary 0.19 ( 0.4) 0.45 (0.3) 0.83 (0.6) 0.21 (0.0) 0.08 ( 0.4)
Notes:Correlations between party positions obtained using different methods for each available elec-tion year. Wordscores are not included for 2003, because this year was used as reference, making a comparison meaningless in the context of this table. Correlation coefficients are based on 5 data points (one per party and election year). Spearman’s correlations in are shown in brackets.
reliably estimate the position of parties in Switzerland. For methods relying on party mani-festos – manual coding, check-lists, Wordscores, dictionary approach – this was tested using the German language manifestos from the largest five parties in Switzerland, cover-ing 1995 to 2011. Based on the successful application of different methods to left-right positions and other issue domains, it could be expected that all methods considered are able to obtain party positions on immigration. The highest levels of agreement can be expected between expert positions and manual coding of manifestos, two of the most widely used methods. There is some scepticism in the literature whether automatic approaches are valid, just like retrospective assessments are widely thought to be inade-quate.
With the exception of the dictionary approach, these expectations were generally sup-ported – as reflected by the relatively high correlations between estimates obtained using different methods. Of these, the high correlation between expert positions and manual cod-ing is important, since the poolcod-ing of expert data makes it less clear, whether expert data should be considered the benchmark. In the absence of expert data or for other reasons, manual coding party manifestos is often considered. The high correlations suggest that either approach seems warranted.
By contrast, over time, the different methods do not agree completely on the party positions. Put differently, while there is general agreement on the whereabouts of party positions on immigration, there is disagreement on the exact position. These differences, however, are not systematic, so that overall most of the methods considered lead to equally high correlations with expert positions. Notably Wordscores and the check-list approach can correlate as highly with expert positions than manual coding does. This is an important finding, because these methods use significantly fewer resources than manual coding, for example. The check-list approach offers an abridged approach to manually coding manifestos, whereas Wordscores offer a fully computerized approach. There are two drawbacks for Wordscores, however. First, reference texts are needed, which may reduce the number of parties or years for which party positions can be estimated. The way reference texts are chosen can have a significant impact on the estimated party positions. It appears that the choice of reference texts (which ones) is more important than the num-ber of reference texts. Whereas a higher numnum-ber of reference texts increases agreement with the pooled expert surveys, referencing a range of parties in a single year provided higher correlations than referencing just two parties for all years. This happens despite the smaller number of reference texts chosen when all parties in a year are used as reference texts. The second drawback is the inconsistent estimates of party positions in some instances. For instance, the positions of the SVP and CVP in 2007 and 2011 differ significantly from most other approaches – crucially suggesting a change where other methods point to stable positions.
For the retrospective survey of party positions, this research note suggests that the prob-lematic is more complicated that a simple underestimation of party dynamics outlined by McDonald et al. (2007). While the average positions in the retrospective survey are rela-tively stable, some changes in party positions are picked up in line with other methods, notably experts and manual coding of party manifestos. The large but inconsistent stan-dard errors suggest that retrospective assessments are also affected by other biases. Further research is necessary to understand the circumstances under which retrospective assess-ments provide adequate estimates, and under which they fail. Without understanding the biases and errors involved, it seems prudent to stay clear of retrospective assessments as a sole source of party positions.
For the party manifestos considered in this research note, I am unable to replicate Chen’s (2011) finding that using a dictionary approach leads to better estimates than using Wordscores, although it is unclear how exactly she used the dictionary. In this research note, I find that the automatic dictionary approach performs badly over time, although it was able to pick up party positions more reliably for the year in which temporal context the dictionary was developed.
By contrast, leaving aside issues of exact positions, it appears that Wordscores can lead to consistently high correlations with expert data. However, rather than seeing this as evi-dence for good performance, another, more troubling interpretation is that the Wordscores approach really picks up left-right positions, and not positions on immigration. Given that in Switzerland the two are largely reinforcing cleavages, this alternative explanation cannot be ruled out. Counter to this interpretation it can be highlighted that the Wordscores esti-mates reported in this research note are based on sections of the manifestos that are about immigration, which increases the likelihood that Wordscores actually provide positions on immigration rather than left–right positions. Further research using different issue domains is necessary to ascertain the performance of Wordscores.
A major issue facing all methods of obtaining party positions from political texts is that certain issues may simply not be treated. This is more of a problem for specific issues such as immigration than for generic concepts such as political left and right or social issues. Where an issue is not mentioned, manifesto-based approaches imply that no positions exist. In some cases, parties may choose not to mention their positions for electoral rea-sons– perhaps fearing that potential voters are alienated. In this case, expert positions will be clearly superior, since they will be able to assign party positions. In other cases, the party members may be divided, and the lack of position in a party manifesto may simply reflect this. In this case, assigning no position to a party may be more appropriate than using expert positions which may use left-right positions or other heuristics to make up lack of data. Finally, parties may simply have no position on an issue, particularly if the issue is not very salient in a specific year. In this case, too, assigning no position to the party seems more appropriate than deriving one by means of expectations or heuristics. The lack of coverage in manifestos is not just a hypothetical issue: There is no mention of immigration in the SPS manifestos in 1995 and 2011. Certainly for 2011 it can be ruled out that immigration was not mentioned for the lack of salience. Similarly, the passages on immigration included in the manifestos by the Greens tend to be short, which means less material to work with.
Conclusion
This research note compared different methods for obtaining party positions on immigra-tion in retrospective. The analyses covered the five largest Swiss parties 1995 to 2011. The party estimates from most of the methods considered correlate highly. Perhaps surpris-ingly, this included a retrospective survey, and a limited media study with a very small number of cases. For the retrospective assessment it can be speculated that this simply works because the positions of the parties did not change radically during the period stud-ied. Nonetheless, the results of the retrospective survey challenge received wisdom that post-hoc estimates of party positions are necessarily inaccurate. This would certainly be the case in the present study, where the respondents did not use any external evidence such as archival records. The relatively small changes identified in the retrospective survey may indeed reflect a problematic bias, namely that more importance is given to current
positions. Furthermore, the associated standard deviations point to significant biases that merit further research.
By contrast, the automatic dictionary approach performed unexpectedly poorly. The estimates derived with this method generally did not agree with the positions from other methods. The exception was the year in the context of which the dictionary was developed: Only for this election a relatively strong correlation could be observed with the pooled expert surveys. This suggests that the keyword-based dictionary approach may not be flexi-ble enough to adjust to changes in the debate on immigration over time, which may make the methods unattractive for retrospective assessments of some issue domains. For issue domains where the nature of the debate is stable, there is no reason to believe that the dictionary approach should not work. As with the other methods, longer time series would be needed to make better inferences, but the lack of expert surveys and access to party manifestos will prove very challenging.
Overall, the results suggest that immigration is similar to other issue domains such as left-right, namely that different methods for obtaining party positions provide similar esti-mates– suggesting correlational validity. In contrast to generic concepts, research on party positions on immigration relies on less data, and may face the challenge that manifestos do not mention the issue under study. I have discussed different possible causes for lack of coverage, and suggested that in some instances experts may actually make up for the lack of data by using heuristics even where assigning no position to a party may be the most appropriate step.
There is general agreement among the different methods on the party positions on immi-gration, distinguishing between liberal, centrist, and restrictive positions. For nuanced posi-tions, however, there is no agreement among methods. Indeed, no two methods agree consistently across time, which leaves us with the question whether there are really clear positions on immigration – or any specific issue domain. To some extent, this reflects the limited data that may be available on specific issues. A different way to look at this is by seeking methods that are able to express uncertainty– for example through standard devi-ations – but these may be difficult to attain in retrospective or are work-intensive. The findings in this research note suggest that the way party positions are measured for specific issue domains may affect reported findings if we are interested in small changes in position rather than general directions. This has also implications for research applications, such as research on political representation, where abstractly perceived distances between voters and parties may really be more fuzzy than often assumed and indeed simply indications of general proximities. Where exact positions may not exist, minimizing one’s distance to political parties becomes an inexact science. If we are comfortable with more fuzzy entities, however, the different methods generally indicate the same directions of positions, suggest-ing some degree of correlational validity.
Acknowledgements
The research leading to these results was carried out as part of the project SOM (Sup-port and Opposition to Migration). The project has received funding from the European Commission’s Seventh Framework Programme (FP7/2007-2013) under grant agreement number 225522. I would like to thank Laura Morales (Leicester), Georg Lutz (FORS), and Teresa Peintinger (Vienna) for comments. Laura Morales was heavily involved in designing a cross-national pilot study preceding the analysis of this article, and we are indebted to Ken Benoit (LSE) for his time and general advice on the matter. I would
like to thank Joanna Menet (Neuch^atel) and Silvia Sch€onenberger (Neuch^atel) for their support in coding manifestos. Replication data are available from http://hdl.handle. net/1902.1/19348.
References
Bakker, R., C. De Vries, E. Edwards, L. Hooghe, S. Jolly, G. Marks, J. Polk, J. Rovny, M. Steenbergen and M. Vachudova. 2012. ‘Measuring Party Positions in Europe: The Chapel Hill Expert Survey Trend File, 1999-2010’.
Behling, O. and K. Law 2000. Translating Questionnaires and Other Research Instruments: Problems and Solutions. London: Sage.
Benoit, K. and M. Laver 2006. Party Policy in Modern Democracies. London: Routledge.
—— 2007. ‘Estimating party policy positions: Comparing expert surveys and hand-coded content analysis’. Electoral Studies 26(1): 90–107.
Benoit, K. and M. Laver. 2008. ‘Compared to what? A comment on “A robust transformation procedure for interpreting political text” by Martin and Vanberg’. Political Analysis 16 (1): 101–111. —— 2009. ‘Treating words as data with error: Uncertainty in text statements of policy positions’.
American Journal of Political Science53(2): 495–513.
Berkhout, J. and L. Sudulich 2011. ‘Codebook for political claims analysis’. SOM Working Paper 2: 1–37.
Budge, I. 2000. ‘Expert Judgements of Party Policy Positions: Uses and Limitations in Political Research’. European Journal of Political Research 37 (1): 103–113.
Budge, I., H. Klingemann, A. Volkens, J. Bara and E. Tanenbaum 2001. Mapping Policy Preferences: Estimates for Parties, Electors, and Governments, 1945-1998. Oxford: Oxford University Press.
Carmines, E. and R. Zeller 1979. Reliability and Validity Assessment. Beverly Hills: Sage.
Chen, Y. 2011. ‘Quantitative content analysis of Chinese texts?: A methodological note’. Journal of Chinese Political Science16: 431–443.
Converse, P. and M. Traugott 1986. ‘Assessing the accuracy of polls and surveys’. Science 234(4780): 1094–1098.
D€aubler, T., K. Benoit, S. Mikhaylov and M. Laver. 2012. ‘Natural sentences as valid units for coded political texts’. British Journal of Political Science.
Davidov, E., P. Schmidt and J. Billiet 2010. Cross-Cultural Analysis: Methods and Applications. New York: Routledge.
Dolezal, M. 2012. ‘Analysing manifestos in their electoral content: A new approach with application to Austria 2002-2008’ presented at the Elections, Public Opinion and Parties (EPOP) Conference, September 7, Oxford.
EUI. 2009. ‘EU Profiler’. http://www.euprofiler.eu/.
Foddy, W. 1993. Constructing Questions for Interviews and Questionnaires: Theory and Practice in Social Research. Cambridge: Cambridge University Press.
Giger, N., J. M€uller and M. Debus 2011. ‘Die Bedeutung des regionalen Kontexts f€ur die programmatische Positionierung von Schweizer Kantonalparteien’. Swiss Political Science Review 17(3): 259–285.
Gudbrandsen, F. 2010. ‘Partisan Influence on Immigration: The Case of Norway’. Scandinavian Political Studies33(3): 248–270.
Harmel, R., K. Janda and A. Tan. 1995. ‘Substance vs. Packaging: An Empirical Analysis of Parties’ Issue Profiles’. In Annual Meeting of the American Political Science Association. http://www. janda.org/bio/parties/papers/Harmel%20et%20al,%201995.pdf.
Helbling, M. and A. Tresch. 2011. ‘Measuring party positions and issue salience from media coverage: Discussing and cross-validating new indicators’. Electoral Studies 30 (1): 174–183. HEP Verlag, and Politools. 2007. ‘Parteien Kompass’. http://www.parteienkompass.ch/.
Hooghe, L. 2005, Chapel Hill Data Sets on the Positioning of Political Parties. Chapel Hill: University of North Carolina.
—— 2010. ‘Reliability and validity of the 2002 and 2006 Chapel Hill expert surveys on party positioning’. European Journal of Political Research 49 (5): 687–703.
Klemmensen, R., S. Hobolt and M. Hansen 2007. ‘Estimating policy positions using political texts: An evaluation of the Wordscores approach’. Electoral Studies 26(4): 746–755.
Klingemann, H., A. Volkens, J. Bara, I. Budge and M. McDonald 2006. Mapping Policy Preferences II: Estimates for Parties, Electors, and Governments in Eastern Europe, European Union, and OECD 1990-2003. Oxford: Oxford University Press.
Kriesi, H., E. Grande, M. Dolezal, M. Helbling, D. H€oglinger, S. Hutter and B. W€uest. 2012.
Political Conflict in Western Europe. Cambridge: Cambridge University Press. http://www. cambridge.org/de/knowledge/isbn/item6796499/?site_locale=de_DE.
—— 2006. ‘Globalization and the transformation of the national political space: Six European countries compared’. European Journal of Political Research 45 (6): 921–956.
Ladner, A., D. Schwarz and J. Fivaz. 2009. ‘Die Schweizer Partien im politischen Raum - eine Analyse der politischen Positionen ihrer Kandidierenden bei den Nationalratswahlen 2007’. Working paper de l’IDHEAP 2009 (1).
Laver, M. and J. Garry 2000. ‘Estimating policy positions from political texts’. American Journal of Political Science44(3): 619–634.
Lowe, W. 2008. ‘Understanding Wordscores’. Political Analysis 16(4): 356. —— 2009. Yoshikoder. http://www.williamlowe.net/software/.
—— 2010. JFreq. http://www.williamlowe.net/software/. —— 2011. Austin. http://www.williamlowe.net/software/.
Lowe, W., K. Benoit, S. Mikhaylov and M. Laver (2011. ‘Scaling Policy Preferences From Coded Political Texts’. Legislative Studies Quarterly 36(1): 123–55.
Lubbers, M., M. Gijsberts and P. Scheepers. 2002. ‘Extreme right-wing voting in Western Europe’. European Journal of Political Research41 (3): 345–378.
Marks, G. 2007. ‘Introduction: Triangulation and the Square-root Law’. Electoral Studies 26 (1) (March): 1–10.
Marks, G., L. Hooghe, M. Steenbergen and R. Bakker. 2007. ‘Crossvalidating Data on Party Positioning on European Integration’. Electoral Studies 26 (1) (March): 23–38.
Martin, L. and G. Vanberg 2008. ‘A robust transformation procedure for interpreting political text’. Political Analysis16(1): 93.
McDonald, M., S. Mendes and M. Kim. 2007. ‘Cross-temporal and Cross-national Comparisons of Party Left-right Positions’. Electoral Studies 26 (1) (March): 62–75.
Netjes, C. and H. Binnema. 2007. ‘The Salience of the European Integration Issue: Three Data Sources Compared’. Electoral Studies 26 (1) (March): 39–49.
Pellikaan, H. and A. S. Walter. 2010. ‘New Cleavages in Western Europe: The Advantage of the Confrontational Approach’. In Workshop’ From Text to Political Positions’. Amsterdam. http:// www2.let.vu.nl/oz/cltl/t2 pp/docs/ws2010/papers/P2-Pellikaan.pdf.
Politools. 2011. ‘smartvote’. http://www.smartvote.ch.
Ray, L. 2007. ‘Validity of Measured Party Positions on European Integration: Assumptions, Approaches, and a Comparison of Alternative Measures’. Electoral Studies 26 (1) (March): 11–22. R Development Core Team. 2011. R: A Language and Environment for Statistical Computing.
Rooduijn, M. and T. Pauwels. 2011. ‘Measuring Populism: A Comparison of Two Methods of Content Analysis’. West European Politics 34 (6).
Sirken, M., D. Herrman, S. Schechter, N. Schwarz, T. Tanur and R. Tourangeau, eds. 1999. Cognition and Survey Research. New York: Wiley.
Slapin, J. and S. Proksch 2008. ‘A scaling model for estimating time-series party positions from texts’. American Journal of Political Science 52(3): 705–722.
Volkens, A., I. Budge, D. Robertson, D. Hearl and H. Klingemann 1995., Comparative Manifestos Project: Programmatic Profiles of Political Parties in Twenty Countries, 1945-1988 (CMPr3). Colchester: UK Data Archive.
Whitefield, S., M. Vachudova, M. Steenbergen, R. Rohrschneider, G. Marks, M. Loveless and L. Hooghe. 2007. ‘Do Expert Surveys Produce Consistent Estimates of Party Stances on European Integration? Comparing Expert Surveys in the Difficult Case of Central and Eastern Europe’. Electoral Studies26 (1) (March): 50–61.
Didier Ruedinis a researcher at the Swiss Forum for Migration and Population Studies (SFM) of the University of Neuchaˆtel. His research focuses on political representation, the politicization of immigration, and attitudes toward foreigners. Address for Correspondence: Swiss Forum for Migration and Population Studies, University of Neuch^atel, Fbg de l’H^opital 106, CH - 2000 Neuch^atel. Personal website: druedin.com E-mail: didier.ruedin@ wolfson.oxon.org