Published in "Research Evaluation" 20(1), 2011, 73–88
which should be cited to refer to this work
Profiles and beyond:
constructing consensus on measuring research
output in communication sciences
Carole Probst, Benedetto Lepori,
Daniela De Filippo and Diana Ingenhoff
EASURING RESEARCH output in social sciences and humanities (SSH) is a topic that receives increased attention, both from researchers and from policy makers (Nederhof, 2006). In these fields, where international journal publications do not account for the largest part of publication activity (Hicks, 2004), where besides output towards the scientific community scholars pursue other objectives and refer to a broader audi-ence, and where national visibility and transfer to society are also important, there is a general feeling that instruments for performance measurements need to be sensitive to disciplinary and national differ-ences and to take into account the diversity of
functions of research groups (Archambault et al, 2006).
In this context, the development of activity pro-files has been proposed as a suitable tool to take into account the multidimensional nature of research in these fields (Larédo and Mustar, 2000; Schmoch et
al, 2010). Profiles allow for more transparency, for
flexibility in the selection of criteria, and for consid-eration of more dimensions than international visi-bility. Thanks to these characteristics, profiles would also be more acceptable for the involved communi-ties and useful to nurture the debate concerning quality evaluation.
However, little attention has been devoted to the process of development of profiles and to its under-lying normative and social dimensions; like all S&T indicators, profiles are not purely technical devices, but socio-cognitive constructs which incorporate three main elements (Barré, 2004; Lepori et al, 2008):
1. They are a representation of reality that reflects the research team’s knowledge of the field, of theoretical models and previous empirical results. 2. They are a social construction reflecting
norma-tive choices on what research and its quality are,
as well as political interests, and are shaped through a complex social and political process. 3. They are an empirical instrument, which is
de-pending on available data, data-gathering proce-dures and analytical instruments, but also on the willingness of the involved actors to invest in the indicators production process.
The objective of this article — which is based on ongoing work in a research project funded by the Rector’s Conference of the Swiss Universities (CRUS) to develop measures of research output in the field of communication sciences — is to analyze how these dimensions unfold themselves in the pro-cess of construction of activity profiles and to show how this process can be managed in order to evolve from initial concepts towards a shared construction which is sound from a conceptual perspective, ac-cepted by the relevant actors and can be implement-ed with the available resources. Further, we investigate to what extent these requirements con-strain and limit the value of the produced profiles and how some limitations, such as the lack of focus on quality of research, could be overcome in a fur-ther step. The focus of the paper is thus on the meth-odological problems which emerged and on how consensus was achieved, by selectively using col-lected data as examples of these issues.
Building a project on a sound base: starting points
Considering the construction of profiles as a social ratherthanatechnicalprocessimpliesthatitsstarting pointislikelytoprofoundlyinfluencetheoutcomeof theprocess,aswellasitssuccess;someofthechoices madeintheinitialphasemightbedifficulttochange afterwardsand be soentrenched in the overall con-structionthattheresearchersthemselvesarenolonger awareoftheirinfluence.Hencecriticallyreflectingon initial project choices and their suitability is highly relevant for our purpose. These choices pertain to adopting a conceptual framework well-suited to the specificities of the field and which can be accepted by the actors, as well as to building a social and proceduralconstructiontomanagetheprocess.
The conceptual background: from rankings to profiles
There is no ‘one fits all’ indicator that allows meas-uring research performance in all fields of study, as they differ in terms of their internal organization, their way of producing, storing and communicating knowledge and their ways of interaction with the outside world (e.g. Whitley, 1984; Abbott, 2001; Becher and Trowler, 2001). The importance of con-textual differences is increasingly recognized also in large evaluation projects, for example in the British Research Assessment Exercise which evaluates
different fields of study with different procedures (AHRC and HEFCE, 2006; Royal Netherlands Academy of Arts and Sciences, 2006). For overcom-ing limitations of one-dimensional measures, differ-ent approaches aiming at the production of profiles of RUs have emerged.
Thus,consideringresearchasaprofessional activi-ty inserted in many different contexts, Larédo and Mustar(2000)proposelaboratoryactivityprofiles,an
approach whichhas beenoperationalizedbyAngers TechnopolefordescribingresearchintheAngers re-gion (Technopolis France – Angers Technopole, 2006).IntheNetherlands,a collaborationprojectof the major science policy organizations is currently developing and refining an evaluation method in a project entitled ‘Evaluating research in context’ (ERiCproject,see<www.eric-project.nl>).Basedon the fact‘that mostcurrent researchis produced ina complex socio-economic context inwhich demands aremadebyavarietyofsocialactors’(Spaapenetal,
2007),thisapproach startsfromthemission ofeach groupand createsa ‘ResearchEmbedmentand Per-formance Profile’, based ondifferent social dimen-sions to which the group contributes, and analyzes stakeholders’ perception of the group. Finally, the threecomponentsare broughttogetherfor compara-tive feedback.Morerecently, Schmoch et al(2010)
haveshownhowtheconceptofprofilescanbeusedto producemeasuresofresearchperformancewhichare sensible to different units’ strategic profiles.
The field of communication is a prime example of these issues, since it is characterized by diversity: different theoretical, conceptual and methodological approaches co-exist, and no agreement on a common basis of the field is identified (see e.g. Shepherd, 1999; Putnam, 2001). In the Swiss national context, the field is characterized by fragmentation in sub-communities following linguistic and/or disciplinary boundaries and with limited exchange between them (Lepori and Probst, 2009).
Thus, publication lists of researchers in the field show that communication occurs through a range of channels, regarding the type of media (i.e. book vs. journal publication), publication language and the-matic orientation. This implies that creating common benchmarks for evaluation is a challenge, as the dif-ferent publication channels are valued difdif-ferently between the sub-communities.
At the conceptual level, profiles promised to be a sufficiently flexible tool to address these variations and to avoid introducing too quickly norms of value; at the same time, the current discourse in Swiss SSH is characterized by resistance to rankings and hierar-chical orders and thus communicating the project as an instrument to value diversity and multifunctional-ity was critical for its acceptance.
The actors’ landscape and its implications
Indicators are social constructs which can nurture the discussion about factors that are not directly
measurable (Barré, 2004). In order to enhance their relevance and their acceptance within a field, im-portant actors are involved in the process of defini-tion of indicators (Butler, 2008). Our project is done in an actors’ constellation representing different interests.
The project is funded by the CRUS in the context of its programme on ‘measuring research perfor-mance’, from a common understanding that evaluat-ing research quality is important, but currently available instruments are not sufficient for SSH. The aim of CRUS is thus an instrument allowing higher education institutions and rectors to evaluate the quality of their research groups and to use this in-formation as a basis for strategic decisions.
The project is developed in a specific field, and hence needs the support of the community. The Swiss Association of Communication and Media Research (SGKM) participates in the project through an accompanying expert group in which the differ-ent universities, disciplinary sub-areas and linguistic regions and the association’s board are represented. There is a double interest for participation: it allows getting insights on the diversified field; but also the current trend towards more evaluation is recognized and this project is seen as a possibility of influencing future developments in this respect.
Also the project group is an actor with its own in-terests. Besides the interest for the topic and the con-struction of competence, there is also the aim of producing academic publications and of legitimizing as competent in the construction of indicators. The fact that the project team already did work in the field (Lepori and Probst, 2009; Leydesdorff and Probst, 2009) and that some of its members are themselves scholars in communication was helpful to understand the issue at stake, as well as to get ac-ceptance and social recognition. In addition, three external experts are involved, who have the role of ‘backup’ and legitimization.
This constellation entails one important challenge: there is no one clear principal of the project, but dif-ferent interests have to be brought together. Differ-ent ideas of profiles exist, and the individual actors attribute different values to the individual indicators and dimensions. Mediation becomes thus a critical task of the indicator specialist (Barré, 2004).
The process:
constructing and validating profiles
The instrument is constructed in a multi-level pro-cess. First, the project team has made a proposal for dimensions and corresponding indicators to analyze, which was submitted to the expert group and inter-national experts. Based on the feedback, a methodo-logical manual was constructed and tested in a pilot study. First, two research units (RUs) were analyzed; the manual was adapted and tested again with two other RUs. The methodological manual was revised
and again submitted to the expert group. Based on the feedback, the final instrument for the whole field was created.
Even though it was a smooth process, it led to im-portant changes in the initial proposal, based on the point of view of the scientific community, but also on such pragmatic reasons as the availability and quality of data.
Operationalizing the profiles step by step
For fields of SSH, the use of the concept of profiles has the advantage of being easily acceptable by the involved actors and therefore allows for a common language. Indeed, the basic concept was never con-tested. However, there has been some evolution in its application.
As a first step, the proposed dimensions were dis-cussed and slightly adapted, based also on inputs from international experts. The defined dimensions are:
Science; Students;
Industry and private sector;
Public/non-profit sector and general public; and Research training.
While the project team proposed including the media sector in an individual dimension, as there is much collaboration with this particular sector, the expert group did not see this as relevant and preferred to include collaboration with the media sector in the two categories of ‘industry and private sector’ and ‘public/non-profit sector and general public’, de-pending on the type of media organization. In addi-tion, geographical dimensions will be looked at separately.
For each dimension, the project team proposed several indicators, which were discussed with the expert group, tested in the pilot study and again val-idated with the group. Through this stepwise pro-cess, agreement on the instrument could be reached.
Table 1 shows the evolution of the ‘public/non-profit sector and general public’ dimension. This dimension, initially called ‘transfer to society, policy and public services’, saw quite a few developments
during the process. First, some general ideas of indi-cators were proposed (original list). Then, some in-dicators included in the ‘public debate and media’ dimension were transferred to this dimension, while some indicators were deleted either because of limited availability of data or because they were considered not relevant or included already in other indicators; others were added. Through the pilot study, several of the proposed indicators showed not feasible; the list was reduced to two core indicators (‘funds for research’ and ‘membership’) and three additional indicators.
Overall, the expert group has the role of reacting to the propositions made by the project team. Start-ing from concrete propositions allows makStart-ing the process manageable in terms of both contents and time. Therefore, the expert group mostly serves the purposes of legitimization of the proposed indicators and involvement of the community, facilitating thus the implementation process in the field.
The process was mainly driven by two concerns: feasibility and measurability — a central concern of the project group; and reaching consensus and ac-ceptance — a central concern for the accompanying group. However this approach entails a challenge: it is difficult to talk about topics on which no consen-sus exists inside the community, like how quality of research should be measured. The resulting indica-tors mostly measure volume of activities, but few of them can be mobilized to analyze quality of re-search, a shortcoming which we tried to address in a later stage of the project.
Issues of perimeter and normalization
Profile approaches look at the level of RUs/ departments/laboratories (Larédo and Mustar, 2000). There are, however, important challenges regarding this level of analysis: it is not necessarily easily identifiable, as the formal structure of higher educa-tion and research institueduca-tions differs and as, in some cases, a group forming a cognitive unit is not re-flected also in this structure. For analysing profiles of research groups, it is first necessary to have a clear definition of the level of analysis.
For our project, we define a research unit (RU) according to the following criteria:
An RU is recognized within the institution as a budgetary unit (this criterion is important for pragmatic reasons of data gathering);
An RU is visible to outsiders, there is a clearly identified representative, and it is also visible in strategic documents;
At least two members of the RU have a doctoral degree, at least one of them is a professor;
The members of the RU work on a common thematic area.
In practice, this definition proved to be applicable and the few ambiguous cases could be solved to-gether with the heads of the concerned unit. The drawback of this bottom-up process was that the sample contains very different units in terms of insti-tutional status, structure and size; the smallest unit is
Table 1. Example of an evolving dimension: public/non-profit sector and general public
Original list Added from media dimension Before pilot study Final manual
Applied research projects (e.g. NRP or CTI or direct contracts)
Third-party funds and
consultancy/expertise contracts
Funds for research from public and non-profit organizations
Direct consultancy or expertise → replaced by research
reports/presentations for public organizations Participation in commissions, committees, etc. Membership of boards, commissions Membership of commissions or boards of political and administrative authorities Contracts with politicians, NGOs,
public administration
Research reports Research reports Presentations for public
organizations
Media presence (newspapers,
radio, TV)
Contributions to daily and weekly newspapers, radio and television programmes
Media presence (newspapers)
Radio/TV –> skipped because not feasible
Participation in public debate → skipped/replaced by media
presence
Advanced vocational training → moved to training dimension
Transfer services → skipped because not feasible
Mobility of human resources and student exchange
→ skipped because not feasible Note: CTI = Swiss Innovation Agency contracts; NRP = National Research Programmes
a chair group composed of one professor and three PhD students (RU4; 2.35 full-time equivalent [FTE]), which is itself part of a research institute, while the largest one is an institute with more than 10 professors and senior researchers and about 15 PhD students (RU9; 11.4 FTE).
Another difficulty regards the perimeter of the unit. While it is not too difficult to identify RUs’ core members, challenges emerge when looking at the boundaries. Questions emerge mainly when there are researchers with part-time contracts, who also have (academic or non-academic) employment elsewhere.
This question is also related to the normalization of the indicators. As we look at RUs which may dif-fer considerably in their size, criteria for normaliza-tion have to be defined. Generally, we distinguish between two types of indicators:
Some indicators are directly related to the per-centage of employment of members of the unit — this includes, for example, teaching hours or third-party funds. These are normalized on the basis of FTE, considering basically all academic members of the RU.
Other indicators are related to the individual re-searchersandnottotheiremploymentcontract,for example,publicationsormembershipofboardsof organizations. Here, we includeonly those mem-bers who can be consideredashaving their main academicidentitywiththeRU:weincludeaperson if his/her employment at the considered unit ac-countsforatleast50%ofhis/hertotalengagement in academic contexts. There might beambiguous cases (e.g. somebody employed twice 50%) that have to be treated individually.
A definition of normalization for each individual in-dicator was also decided. For the publication indica-tor,itwasdecidedtousetheheadcountofprofessors, senior researchers and post-docs for normalization, excluding doctoral students. This is based on the as-sumption thatdoctoral students mostoftenpublishin collaboration with their supervisors or other senior researchers, and that researchers with a doctoral degreepublishactively.
To check the impact of different normalizations, for a subset of 14 RUs we compared the number of publications by using the chosen normalization, as well as a normalization by the total FTEs in the unit. The correlation between each of these set is very high (the correlation index being 0.91); when look-ing to rank the average change in the rank is 1.1 and the maximum changes in rank of individual units is 3. While we have good reasons for preferring one of these normalizations, for this indicator and for this set units changing the normalization would not significantly alter our results in terms of relative position of the considered units.
This shows that the availability of a complete dataset allows for fine-grained analysis regarding
statistical sensitivity and to understand to what extent the choice of normalization influences the results. Also, taking into account specific character-istics of individual units remains highly important especially when results are used for evaluation purposes.
Since there are continuously changes in staff of RUs, the issue of when staff are counted required attention, especially with small units where the leave of one single person could strongly influence the indicators. Since we are dealing with the current re-search profile of RUs — rather than with a retro-spective evaluation of performance — we include all staff active in the RU unit during the reference year (2009). Thus, we counted to the RU all publications in the reference timeframe (2005–2009) of currently employed staff, independently of their former affilia-tion. There are conceptual and practical reasons for this decision: first, if profiles are meant to support future strategies, they are based on the competences of currently employed staff; second, in a context where research reports including past publications are not available for most RUs, this is the only feasi-ble approach, as retrieving publication lists from staff who had left — and, overall, having complete staff lists from the past — would have been prob-lematic. Once again, methodological choices are related to the specific goals of the project and, thus, care has to be taken in using these data for other purposes.
Definition and measurement challenges
After defining dimensions and indicators, testing their implementation is crucial, since not all the in-dicators one could imagine can be constructed in a simple, unambiguous way. Here, we address some of the main challenges met through the pilot study. This process has confirmed that a key role of the project team is to deal with these issues and to make the expert group aware of potential pitfalls.
All indicators were discussed with the expert group, considering the criteria of validity, reliability, feasibility, transparency, fairness and independence. While validity and reliability depend a lot on the quality of the conceptual work, feasibility and trans-parency can be looked at only through concrete data collection. Fairness and independence, finally, are addressed when analysing the collected data and confronting the analyzed units with the results. In this project, we work with data that is collected directly in the field, from the involved actors. There-fore, questions of feasibility and transparency require particular attention.
‘Media presence’ is an interesting case of an indi-cator showing challenges. The initial idea was to ask the researchers to indicate their media presence. However, the pilot study showed that most research-ers (especially professors) do not keep track of it; the indicator is not feasible. However, even if they kept track of their presence, the question of transparency
would be important: is it possible to verify the re-ceived information? As a workaround, we tested the availability of this information in databases includ-ing newspaper publications (e.g. Lexis Nexis or
Fac-tiva). The pilot study showed that it is possible to
retrieve information on media presence in newspa-pers by searching these databases for the names of the researchers and RUs. For TV and radio presence, no such database exists. Therefore, it was decided that only presence in newspapers can be considered.
Another example regards two indicators in the dimension ‘science’. It was originally planned to include ‘invited speeches at scholarly conferences’ as an indicator. However, the pilot study showed that people interpreted this category in different ways. While some included only keynote speeches, others included all conference speeches they have done. As it is not possible to check which of these speeches were really done on invitation, it was de-cided to change the indicator to ‘keynote speeches’ — a category that can be checked, for example through conference programs. Similarly, we planned to include ‘membership of editorial boards of schol-arly journals’ as an indicator; the pilot study showed no agreement on the definition of an editorial board and no clear delimitation between editorial and advi-sory boards. Therefore, it was decided to change the indicator to ‘being an editor of a scholarly journal’, a more selective, but also clearer indicator.
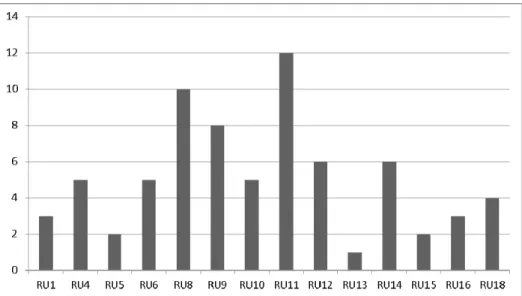
An issue is that some variables display low num-bers, the main example being those related to specif-ic academspecif-ic honours like members of editorial boards, best papers awards, keynote speeches. Most RUs in the data collection have no entries for these indicators (median = 0), while total numbers are very low. These data cannot be used as such for sta-tistical analysis, as results would not be robust; at the same time, these are very valuable since they identify positions of high standing in the academic community.
Two strategies have been devised:
1. Providing the raw data without normalization and then commenting qualitatively.
2. Adding the data in these categories and construct-ing a summary indicator, which can be considered sufficiently robust as no one of these variables clearly outweighs the others. As shown by Figure 1, this yields meaningful results for further analy-sis and the construction of profiles.
Developing tools and collecting data
The aim of this project is to develop a tool for data collection and analysis, which can be transferred to other fields of social sciences and humanities. Transparency and reproducibility of the used in-struments are central. Therefore, different instru-ments have been developed. First, a general document explaining the project was produced, for discussion with the expert group, in order to create a common basis on which to work. Then, a methodo-logical manual was developed, where the process is described step by step and each dimension is listed with its indicators. Once the expert group accepted this manual, the production of the data-gathering instruments started.
1. The RU is informed about the project and about what each individual should contribute.
2. A structured interview with the head of the re-search unit is conducted, based on a questionnaire addressing the declared profile and disciplinary orientation.
3. General information such as third-party funds or teaching involvement is gathered, either through the head of the RU or responsible administrative bodies.
4. All researchers are asked to provide their publica-tion list for the last five years (if available through
Figure 1. Academic awards by research units
Note: Sum of awards, best papers, keynote speeches, membership of journal editorial and advisory boards, membership of boards of scholarly associations
institutional databases). We standardize the information and send it back to the RU, asking for control and completion.
5. Finally, all researchers are asked to answer to an online questionnaire, through which we gather in-dividual information. In parallel, we gather infor-mation on media presence through databases covering newspapers, following defined guide-lines. The gathered data is brought together in a MS Access database, including queries for auto-matically producing the indicators.
For creating these instruments, the expert group and experiences from the pilot study are crucial. While the pilot study was used also for understand-ing the availability of data, and therefore worked with a rather large and to some extent open ques-tionnaire, the final instrument is more focused and standardized.
The choice of collecting data from the units them-selves presents advantages in terms of what can be collected — for example having full publications lists — but critically depends on the community’s participation. In this respect, to have an information session was shown to be a crucial element for smooth data-gathering period — in the pilot study, much more resistance was encountered in RUs where information on the project was given only through an email.
This dependency on the individuals’ and units’ collaboration has limitations: we receive only the information the individuals are willing to provide, and not all possible analyses can be done, as confi-dentiality issues have to be respected. Overall, cov-erage has been quite good, considering that it was a voluntary exercise: complete data are currently available for 14 of the 31 units in the field and we plan to reach 22–23 RUs including all large units, and thus providing a very good overview of the field in Switzerland. The main reason for not participating is that units are under evaluation or restructuring and thus fear that the project’s results might damage their position.
Three issues emerged which deserve further atten-tion. First, the burden for data collection was sub-stantial for participants and research group members. If the instrument is to be widely adopted, further
standardization will be required. The research team will have to identify which data are required and which are optional, with a focus on time-consuming data like individual publications and media presence. While developing a regular tool for yearly reporting seems to be overambitious — especially in a decen-tralized system like the Swiss one — we think it is realistic to derive a protocol for standardized data collection for the evaluation of scientific fields which can be adopted in many fields of SSH.
Second, combining data from different sources — interviews with RU heads, individual surveys, insti-tutional data, individual publication lists — proved to be helpful, but challenging in terms of data man-agement and integration, as in a number of cases differences between sources emerged (e.g. concern-ing staff). A second step in standardization will be to identify the most reliable data source for each item and to remove duplications, while at the same time keeping some redundancy for purposes of cross-checking.
Third, since most of the data are based on self-declarations, a thorough check of their reliability will be required. A first step in this direction will be to perform some sensitivity analysis to check which data are more critical for analytical purposes (e.g. given the small size of many RUs, deviations in staff data are likely to strongly influence the indicators). The development of a protocol for sample-testing is also envisaged for the last phase of the project. The feedback round with heads of RUs, confronting them with data and benchmarks, will be most helpful in this respect.
Producing profiles: aggregation, and benchmarks
To go from individual data to indicators and profiles, two basic methodological issues need to be ad-dressed, namely benchmarking and aggregation.
Benchmarking While numeric data are helpful, the
main interest is to analyze the position of an individ-ual RU with respect to the whole sample. This issue of benchmarking is not trivial, as different choices might yield diverging results; additionally, prelimi-nary testing shows that distributional characteristics of individual indicators are quite variable. Normaliz-ing against the maximum value is very sensible to outliers (difficult to detect with few observations); adopting the distance from the average (or median) is problematic when distributions are non-normal, while percentiles inform on relative position, but not on distance from the better units.
For indicators presenting a very skewed distribu-tion, no single benchmark provides complete infor-mation (see Figure 2). This is especially relevant when not displaying the whole distribution, but only the benchmark for a single unit, as in individual RU reports.
In our example, a unit with no stays abroad scores slightly below the median (score = −0.44 STDEV)
and significantly below the average (score = −0.90 STDEV), but with 0 on a scale from 0 to 1 from the best unit in the sample; at the same time, half of the whole sample has 0 value and thus this unit ranks 8th in the whole sample. These benchmarks tell dif-ferent parts of the story: the median that having no stays abroad is normal for RUs in the field — as half of them don’t have — the average that there is a sizeable number of units with stays abroad and the maximum that there is a very large distance from the best-performing unit. These choices also reflect the objective of the evaluation, comparing with the best unit in the field vs. looking at the position in respect to the average. Therefore, we have chosen to explain in detail these seemingly technical issues to the ex-pert group; the discussion showed a preference for presenting the different benchmarks together on the same figure.
Thus, in the RU reports we provide two bench-marks, the one based on median and the other on maximum, as well as information on the rank of the unit and we selected case by case the most sensible benchmark for the analysis.
Aggregation To build profiles, a weighting scheme
for indicators pertaining to a dimension is required. Two choices in this respect were proposed: first to normalize each indicator individually and then to attribute a weight to each of them or to choose a leading indicator, both for its significance and for its robustness. The discussion in the expert group
showed that the first alternative was clearly preferred, but at the same time it was requested to provide, alongside the global profiles, more specific profiles displaying for each dimension the position for each indicator individually.
The choice of the aggregation and weighting scheme was based on conceptual reasoning and practical issues of data robustness. Thus, for scien-tific production, we chose to aggregate the available indicators in three groups, one relative to funding, the second on academic honours and the third on the quantity of publication output (Table 2). Each indi-cator is first normalized individually on the size of the RU; benchmarks are then constructed by normal-izing on the median of the distribution each individ-ual indicator and then a composite indicator is constructed by weighting the three components.
As the individual components represent different dimensions of scientific production, it is not ex-pected that RUs will get the same scores for each of them, even if some level of correlation is expected. The choice of the weighting scheme is relevant to deciding the importance of the different components, as is the standing in the international scientific community (honours) vs. quantity of output. In our case, a test on a subsample of 13 units for which we have complete data shows that the two indicators on publications and academic honours are fairly corre-lated (correl = 0.57), while there is no correlation with public funding (correl = 0.15 with awards and −0.16 with number of publications). As shown by 0 1 2 3 4 5 6 7 8 0‐0.09 0.09‐0.19 0.2‐0.29 0.3‐0.39 0.4‐0.49
Figure 2. Number of stays of PhD students abroad
Notes: Data normalized on the number of PhD students
Average: 0.17; STDEV: 0.19; Median: 0.08
Table 2. Weighting scheme for the dimensions of scientific production
Components Indicators Normalization Weight
Funding for knowledge production
Funds for research obtained from SNF or other public funding agencies CHF
Normalized values per unit against the median of the sample
1/3
Academic honours Sum of best paper awards, scientific awards, keynote speeches, editors and members of boards of journals, membership in boards of scholarly associations, keynote speeches, journal special issues
Sum of the individual values per each RU, normalized against the median of the sample
1/3
Publication output Total number of publications (journal papers, book chapters, monographs, edited books)
Normalized values per unit against the median of the sample
1/3
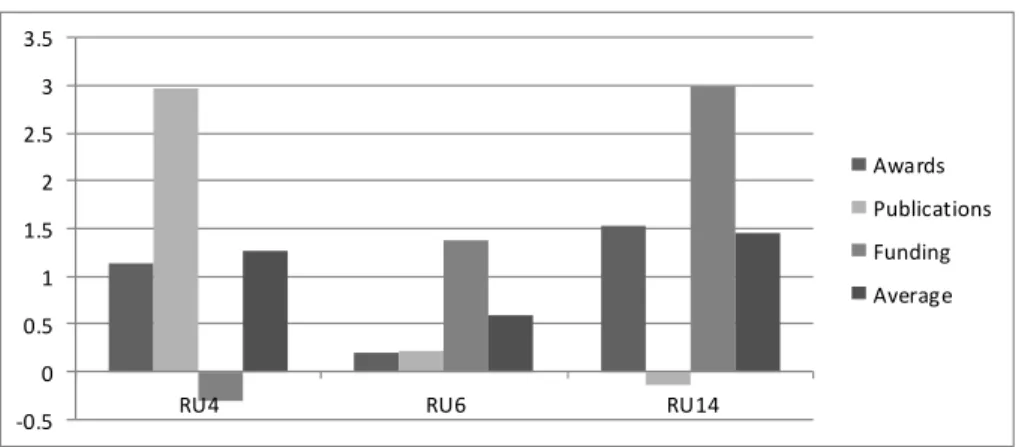
Figure 3, individual units strongly vary concerning the score in individual components. This displays that, while composite indicators are a useful tool to provide synthetic information on profiles, neverthe-less it remains important to analyze carefully indi-vidual components, since these provide much finer insights into individual activities of units; this is es-pecially relevant when analysing individual units — rather than providing statistics on the whole sample — and for small fields where it becomes difficult to identify average patterns.
We thus consider the construction of composite indicators as a promising strategy to overcome limi-tations of individual indicators in RU evaluation. This approach might benefit from statistical tech-niques to develop composite indicators as widely developed in other fields (Grupp and Mogee, 2004; OECD, 2008); at the same time, it is apparent that constructing composite indicators is eminently a value-assessing and political decision and thus re-quires the involvement of the actors themselves. Hence, developing tools that allow the construction of flexible benchmarks should be considered as a further priority (Bogetoft et al, 2007).
From infrastructure to analysis: use, context and quality
Once indicators have been constructed, there re-mains the question of their use and function. While the two processes are largely interdependent, de
facto the project focused more on indicators
con-struction in its first phase and on usage at a later stage. Usage raises also issues of contextualization — relating the produced numbers to their underlying reality — and quality, shifting from the measure of quantity to an evaluation of quality of research outputs.
Discussing usage
To discuss scenarios of use with the expert group is an important element of the process. Awareness of
different scenarios helps having discussions about constraints and limitations, and taking decisions on the selection of indicators to consider. However, this discussion should not be initiated too early in the process, as it requires that the expert group has some notion of the indicators which will be produced, un-derstands the issues at stake and trusts the project group concerning its competence and fairness.
Three uses are foreseen; while the underlying data are the same, customization of indicators and their presentation will take place.
Individual reports First, individual reports for each
RU are being produced. These include quantitative data on the unit itself, as well as the benchmarks, both on the overall profiles (aggregated by dimen-sion) and for individual dimensions and indicators. A discussion of the results is also provided, concern-ing specific characteristics explainconcern-ing the observed patterns. This product is considered as quite helpful for the RUs to understand their profile and position in the field, as an instrument for strategic decisions and positioning; it is largely unproblematic, as each unit will access only its own data. The discussion with heads of RUs on reports will also help to inter-pret observed patterns and to correct mistakes in the data. At a broader level, these reports could establish a standard contributing to some harmonization of self-reporting (e.g. for the purposes of evaluation exercises).
National-level report Second, a national-level
re-port will be produced, presenting the landscape of Swiss communication sciences by using aggregated data, but also individual-level data. This will be a helpful product both in scholarly terms — as there are few mapping exercises based on systematic data collection — and for the community itself, to get an overall picture of the field, as well as of the diversity of profiles and strategic orientations of the individu-al units; moreover, heads of RUs will be able to compare their position (as in the individual reports) to the overall landscape. The expert group welcomed this usage, but only if the individual names of the ‐0.5 0 0.5 1 1.5 2 2.5 3 3.5
RU4 RU6 RU14
Awards Publications Funding Average
Figure 3. Individual component of research unit composite indicator on scientific production
Notes: N = 13 units
Measuring research output in communication sciences
units are not visible, as it should not allow external stakeholders to compare the units themselves. Given the small scale of the field, this can be considered more as a political act not to endorse responsibility, as in reality it is likely that stakeholders will be able identify units individually even without their names.
University management Third, data could be used
by university management. The profiles could be integrated as an additional aspect in yearly reporting procedures, and therefore used as basic information for further evaluative purposes and as a part of a broader quality management system. However, in a decentralized system like Switzerland, this decision is left to the individual universities, which can be just informed of what has been done in the project. As the project has been mostly developed inside the scientific community, this is currently the least de-veloped use, also because the research team feared that promoting too quickly the use by university management could impair the acceptance of the instrument by the community itself.
Contextualizing profiles and looking for similar units
While much useful information can be gained from the analysis of individual indicators, a major focus of the project has been on producing profiles which allow identifying the main strategic orientations of the units and comparing them across the whole field. The analysis of these profiles will be a major focus
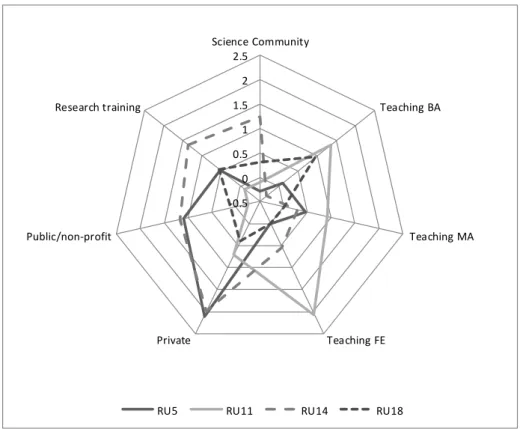
in the following of the project. Figure 4 shows four contrasting examples of profiles for four of the 14 units for which we currently have complete data.
RU5 is a medium-sized unit in corporate commu-nication in a strongly economic-oriented university which has traditionally very strong connections with private companies (this university has the largest share of private funding in Swiss universities). Both the overall strategic orientation of the field and the characteristics of the field converge to drive this unit to a strong focus towards transfer to public and private organizations.
RU11 is in the same field, but in a university which is more focused towards undergraduate edu-cation than to transfer. Hence, while the unit shares with RU5 lower indicators on the science dimension, its main focus lies in both undergraduate and post-graduate education, being the unit with the largest number of teaching hours and students in that university.
By contrast, RU14, which is in the same universi-ty but in a different field (technology-assisted educa-tion), displays a different profile, with a focus on research and on cooperation with public and private organizations, but far fewer teaching activities. This can be understood from the characteristics of the field, but also from the different history of the units, since RU11 is on one of the core domains for the curricula in the field of communication, while RU14 is a more focused field which emerged later on thanks to its research potential (actually RU14 is still named a ‘laboratory’ while RU11 is an ‘institute’).
‐0.5 0 0.5 1 1.5 2 2.5 Science Community Teaching BA Teaching MA Teaching FE Private Public/non‐profit Research training
RU5 RU11 RU14 RU18
Figure 4. Measured profiles of research units
Notes: Indicators normalized on size and then on the median of the whole sample (N = 14) Value 0 indicates the median of the sample, while 1 indicates that the unit has a score of 1 STDEV above the median
Internal differentiation of profiles can thus be generated by disciplinary differences and by the his-tory of units and can be an asset, allowing universi-ties to fulfil different functions; however, in a context where the university is emphasizing the re-search dimension, unit RU11 is currently under pressure to strengthen its research position.
Finally, RU18 is near to the average profile of the whole field of Swiss communication: it deals with one of the core subjects — mass communication — in a large university where pressure from increasing numbers of undergraduate students has been particu-larly strong. It thus reflects a traditional profile for social sciences in universities, matching a very large educational activity with a strong scientific dimension.
These examples display the value of constructing profiles for contrasting different orientations of units in a field which is highly diversified and where, clearly, no single unidimensional ranking would be suitable. Contextualizing these results is relevant for two reasons:
1. It shows that different factors explain these dif-ferences and that in the case of Swiss
com-munication sciences the characteristics and
strategic orientation of the university as a whole might be relevant, but differences between subfields are probably more important.
2. Contextualization shows that the produced profiles can be considered as reasonable by the involved actors, and differences in profiles can be explained mostly by real factors, rather than by artifacts of the chosen indicators and normal-ization techniques. This is an highly relevant step in the validation of the chosen methodology and in constructing standards in the production of unit’s profiles, in order to adopt the same methods at a larger scale and with reduced costs (where case-by-case contextualization to individual units might not be any more feasible).
Introducing strategic objectives and own representations
Profiles become even more interesting when adding the strategy dimension. In our project, we compare
the measured profiles with the declared strategy of the units themselves. Through the strategies, the units define their activities, roles and functions, and thus position and legitimate themselves also towards other actors (Schmoch et al, 2010).
Measuring strategies of RUs is challenging: for example, the declared strategy does not necessarily correspond to the effective strategy, and there might be differences between the unit’s strategy, the uni-versity’s strategy for this unit, and individual re-searchers’ strategies. To rely on official documents seems difficult, given their availability and compa-rability. Therefore, we collect information in inter-views with the heads of the RUs: the five dimensions are presented to the interviewees, and they are asked to indicate on a scale for 0 to 10: The actual situation of their unit in terms of time
and effort invested on the dimensions; and
The profile they aim for within the next five years.
This information can be used for different purpos-es. First, a comparison of declared current profiles shows that teaching at master level, research train-ing and science receive the highest scores, whereas transfer activities to the private sector are less rele-vant (Figure 5). This is reasonable as the current sample does not includeanyunits from universities of applied sciences. At the same time, specificities of individual units emerge rather clearly, like RU9 which is in the highly politically relevant field of health communication and thus where the public dimension is highly relevant, whereas RU15 dis-plays a specific orientation towards services, its main current task being the management of the university website. RU18 represents the typical strategic orientation of Swiss communication sci-ences in universities, with strong focus on educa-tion and on science, as well as a significant involvement with the public sector; we expect that, when including RUs from universities of applied sciences, some ofthem willdisplay a much strong-er orientation towards further education and the privatesector.
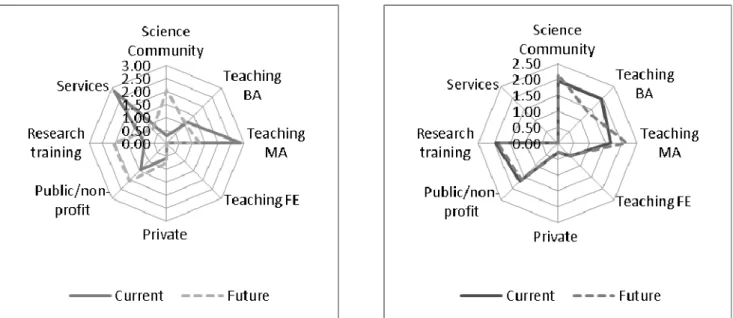
Second, differences between current and future profiles might identify future developments in the field and situations of dissatisfaction, where the pre-ferred profile cannot be realized in practice. On the whole sample, the differences are not very strong, but point to some shift from bachelor education to-wards continuing education, science and transfer (in communication sciences, the number of undergradu-ate students increased very strongly in the recent years). Individual priorities of units also emerge, as shown in the two examples in Figure 6. The first unit represents a dramatic case where a redirection of activities is envisaged: this unit is currently mostly focused on teaching and on services (managing the university website and offering a number of success-ful specialized masters), while its ambitions are to
refocus towards scientific research and education of doctoral students. The second unit represents, by contrast a case of evolutionary change: this unit has currently a profile which is typical for the field, with a strong orientation towards science, as well as to-wards undergraduate education; some refocusing however is envisaged from the bachelor level to the master level, a pattern which is common to many units in social sciences in Switzerland. By display-ing the current perceptions of heads on the unit’s position, as well as their future intention, strategic profiles can thus become a powerful tool to nurture the strategic discussion both in the field and inside the concerned institutions.
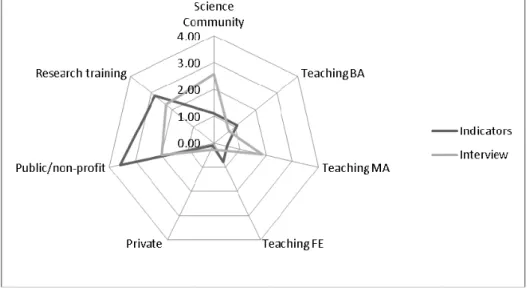
A further application is comparing declared and measured profiles. It is important to consider that these are two different constructs, based on different methods; neither can be considered as more objec-tive than the other.
The example in Figure 7 displays both similarities and differences between measured and declared profiles. Both indicate that educational activities are not very central in the current profile of the units and this largely matches qualitative information, as this is an unit strongly focused on research activities on a niche topic in communication and hence with a limited volume of education. However, the discrep-ancies are striking in dimensions ‘public’ and ‘scien-tific community’.
The RU is very active in projects for public and private organizations and it has very high incomes in terms of third-party funds from private and public sources. On the other hand, in order to manage these projects, it employs, besides doctoral students, sev-eral post-doc and senior researchers. A high number of senior researchers influences the indicators in the dimensions ‘scientific community’ and ‘research training’, as defined within the project: compared to
0 0.5 1 1.5 2 2.5 3 Science Community Teaching BA Teaching MA Teaching FE Private Public/non‐profit Research training Services RU9 RU15 RU18
Figure 5. Declared current profiles
Note: Selected units, normalized values (each unit is normalized on a scale of 10 points as the sum of all scores)
Figure 6. Comparison of current and future profiles for two units in the sample (left: RU15, right RU18)
other units, this group has less publications per senior researcher.
Two effects are taking place here. One is the impactofsize,sincethisisthelargestunitinthe sam-pleand,expectedly,thereisastrongnegative correla-tion between size and number of publications for researchersinthewholesample(correl=−0.58).the otheristheimpactofdifferentcompositionsofsenior staff since, in a field where most publications are madebyprofessors, havinga large number of post-docs implies a decrease in publications per senior staffmember.Infact,thisunitranks13over14onthe size-normalized indicatorforthesciencedimension, but ranks in position 3 for the non-size normalized indicator of academic awards and in position 5 for scientificpublications(andranksinposition2forthe numberofarticlesinscholarlyjournals).
The comparison between the declared and the measured is complementary and enhances the use of the results: it allows comparing self-perceptions with general benchmarks, and hence addressing more strategic and evaluative purposes, but it also allows more in-depth understanding of the meaning of dif-ferent benchmarks (e.g. size-normalized vs. volume indicators).
Making the numbers talk: the discussion about quality
In a context where clear values and norms exist, judgments about quality have a common basis. If the members of a scientific community agree that re-ceiving a high number of citations is a sign of quali-ty, indicators based on citation analysis are at hand. A shared definition of quality allows the use of simple and standardized indicators to measure it.
Where, as typically in SSH fields, no such agree-ment exists, and quality is perceived as a multi-layer concept, it is more difficult to make quality judg-ments on which a whole community, let alone its
external stakeholders (university management, fund-ing bodies, etc.), agree. The topic of measurfund-ing qual-ity emerged regularly in the accompanying group when talking about publication output. We tried to build definitions for classifying journals, as was proposed in the European Science Foundation’s ER-iH project1 (see also Butler’s [2008], initiative to define categories for conferences in the area of in-formation and communication technologies, another field of research to a large extent not covered by international databases). However, no consensus on the definitions of these categories could be reached: while for example some proposed to take the age of a journal as an indicator of quality, others from more dynamic and younger fields were against this proposition.
As consensus could not be reached, addressing directly the issue of measuring quality was not pos-sible, despite a broad agreement on its relevance. Two promising directions have however emerged: using profiles as an input for a more factual discus-sion on quality and developing multidimendiscus-sional indicators of international visibility.
Despite their focus on simple quantitative data, profiles do contain choices on what matters in RU activities: choices made through the selection of these dimensions and indicators, but also through the way of calculating the indicators and the profiles. Moreover, some of the indicators included in pro-files, like academic honours and publication activity of PhD students, can be interpreted as simple quality indicators.
These choices are made together with the com-munity; they do not impose a unique ranking, but allow looking at a selection of different aspects. Thus, to produce multidimensional profiles is a first step towards an instrument satisfying different needs, situated between the two extremes of rank-ings based on one or very few dimensions, and a purely qualitative assessment.
Figure 7. Declared and measured profiles
Notes: Declared profiles: data normalized on 10 points for each unit
Measured profiles: indicators normalized on the maximum unit on a scale of 10 and then normalized to 10 points for each unit
Of course, different users might look at profiles in different ways, and add their own, individual value judgments. For example, it could be imagined that the rector of a university compares the RUs of one department with another, focusing mainly on the dimension of research output, while a private com-pany searching might be more interested in the unit’s experience in collaboration with external part-ners. For this reason transparency in the construction of profiles and providing at the same time profiles and information on individual indicators is critical for their usage.
As thesevaluesdifferbetweenand withingroups of internal and external stakeholders, only a closer investigationofthemallowsaddingthequalityaspect totheprofiles,tounderlinethatqualitymeans differ-ent things in different settings. Thus, to allow the emergenceofscalesandvaluesseemsa natural, fur-therstepforthisproject,whichhoweverrequiresthat thesettinghastobechanged.Whilethediscussionon profilesanddimensionstobemeasuredwasdoneasa groupdiscussioninsidethecommunityitselfaimingat
consensus,inthisfurtherstepitisimportantthat dif-ferent ideas from difdif-ferent actors, based on difdif-ferent individual goals, can emerge freely.
So after a consensus-based building of profiles, in which individual values were leveled out, we envis-age coming back to the individual values of different stakeholder’s groups in order to integrate different definitions of quality in the construction of the pro-files themselves (e.g. through different weighting schemes, as has been developed in the literature on composite indicators: Grupp and Mogee, 2004; OECD, 2008). It is an open question to what extent this step will impact also on the data collection itself (e.g. requesting new data) and thus require a revision of the instruments developed in the project.
In a technocratic approach, this way of handling the process would appear inefficient, since it would be advised first to clarify the concept of quality and then to implement it in terms of indicators. Howev-er, if indicators are social constructions, in complex multi-actor settings the construction of consensus, the building of social ties and the design of the tech-nical instruments are closely interdependent and re-quire a sensible management of the process, where each step in the design of the instruments reshapes the cognitive and social space of the involved actors and thus might be open for solutions which would have not been possible in a previous stage. The dis-cussion of quality in some field of SSH is for us a prime example of a case where addressing it too directly might not be the most effective strategy.
Evaluating international visibility
A second extension towards a better evaluation of quality concerns developing multidimensional measures of international visibility. Namely, there was a broad consensus in the accompanying group that international visibility is a relevant criterion to
evaluate scientific output in communication scienc-es, even if divergent views were presented on how to measure it (e.g. whether to consider international-only publications in English or also those in German). Visibility is a relevant criterion, as most of the bibliometric literature considers it as measure of quality and hence uses indicators of visibility for this purpose; leaving this interpretation to the actors themselves was a step towards a more flexible and acceptable tool.
As is well known, measuring international visibil-ity is a challenge for fields of SSH, as bibliometric measures, which are usually used for this kind of analysis, show strong limitations and there is a need to take into account the different literatures in the field (Hicks, 2004; Nederhof, 2006). Once again, the solution we are currently proposing will involve a combination of different points of view, as it was clear that there was no consensus on a single measure of visibility, like the use of international English language databases, while the expert group could agree that a number of indicators are helpful to measure different dimensions of international visibility.
We therefore applied three different methods (see De Filippo et al, 2010).
1. Starting from the publication lists gathered in the project, we performed an analysis regarding the composition of output types, by computing the percentage of scholarly outputs (journal articles and books), as well as the share of journal articles and of publications in English.
2. We are developing a classification of journals as international, national and professional, based on a set of objective criteria, like the composition of editorial board, authorship, language of publica-tion; this will allow objectivity in the discussion in the accompanying group.
3. We searched Google Scholar for all the entries of the publication lists, both for indexing and citations; availability of publications lists is criti-cal here to avoid problems of identification since it could enable searches for both authors and publication titles.
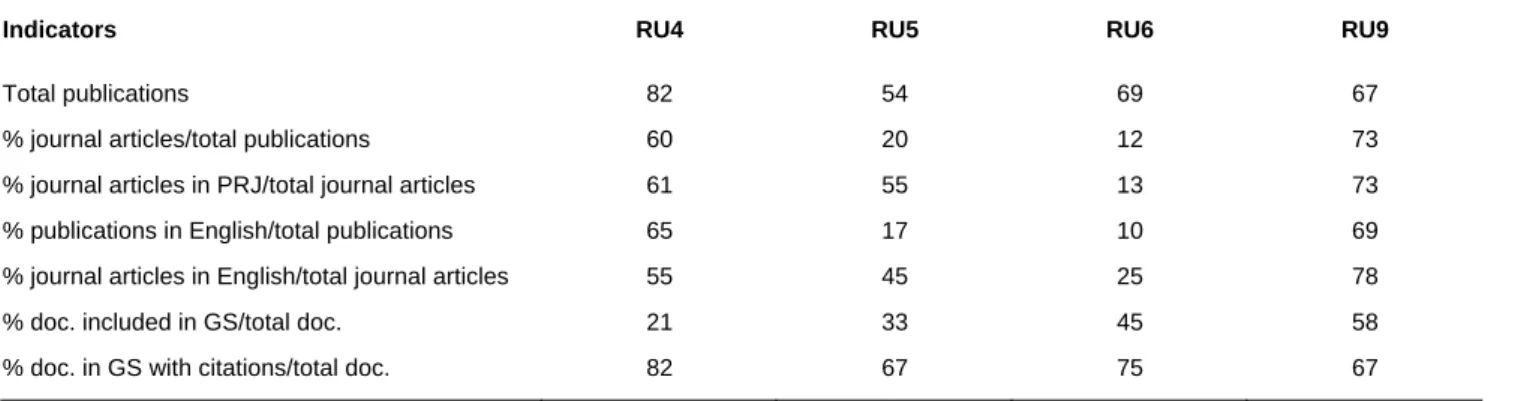
Table 3 shows some data for a subset of units. Even if this is still some very preliminary work, there are a number of useful methodological remarks which are at place here.
First, the data display the profound differences in the publication profiles in the field, which make it impossible to use a single indicator on international visibility. Thus, RU4 and RU9 (respectively in cor-porate communication and health communication) use English journals as the main medium of publica-tions, while RU5 and RU6 (in cultural studies and corporate identity respectively) have a strong orien-tation towards books and book chapters in German as the main medium of publication. In Swiss com-munication there are thus two contextual factors
impacting on publication profiles, namely the specif-ic subfields where the unit is active and, of course, the language of the university where RUs belong. Once complete data are available, it will be possible to analyze these differences more systematically.
Second, data from Google Scholar show that these publications do have their own visibility, even if it is difficult to ascertain where visibility comes from as there is no detailed documentation on the publication perimeter in Google Scholar. Thus, while in this field, international English databases like Web of Science and Scopus cannot be used as the relevant publication media are not covered (Lauf, 2005; De Filippo et al, 2010), other databases might be useful, even if careful work is required to better understand the relevant audiences. We notice that having com-plete publication lists from the units themselves helps to solve many of the attribution problems related to the use of these databases.
Third,this workshows thatthe conceptof multi-dimensionalpublication profiles canbea useful ap-proachtotakeintoaccountdifferencesinsideafield andtoleavetotheactorsthemselvesthejudgmenton whichdimensionofpublicationoutput andvisibility is more important. This is highly relevant as corre-sponding values and strategic choices are different betweenfields,butalsobetweenindividual universi-ties, and thus providing a single indicator of inter-national feasibility will not allow this diversity to display.
Conclusions and perspectives
So far, the project has shown that the concept of pro-file is a useful basis for developing instruments for measuring or evaluating activities of researchers in fields of SSH, as it allows consideration of the varie-ty of these activities and does not entail a pre-judgment on the value of different activities. We anticipate that it would also be a useful concept for other fields, beyond SSH, and that an analysis of the profiles of RUs in these fields, considering activities that go beyond what is usually measured through publications and patents, would lead to a more complete picture of academic activity.
However, while some aspects might be common to different fields, it is necessary to consider the specificities of each field individually in the construction of the profiles, and particularly also in the process of building value judgments. This is also important in order to enhance the acceptance of the instrument within the community. Through the in-volvement of representatives from the field, the instrument is co-constructed with the community and therefore also belongs to the community. Co-construction is also essential in methodological terms, since there are no general answers to method-ological issues concerning dimensions, indicators and normalizations, but these have to be closely re-lated to their underlying context and the value choices of the involved actors. We thus consider that when producing indicators one should be very care-ful in seeking a balance between generality — which is relevant in terms of comparability and standardi-zation — and customistandardi-zation to the local contexts.
Moreover, this process of constructing indicators also has a positive effect on the field, particularly in young or interdisciplinary fields: it constrains schol-ars in the field to discuss the field’s identity, not in terms of its cognitive nucleus, but regarding its way of producing, discussing, storing and divulging knowledge. What contribution does a field and do RUs active in this field give to its different stake-holders, at what geographical level? Constructing indicators supports processes of identification and positioning. The process of construction of the indi-cators as well as the data-gathering processes are as important as the indicators themselves, as they raise
Table 3. Selected indicators on publications and international visibility
Indicators RU4 RU5 RU6 RU9
Total publications 82 54 69 67
% journal articles/total publications 60 20 12 73
% journal articles in PRJ/total journal articles 61 55 13 73
% publications in English/total publications 65 17 10 69
% journal articles in English/total journal articles 55 45 25 78
% doc. included in GS/total doc. 21 33 45 58
% doc. in GS with citations/total doc. 82 67 75 67
Of course, this process is also risky since the so-cial construction of indicators might not reflect what the indicators specialist itself would consider reflect-ing the state of the art in the field and its own nor-mative assumptions; our experience shows that there is a delicate balance between pushing the expert group in a direction — for example, raising the issue of quality — setting limits to actors’ judgments — for example, on measures which are incorrect — and getting subscription to and participation in the pro-cess. This is a highly political process where tech-nical competence and authority relationships need to be mobilized, but also where a sensible management of the process and of personal relationships is of prime importance. The construction of indicators is no place for those searching for the truth, but a good one for those wishing to seriously help shaping future political decisions.
awareness for the identity/identities within the field. In such a process, benchmarks are set within the field, on which the community agrees.
In this process, the role of the indicators special-ists, as members of the project team, is crucial. On the one hand, through their competence they guaran-tee the methodological quality of the produced in-strument, profile and indicators. On the other hand, however, this role is also a social role: the indicator specialist acts as a mediator who manages the pro-cesses of negotiation between the representatives from the field (see also Barré, 2004), by pragmati-cally helping to find an acceptable consensus, by recalling what is possible and what is not and point-ing to the implications of specific decisions. There-fore, the indicators specialist enables the co-construction of meaning and the co-construction of an instrument which is shared by the community. Acknowledgments
The authors would like to thank the Swiss Society of Communica-tion and Media Science for its participaCommunica-tion in the project, as well as the Rector’s Conference of Swiss Universities and the Univer-sities of Fribourg and Lugano for financial support. They wish further to thank the other project participants: Désirée Donzallaz and Ingrid Howe (Evaluation Service of the University of Fribourg), Alexandra Bähni (University of Fribourg), as well as three external project advisors (Robert Tijssen , Philippe Larédo-and Peter van den Besselaar) Larédo-and two anonymous reviewers for helpful comments.
Note
1. <http://www.esf.org/research-areas/humanities/erih-european-reference-index-for-the-humanities.html>, last accessed 2 November 2010.
References
Abbott, A 2001. Chaos of Disciplines. Chicago/London: University
of Chicago Press.
AHRC, Arts and Humanities Research Council and HEFCE, Higher Education Funding Council for England 2006. Use of
Research Metrics in the Arts and Humanities. Report of the
Expert Group set up jointly by the AHRC and the HEFCE. Archambault, E, E Vignola-Gagné, G Côté, V Larivière and
Y Gingras 2006. Benchmarking scientific output in the social sciences and humanities: the limits of existing databases. Scientometrics, 68(3): 329–342.
Barré, R 2004. S&T indicators for policy making in a changing science-society relationship. In Handbook of Quantitative
Sci-ence and Technology Research, eds H F Moed, W Glänzel
and U Schmoch, pp. 115–132. Dordrecht: Kluwer Academic Publishers.
Becher, T and P R Trowler 2001. Academic Tribes and
Territo-ries. Intellectual Enquiry and the Culture of Disciplines.
Ballmoor, Buckingham / Philadelphia, PA: The Society for Re-search into Higher Education and Open University Press. Bogetoft, P, H O Fried, and P vanden Eeckaut, 2007. The
univer-sity benchmarker: an interactive computer approach. In Uni-versities and Strategic Knowledge Creation: Specialization and Performance in Europe, eds A Bonaccorsi and C Daraio,
pp. 443–462. Bodmin, Cornwall: MPG Books.
Butler, L 2008. ICT assessment: moving beyond journal outputs.
Scientometrics, 74(1), 39–55.
De Filippo, D, C Probst and B Lepori 2010. Characterization and
International Visibility of Research Outputs in Communication Sciences: Case of Study of 4 Swiss University Units. Paper
presented at the STI Indicators conference, Leiden, Septem-ber 2010.
Grupp, H and M E Mogee 2004. Indicators for national science and policy: how robust are composite indicators? Research
Policy, 33, 1373–1384.
Hicks, D 2004. The four literatures of social science. In Handbook
of Quantitative Science and Technology Research, eds H F
Moed, W Glänzel and U Schmoch, pp. 473–496. Dordrecht: Kluwer Academic Publishers.
Larédo, P and P Mustar 2000. Laboratory activity profiles: an exploratory approach. Scientometrics, 47(3), 515–539.
Lauf, E 2005. National diversity of major international journals in the field of communication. Journal of Communication, 55(1),
139–151.
Lepori, B and C Probst 2009. Using curricula vitae for mapping scientific fields. a small-scale experience for Swiss comm-unication sciences. Research Evaluation, 18(2), June,
125–134.
Lepori, B, R Barré and G Filliatreau 2008. New perspectives and challenges for the design and production of S&T indicators.
Research Evaluation, 17(1), March, 33–44.
Leydesdorff, L and C Probst 2009. The delineation of an interdis-ciplinary specialty in terms of a journal set: the case of com-munication studies. Journal of the American Society for Information Science and Technology, 60(8), 1709–1718.
Nederhof, A J 2006. Bibliometric monitoring of research perfor-mance in the social sciences and the humanities: a review.
Scientometrics, 66(1), 81–100.
OECD 2008. Handbook on Constructing Composite Indicators: Methodology and User Guide. Paris: OECD.
Putnam, L L 2001. Shifting voices, oppositional discourse, and new visions for communication. Journal of Communication,
51(1), 38–51.
Royal Netherlands Academy of Arts and Sciences 2006. Judging
Research on its Merits. An Advisory Report by the Council for
the Humanities and the Social Sciences Council, Amsterdam. Schmoch, U, T Schubert, D Jansen, R Heidler and R von Görtz
2010. How to use indicators to measure scientific perfor-mance: a balanced approach. Research Evaluation, 19(1),
March, 2–18.
Shepherd, G J 1999. Advances in communication theory: a critical review. Journal of Communication, 49(3), 156–164.
Spaapen, J, H Dijstelbloem and F Wamelink 2007. Evaluating research in context: a method for comprehensive assessment.
The Hague: Consultative Committee of Sector Councils for Research and Development, the Netherlands.
Technopolis France – Angers Technopole. 2006. Observatoire de la Recherche Angevine – Synthèse de l'Édition 2006.
Whitley, R 1984. The Intellectual and Social Organization of the Sciences. Oxford: Clarendon Press.