Publisher’s version / Version de l'éditeur:
Vous avez des questions? Nous pouvons vous aider. Pour communiquer directement avec un auteur, consultez la première page de la revue dans laquelle son article a été publié afin de trouver ses coordonnées. Si vous n’arrivez pas à les repérer, communiquez avec nous à PublicationsArchive-ArchivesPublications@nrc-cnrc.gc.ca.
Questions? Contact the NRC Publications Archive team at
PublicationsArchive-ArchivesPublications@nrc-cnrc.gc.ca. If you wish to email the authors directly, please see the first page of the publication for their contact information.
https://publications-cnrc.canada.ca/fra/droits
L’accès à ce site Web et l’utilisation de son contenu sont assujettis aux conditions présentées dans le site LISEZ CES CONDITIONS ATTENTIVEMENT AVANT D’UTILISER CE SITE WEB.
4th International Conference on Decision Making in Urban and Civil Engineering
[Proceedings], pp. 1-11, 2004-10-01
READ THESE TERMS AND CONDITIONS CAREFULLY BEFORE USING THIS WEBSITE.
https://nrc-publications.canada.ca/eng/copyright
NRC Publications Archive Record / Notice des Archives des publications du CNRC :
https://nrc-publications.canada.ca/eng/view/object/?id=ddf145af-454f-4ae1-9fba-1b338ca9e3e0 https://publications-cnrc.canada.ca/fra/voir/objet/?id=ddf145af-454f-4ae1-9fba-1b338ca9e3e0
Archives des publications du CNRC
This publication could be one of several versions: author’s original, accepted manuscript or the publisher’s version. / La version de cette publication peut être l’une des suivantes : la version prépublication de l’auteur, la version acceptée du manuscrit ou la version de l’éditeur.
Access and use of this website and the material on it are subject to the Terms and Conditions set forth at
Management of failure risk in large-diameter buried pipes using
fuzzy-based techniques
Management of failure risk in large-diameter buried
pipes using fuzzy-based techniques
Kleiner, Y.; Rajani, B.B.; Sadiq, R.
NRCC-47329
A version of this document is published in / Une version de ce document se trouve dans :
4
thInternational Conference on Decision Making in Urban and Civil Engineering,
Porto, Portugal, Oct. 28-30, 2004, pp. 1-11
Management of failure risk in large-diameter buried pipes
using fuzzy-based techniques
Y. Kleiner
1, B.B. Rajani
2and R. Sadiq
3Institute for Research in Construction, National Research Council Canada
1yehuda.kleiner@nrc-cnrc.gc.ca, 2 balvant.rajani@nrc-cnrc.gc.ca , 3 rehan.sadiq@nrc-cnrc.gc.ca
Abstract
Effective management of failure risk of large-diameter water mains requires knowledge of their current condition, their rate of deterioration, the expected consequences of failure and the owner’s risk tolerance. By far the greatest obstacle to formulating an effective strategy is the lack of sufficient historical data on the deterioration of these buried pipes. The National Research Council of Canada (NRC), with the support of the American Water Works Association Research Foundation (AwwaRF) is developing a new approach, which is largely based on fuzzy-based techniques.
Fuzzy-based techniques seem to be particularly suited to modeling the deterioration of buried infrastructure assets, for which data are scarce, cause-effect knowledge is imprecise and observations and criteria are often expressed in vague (linguistic) terms (e.g., ‘good’, ‘fair’ ‘poor’ condition, etc.). The use of fuzzy sets and fuzzy-based techniques helps to incorporate the inherent imprecision, uncertainty and subjectivity of available data, as well as to propagate these attributes throughout the model, yielding more realistic results.
Earlier publications, reporting on the same research effort, introduced two new concepts: (a) modeling the deterioration of a buried pipe as a fuzzy Markov process, and (b) combining the possibility of failure with the fuzzy consequences to obtain fuzzy risk of failure throughout the life of the pipe. In this paper a method is presented to use the fuzzy deterioration model and the fuzzy risk for the effective management of failure risk. These decisions include when to renew a deteriorated pipe, or alternatively, when to schedule the next inspection and condition assessment, and if renewal is required, what renewal alternative should be selected.
Keywords
Large-diameter pipes; deterioration; fuzzy Markov; risk; decision-making.
1 Introduction
Low rate of failure, combined with the high cost of inspection and condition assessment, are the main reasons why there is a dearth of historical data on the condition of large-diameter buried pipes. The risk needs to be evaluated and managed as the failure of such pipes can have disastrous consequences. Managing this failure risk requires a deterioration model that enables the forecast of the asset condition as well as the ‘possibility’ of failure in the future. However, the historical data that are required to understand and model this deterioration are scarce.
The modeling of infrastructure deterioration has received much attention in the last two decades. The Markov deterioration process (MDP) is one approach that has gained prominence as exemplified by Madanat et al. (1997), Wirahadikusumah et al.
(2001), Mishalani and Madanat (2002), Kleiner (2001) and others. Examples of other types of statistical models include those proposed by Lu and Madanat (1994), Ramia and Ali (1997), Flourentzou et al. (1999), Ariaratnam et al. (2001) and others.
In recent years, the application of soft computing methods to assess infrastructure deterioration has gained popularity. Soft computing methods include techniques such as artificial neural network, genetic algorithms, belief networks, fuzzy sets and fuzzy-based techniques. Fuzzy-fuzzy-based techniques seem to be particularly suited to modeling the deterioration of infrastructure assets for which data are scarce and cause-effect knowledge is imprecise. Some examples from the literature of applications of these techniques to infrastructure systems include: Chao and Cheng (1998) used a fuzzy-based pattern recognition model to diagnose cracks in reinforced concrete structures; Liang et al. (2001) developed a multiple-layer fuzzy method for concrete bridge health monitoring; Sadiq et al. (2004) employed a fuzzy-based technique to determine soil corrosivity as a surrogate measure for breakage/corrosion rate in cast iron pipes. The Markovian deterioration process requires that the condition of the deteriorating system be encoded as an ordinal condition state. The condition assessment of a large buried pipe comprises two steps. The first step involves inspection of the pipe using direct observation (visual, video) and/or non-destructive evaluation (NDE) techniques (radar, sonar, ultrasound, sound emissions, eddy currents, etc.), which reveal distress indicators. The second step involves interpretation of these distress indicators to determine the condition state of the pipe. This interpretation process is dependent upon the inspection technique. The interpretation of the visual inspection results, although based on strict guidelines, can often be influenced by subjective judgment. The interpretation of NDE results on the other hand, is often complex (at times proprietary) and imprecise. Fuzzy-based techniques seem therefore uniquely suited to addressing this encoding process as well.
Kleiner et al. (2004a) introduced a new approach to modeling the deterioration of buried pipes, using a fuzzy rule-based, non-homogeneous Markov process. This deterioration model yields the possibility (as opposed to probability) of failure at every point along the life of the pipe. Kleiner et al. (2004b) expanded this approach by expressing the possibility of failure, as a fuzzy number, and then coupled it with the failure consequence (also expressed as a fuzzy number) to obtain the failure risk as a function of pipe age. In this paper the approach is expanded further, to include methods to assess post-renewal deterioration rate and subsequently make rational decisions on when to schedule the subsequent condition assessment of a pipe, when to renew a deteriorated pipe, and how to select the most economical renewal alternative, assuming it is technically feasible and appropriate.
2
Fuzzy sets and the fuzzy rule-based algorithm
A fuzzy set describes the relationship between an uncertain quantity x and a membership function µ, which ranges between 0 and 1. A fuzzy set is an extension of the traditional set theory (in which x is either a member of set A or not) in that an x can be a member of set A with a certain degree of membership µ. Fuzzy techniques help address deficiencies inherent in binary logic and are useful for propagating uncertainties through models. Several textbooks on fuzzy sets, e.g., Dubois and Prade (1985), are available that describe the techniques in detail.
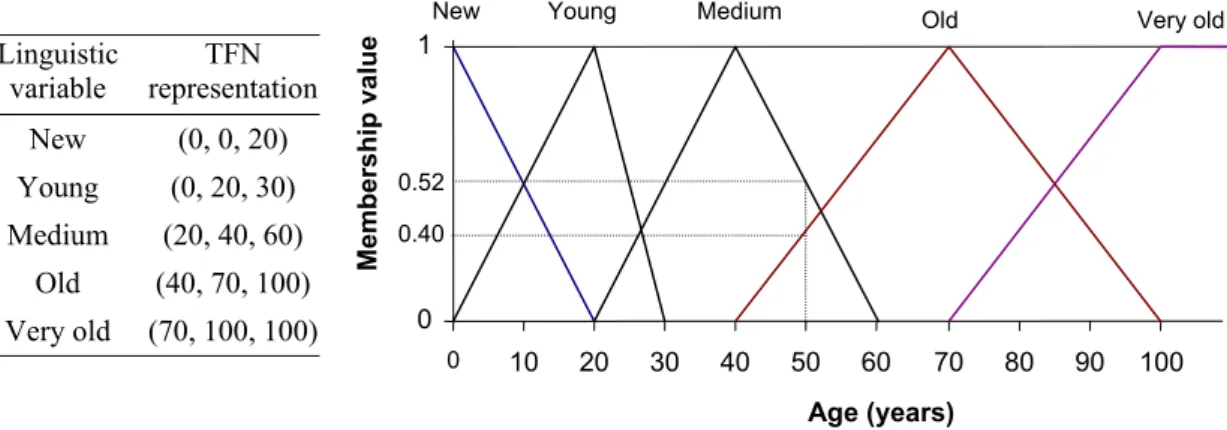
The proposed models use triangular fuzzy numbers (TFN), as these are often used for representing linguistic variables due to their simplicity (Lee, 1996). Figure 1 illustrates
the concept for the linguistic definition of pipe age. In this example, it can be seen that for a pipe of age 50 years the membership values are 0.52 and 0.40 to Medium and
Old grades respectively, and zero membership to all other grades. The fuzzy set
representing the buried pipe at age 50 can be written as a 5-element vector (0, 0, 0.40, 0.52, 0), in which each element (tuple) depicts the pipe’s membership value to the corresponding subset of aging grade (from new to very old).
Membership value Linguistic variable TFN representation New (0, 0, 20) Young (0, 20, 30) Medium (20, 40, 60) Old (40, 70, 100) Very old (70, 100, 100) 0.52 0.40 Very old Old Medium Young New 100 90 80 70 60 50 40 30 20 10 0 1 0 Age (years)
Figure 1. Example of a fuzzy set representing linguistic variables for pipe age.
In fuzzy rule-based models, the relationships between variables are represented by means of linguistic if-then rules of the form “If antecedent (fuzzy) proposition then consequent (fuzzy) proposition” An example rule can be “if the pipe is young and the pipe condition is poor than the deterioration rate of the pipe is fast”. The Mamdani (1977) algorithm enables the making inferences based on such rules. In the example above, the algorithm will calculate for instance what the deterioration rate is if the pipe age is somewhere between young and medium (e.g., the pipe age has membership to both grades). This method enables the capture of qualitative and highly uncertain knowledge, forms it into the if-then rules, and subsequently creates a complete inference system. In modeling a system as a fuzzy entity, the fuzzy sets and the rules that define their relationships are referred to as the system’s underlying knowledge base.
3
Fuzzy rule-based Markovian deterioration process
Figure 2 depicts the knowledge base for the proposed deterioration model, including fuzzy sets for pipe age, condition and deterioration rate, as well as a rule set that governs their relationships. Detailed explanations are provided in Kleiner et al. (2004a,b).
The deterioration process is modeled as a “flow” of membership from one condition state to the next lower condition state. Figure 3 illustrates how the condition of a pipe changed from (0.14, 0.59, 0.27, 0, 0, 0, 0) in year 20 to (0, 0.09, 0.38, 0.52, 0, 0, 0) in year 40. The parameters that control the shape and scale of the deterioration curves are obtained by least-square regression.
MLV- :most likely value
Ri = If pipe age is “A” and pipe condition state is “C” then deterioration rate is “D’” (at time = t)
Pipe condition (C): Excellent Good Adequate Fair Poor Bad Failed
Age (A): New Slow Average Fast Very fast Very fast Very fast Very fast Young Slow Average Fast Fast Fast Very fast Very fast Medium Very slow Slow Average Average Fast Fast Very fast Old Very slow Very slow Slow Slow Average Average Fast Very old Very slow Very slow Very slow Slow Slow Average Average
Knowledge-base
Deterioration rate Min MLV Max
Very slow 0 0 d0 Slow 0 d0 2d0 Average d0 2d0 3d0 Fast 2d0 3d0 4d0 Very fast 3d0 4d0 4d0 Very fast Fast Average Very slow 0 d0 2d0 3d0 4d0 Me mbe rship 1.0 Slow
Deterioration rate (membership shifted/year)
Condition state Min MLV Max
Excellent 0 0 0.17 Good 0 0.17 0.33 Adequate 0.17 0.33 0.50 Fair 0.33 0.50 0.67 Poor 0.50 0.67 0.83 Bad 0.67 0.83 1 Failed 0.83 1 1 Age Min MLV Max
New 0 0 20
Young 0 20 40 Medium 20 40 70 Old 40 70 100 Very old 70 100 100
Age of the pipe (A, years)
Very old Old Medium Young New 0 20 40 60 80 100 Me mbe rship 1.0 Bad
Pipe condition state (C, qualitatively defined)
Fair Good Exce-llent Me mbe rship 1.0
Adeq-uate Poor Failed
0.83 0.33
0 0.17 0.50 0.67 1
Fuzzy rule-set RD
Figure 2. Fuzzy rule-base for the Markovian deterioration process.
0 0.1 0.2 0.3 0.4 0.5 0.6 0.7 0.8 0.9 1 0 20 40 60 80 100 12 Year
M
emb
er
sh
ip
val
u
e
Excellent Adequate Good Failed Poor Fair Bad 0Figure 3. Deterioration curves.
4
Post-renewal condition improvement and
subsequent deterioration
In the following, the term “repair” is used for a very localized intervention that does not improve the general condition of the pipe by a noticeable amount, and is not likely to change the deterioration rate of the pipe. The terms “renewal” or “rehabilitation” are used interchangeably, and refer to the type of intervention that improves the condition of the pipe and possibly modifies its deterioration rate as well. Consequently, a repair event does not warrant any special attention in the deterioration model. In considering a renewal alternative k, it is assumed to have three specific attributes. The first is a condition improvement matrix Pk, which determines how
much the condition of the pipe will improve immediately after renewal. The second is a post renewal deterioration rate, which determines how fast the pipe will continue to deteriorate after renewal. The third is the cost of renewal Sk.
Table 1. Expert input to construct condition improvement matrix Pk. Confidence to get
condition shift To condition
From condition Excellent Good Adequate Fair Poor Bad Failed Excellent Highest
Good Highest Lowest
Adequate Medium Highest Lowest Fair Medium Highest Medium Poor Lowest Highest Medium
Bad Medium Highest Lowest
Failed Lowest Highest Medium
There are insufficient field data to assign deterministic or even probabilistic values to
Pk. Consequently the condition improvement matrix, Pk, is constructed based on expert
opinion, which is extracted linguistically as shown in Table 1. The relative levels of confidence highest, medium, lowest are designed to capture the uncertainty of the prediction. These values are subsequently assigned relative weights, say, 0.7, 0.4 and 0.1, for highest, medium, lowest, respectively to obtain the condition improvement matrix.
The post-renewal deterioration rate must also be evaluated based on expert opinion for lack of sufficient field data. Similar to the condition improvement matrix, expert opinion on post-renewal deterioration rate is extracted using a matrix similar to that in Table 2. The relative levels of confidence highest, medium and lowest are again designed to capture the uncertainty of the prediction (or belief), and are assigned relative weights, which can be the same as those assigned to extract the condition improvement matrix i.e., 0.7, 0.4 and 0.1 for highest, medium and lowest, respectively. Table 2. Expert input for evaluating the post-renewal deterioration rate.
Confidence that post-intervention deterioration rate will be, compared
to the current deterioration rate
Much lower Lower Same Higher Much higher
Medium Highest Lowest
The values in Table 2 are converted to a fuzzy deterioration rate that is expected after pipe renewal. An example of resulting deterioration curves is illustrated in Figure 4. In this example, a renewal was implemented at year 54, when the pipe condition was approximately (0, 0, 0.13, 0.52, 0.31, 0, 0). After renewal the pipe condition shifted to approximately (0.19, 0.46, 0.33, 0, 0, 0, 0). Post-intervention "failed" 54 Current renew al 87 next renew al 0.0 0.1 0.2 0.3 0.4 0.5 0.6 0.7 0.8 0.9 1.0 0 20 40 60 80 100 120 140 160
Pipe age (years)
M e mb e rs h ip va lu e ( p re -r en ew al ) 0 0.1 0.2 0.3 0.4 0.5 0.6 0.7 0.8 0.9 1 M e mb er sh ip va lu e ( p o st -r en ew al ) Good Time “bought” Pre-intervention "failed"
Excellent Fair Fair
Adequate Bad
Adequate Poor
Good
Figure 4. Pre and post-renewal deterioration curves.
It can also be seen that the condition of the renewed pipe at year 87 is expected to be the same as just before the renewal was implemented. This means that, based on the assessment regarding post-renewal condition and post-renewal deterioration rate, the renewal action “bought” the pipe 33 years of additional service.
5
Fuzzy rule-based risk
Lawrence (1976) defines risk as a measure of probability and severity of negative
adverse effects. A complex system that involves various contributory risk items with
uncertain sources and magnitudes, often cannot be treated with mathematical rigor during the initial or screening phase of decision-making (Lee, 1996). In the realm of buried pipes failures, not only is the likelihood of failure difficult to quantify, but failure consequences as well.
Fuzzy sets are often interpreted as possibility distributions in contrast to probability distributions (Klir and Yuan, 1995). It follows that the membership value to the failed condition can be viewed as the possibility of failure. Kleiner et al. (2004b) showed how these membership values can be mapped onto a secondary fuzzy linguistic scale, comprising nine grades including extremely low, very low, quite low, moderately low,
medium, moderately high, quite high, very high and extremely high, to express
possibility of failure. Similarly, a nine-grade fuzzy set was constructed for the severity of the pipe failure consequences. This set comprised the linguistic variables extremely
low, very low, quite low, moderately low, medium, moderately severe, quite severe, very severe and extremely severe. An additional nine-grade fuzzy set was constructed
to represent fuzzy risk. This set had nine linguistic variables from extremely low to
extremely high. A set of rules was constructed to govern the relationships between
these three fuzzy sets representing the possibility, the consequences and the risk of failure. This set of rules comprised 81 rules (9 possibility levels by 9 consequence levels) such as “if the possibility of failure is quite low and the consequences of failure are very severe then the risk of failure is medium”. Here too, the Mamdani (1977) algorithm is used to make the proper inferences.
The possibility of failure can be inferred for each year in the life of the pipe from the deterioration model described earlier. If the fuzzy failure consequences are provided, the fuzzy risk level can be inferred as well, as illustrated in Figure 5. The intensity of the gray levels represents the membership values to the respective risk levels such that darker colours represent higher membership values.
Figure 5 also illustrates the concept of α-cuts and its use in the context of confidence bands. The α-cut of a fuzzy set is defined as the range for which the membership values are equal or higher than the value of α. Imagine that the gray scale in Figure 5 (representing membership values) is replaced by a height dimension (darker colours correspond to larger heights). The profile (cross-section A-A) of the fuzzy risk can be plotted as a triangular fuzzy number for every year in the risk plot. A given α value can define a range of risk values for which membership is greater than α. Τhis range can be viewed as a possibility interval, which is akin to the concept of confidence interval in probability theory. Plotting this range for each year, will result in a possibility band – analogous to confidence band. The high side of this band depicts the conservative attitude, while the low side depicts the optimistic attitude. The selection of an α value to make decisions is a matter of the decision maker’s policy.
Risk level Extremely high Optimistic Conservative A A Higher lower M embership Risk level α A-A Very high Quite high Moderately high Medium Moderately low Quite low Very low Extremely low 20 40
Pipe age (years) 80
60 100 120 140
Figure 5. Fuzzy risk levels over the life of a pipe
6 Making
decisions
Ideally, the optimal strategy of renew/repair/inspect will be the one which minimizes the present value of the total life-cycle costs (including direct, indirect and social costs of failure) that are associated with the pipe. This requires accurate forecasting of the pipe deterioration and the probability of failure over its life cycle (before and after renewal), as well as the expected consequences of failure.
Since the useful life of large buried pipes is usually measured in decades, the issue of discount rate is very important. In general, the higher the discount rate the greater the economic drive to delay expenditure as much as possible and visa versa. The choice of an appropriate discount rate for public investment is an issue that has been debated and researched extensively. Steiner (1969) mentions two major approaches to address this issue: (a) the discount rate should reflect some kind of marginal cost of capital, and (2) the discount rate should reflect some kind of explicit measure of social time preference (hence the term “social discount rate”).
Importance of discount rate not withstanding, there is a difficulty in applying it to fuzzy quantities representing linguistic variables. For example, how does one discount fuzzy failure consequences that have 50% membership to moderately high and 50% membership to quite high? Theoretically, it is possible to construct a set of fuzzy discount rates and relate them to the fuzzy consequences through a specific set of rules. This approach, however, requires further research.
Since various alternatives cannot be directly compared without discounting the life-cycle costs, a maximum acceptable risk value is proposed as a decision criterion. A water utility, through a consensus-building process like Delphi, will define the maximum acceptable risk zmax for its large-diameter transmission mains. Remembering
that the term risk is a composition of both the possibility of failure and the failure consequences, it is possible that one zmax will be applicable to the entire inventory of
large-diameter transmission mains. At the same time, special consideration, which
might not be readily integrated into the set of factors that determine failure consequences, may render more than one zmax necessary.
It is assumed that any decision concerning an intervention in a pipe will always be preceded by an inspection and condition assessment. Thus, if the deterioration model of a pipe predicts that zmax is going to be reached at year t, it follows that at year t an
inspection/condition assessment will be scheduled. This inspection/condition assessment can have one of two outcomes: either the observed condition of the pipe is better than predicted (the model overestimated the deterioration rate) or the observed condition of the pipe is the same or worse than the model predicted. In case the former outcome is encountered, the deterioration model is re-calibrated to include the newly acquired data, then re-applied to obtain a new time, t, for inspection/condition assessment. If the latter outcome is encountered, renewal work has to be planned immediately and implemented as soon as possible.
The decision maker can use two inputs to define tolerance. The first is an explicit measure of risk tolerance zmax. The second is the α-level of the possibilistic confidence
limit. The lower the α-value the wider the possibility band. For example, Figure 6 illustrates that for zmax = moderately high, the next inspection/condition assessment
will be scheduled at age t = 90-92 years or 99-101 years for α-values of 80% and 50% respectively, when the decision maker prefers the conservative approach.
0
0 20 40 60 80 100 120
Pipe Age (years) 9
Extremely high Conservative (α = 80%)
8
Very high
Conservative (α = 50%)
7
Quite high
Risk toleranceZmax 6 Moderately high 5 Medium 4 Moderately low 3
Quite low Optimistic (α = 80%)
2 Very low Optimistic (α = 50%) 1 Extremely low t 140 1
Figure 6. Renewal/inspection decision
As described earlier in Section 4, a renewal alternative k is assumed to have three specific attributes, namely the condition improvement matrix Pk, the post renewal
deterioration rate and the cost of renewal Sk. Recall that a renewal alternative k
essentially “buys” time Tk until the next expected renewal. The magnitude of Tk is
determined by how much the pipe condition is expected to improve and by the expected post-renewal deterioration rate. Assuming that all renewal alternatives will perform equally well during their respective expected Tk periods, the only selection
criterion can be cost versus time “bought”, or more precisely, the preferred renewal
alternative will be that for which the ratio Sk/Tk is the lowest. If equality of
performance cannot be assumed, then performance criteria need to be defined and quantified for all the renewal alternatives.
7 Summary
The scarcity of data on the deterioration rates of buried infrastructure assets, coupled with the imprecise and often subjective nature of the assessment of pipe condition merits the usage of fuzzy techniques to model the deterioration of these assets. The deterioration process is modeled as a fuzzy rule-based non-homogeneous Markov process. As the deterioration process progresses, the pipe gradually “flows” from high membership in good condition states to high membership in worse states. Expert opinion is used to determine post-renewal pipe condition as well as post-renewal deterioration rate.
Consequences of pipe failure are also modeled as fuzzy sets and are coupled with the possibility of failure, using fuzzy based rules, to provide the fuzzy risk of failure. The concept of α-cuts is used to construct a possibilistic confidence band for pipe failure risk. A decision on the next inspection schedule is based on the decision maker’s specific risk tolerance. Renewal alternatives are compared based on the ratios of their costs and their expected capability to defer subsequent renewal.
Acknowledgement
This paper presents interim results of an on-going research project, which is co-sponsored by the American Water Works Association Research Foundation (AwwaRF), the National Research Council of Canada (NRC) and water utilities from the United States, Canada and Australia.
References
Ariaratnam, S.T., El-Assaly, A., and Yang, Y. (2001), “Assessment of infrastructure needs using logistic models”, Journal of Infrastructure Systems, ASCE, 7(4): 160-165. Chao, C-J. and Cheng, F.P. (1998), “Fuzzy pattern recognition model for diagnosing cracks in
RC structures”, Journal of Computing in Civil Engineering, ASCE, 12(2), pp. 111-119. Dubois, D. and Prade, H. (1985), “Evidence measures based on fuzzy information”,
Automatica, 21(5): pp. 547-562.
Flourentzou, F., Brandt, E., and Wetzel, C. (1999). “MEDIC – a method for predicting residual service life and refurbishment investment budgets”, Proceedings of the 8th conference Durability of Building Materials and Components, Edited by M.A. Lacasse and D.J.
Vanier, IRC, NRC, pp. 1280-1288, Vancouver, Canada.
Kleiner, Y. (2001), “Scheduling inspection and renewal of large infrastructure assets” Journal
of Infrastructure Systems, ASCE, 7(4), pp. 136-143.
Kleiner, Y. Sadiq, R., and Rajani, B.B. (2004a). “Modeling the deterioration of buried infrastructure as a fuzzy Markov process”, Submitted to Journal of Infrastructure Systems, ASCE.
Kleiner, Y., Rajani, B., and Sadiq, R. (2004b), “Modeling failure risk in buried pipes using fuzzy Markov deterioration process”, ASCE International Conference on Pipeline Engineering and Construction (San Diego, CA. August.
10
Klir, G.J. and Yuan, B. (1995), “Fuzzy sets and fuzzy logic - theory and applications”, Prentice- Hall, Inc., Englewood Cliffs, NJ, USA.
Lawrence, W.W. (1976), “Of acceptable risk", William Kaufmann, Los Altos, CA.
Lee, H.-M. (1996), “Applying fuzzy set theory to evaluate the rate of aggregative risk in software development”, Fuzzy Sets and Systems, 79, pp.323-336.
Liang, M.T., Wu, J.H., and Liang, C.H. (2001), “Multiple layer fuzzy evaluation for existing reinforced concrete bridges”, Journal of Infrastructure Systems, ASCE, 7(4), pp. 144-159.
Lu, Y. and Madanat, S.M. (1994), “Bayesian updating of infrastructure deterioration models”,
Transportation Research Record, 1442, pp. 110-114.
Madanat, S.M., Karlaftis, M.G., and McCarthy, P.S. (1997), “Probabilistic infrastructure deterioration models with panel data”, Journal of Infrastructure Systems, ASCE, 3(1), pp. 4-9.
Mishalani, R.G., and Madanat, S.M. (2002), “Computation of infrastructure transition probabilities using stochastic duration models”, Journal of Infrastructure Systems,
ASCE, 8(4), pp. 139-148.
Madanat, S.M., Mishalani, R., and Wan Ibrahim, W.H. (1995), “Estimation of infrastructure transition probabilities from condition rating data”, Journal of Infrastructure Systems,
ASCE, 1(2): 120-125.
Mamdani, E.H. (1977), “Application of fuzzy logic to approximate reasoning using linguistic systems”, Fuzzy Sets and Systems, 26: 1182-1191.
Ramia, A.P. and Ali, N. (1997), “Bayesian methodologies for evaluating rutting in Nova Scotia’s special B asphalt concrete overlays”, Canadian Journal of Civil Engineering, 24(4), pp. 1-11.
Sadiq, R., Rajani, B.B., and Kleiner, Y. (2004), “A fuzzy based method of soil corrosivity evaluation for predicting water main deterioration”, Submitted to Journal of
Infrastructure Systems, ASCE.
Steiner, P.O. (1969), Public Expenditure Budgeting, Brookings Institute, Washington, pp. 48-54.
Wirahadikusumah, R., Abraham, D., and Isely, T. (2001), “Challenging issues in modeling deterioration of combined sewers”, Journal of Infrastructure Systems, ASCE, 7(2), pp. 77-84.