READ THESE TERMS AND CONDITIONS CAREFULLY BEFORE USING THIS WEBSITE. https://nrc-publications.canada.ca/eng/copyright
Vous avez des questions? Nous pouvons vous aider. Pour communiquer directement avec un auteur, consultez la première page de la revue dans laquelle son article a été publié afin de trouver ses coordonnées. Si vous n’arrivez pas à les repérer, communiquez avec nous à [email protected].
Questions? Contact the NRC Publications Archive team at
[email protected]. If you wish to email the authors directly, please see the first page of the publication for their contact information.
NRC Publications Archive
Archives des publications du CNRC
This publication could be one of several versions: author’s original, accepted manuscript or the publisher’s version. / La version de cette publication peut être l’une des suivantes : la version prépublication de l’auteur, la version acceptée du manuscrit ou la version de l’éditeur.
Access and use of this website and the material on it are subject to the Terms and Conditions set forth at
Report on sprayed polyurethane foam with alternative blowing agents
Bomberg, M. T.; Kumaran, M. K.
https://publications-cnrc.canada.ca/fra/droits
L’accès à ce site Web et l’utilisation de son contenu sont assujettis aux conditions présentées dans le site LISEZ CES CONDITIONS ATTENTIVEMENT AVANT D’UTILISER CE SITE WEB.
NRC Publications Record / Notice d'Archives des publications de CNRC:
https://nrc-publications.canada.ca/eng/view/object/?id=1db8e827-43f3-42db-a54d-19cce61c116c https://publications-cnrc.canada.ca/fra/voir/objet/?id=1db8e827-43f3-42db-a54d-19cce61c116c
'-3
.-
.r> ..- L ..-Lm z -
National Research
Conseil national
iL1l.
I
Council Canada
de
recherches
Canada
512
12
< F ^ ' - %!-LC' L 0
.>
t'Institute for
lnstitut de
I
Ri7
Research in
recherche en
Construction
construction
Report on Sprayed Polyurethane Foam with
Alternative 610 wing Agents
by M. Bomberg and K. Kumaran
8
Reprinted from
*-
- .-CFCs
&
The Polyurethane Industry: Volume
2
(A compilation of Technical Publications, 1988-1989)
p.
11
2-1 28
(IRC Paper No. 1638)
Report on Sprayed Polyurethane Foam with
Alternative Blowing Agents
M.
BOMBERG
and
K.
KUMARAN
Thc, I~wtitrttc* /i~r R~*#t.arc.h in Co~tstrttction National Rc~xourch Council o f Canatla
Tho. Socio~& cgthc Plastiw Irtcfu.slry o f Cartntfn
YHEFAC'E the existing technology using two alternative bblawing
.
This is the first report issued jointly by the Society of thePlastics Industry of Canada and the Institute for Research in Construction, National Research Council of Canada. The research team in the sprayed polyurethane foam proj- ect was a s follows:
M.
T.
Bomberg and M. K. Kumaran. Institute for Research in Construction, National Research Council of Canada N. V. Schwartz, Fellow of the Society of the Plastics Indus-try of Canada
M.R. Ascough, DuPont Canada Inc.
T. Abi-Saleh and J. Grbac, 1C1 Polyurethanes (CIL Inc.) S. Belej,
T.
Harris, and A. Sampara, BASF Canada Inc In addition, this report contains contributions from the following institutions:BASF Canada Inc -sample preparation, characteriza- tion of the foaming process
CIL IncnCI Polyurethane -sample preparation, char- acterization of the foaming process
DuPont Canada Inc. -determination of CFC content Division of Chemistry, NRCC -determination of CFC content
Institute for Research in Construction, NRCC -basic characterization of six sprayed polyurethane foams Information contained in this report will be presented a t the 9th Canadian Annual Conference on Rigid Polyure- thane Foam, Sept. 25-27, 1989, Huntsville, Ont. and the 32nd Annual Polyurethane Conference, Oct. 1-4, 1989, San Francisco, California
T
his report describes the first project carried out under the p i n t research probvam between the Institute for Research in Construction (IRC) of the National Research Council of Canada (NRCC), and the Society of the Plastics Industry of Canada (SPI). The objectives of this project were:agents
2.
To
compare key physical and mechanical -8s ofthese sprayed polyurethane foams with those of foam manufactured with CFC-11 (Base 88)
3. 'Ib establish a basis
tor
development of new polyrtre-thane sprayed foams with alternative blowing agents This report is restricted to the technical considerations
in sample preparation and subsequent evaluatim of the
selected performance characteristics
of
several generic materials. These materials represent today's technology ofcommercially produced sprayed polyurethane foams with
traditional and alternative blowing agents.
The following requirements were formulated for generia materials to produce a benchmark (Base 88) representa- tive of current sprayed polyurethane foam technology:
1. Long-term thermal resistivity not less than 41.6
m.W
W (6 per inch in the British system)
2. Physical and mechanical properties equal to or better
than that of current commercial foams
3. Inclusion of 5% polyester polyol derived from recycled
PET containers, a s recommended by Environment
PMI-
tection Agency "Recovered Insulation
MPtonals
-
wguidelines
4. Nominal density of 35 kghn'
5. Designed for Sprinflall weather conditions
6. Standard Flame Spread Classification
(eg..
lese than 400 when tested to a nULC
standard)Economic factom were not eonsidered.
These
conditions were used in themanufaam
of
Base 88 and other sprayed system Moreover, the followiagconditions were added fm manufacturing wmparotive
sprayed polyurethane
foems.
(a) All materials have similar reactivity
pro5iles.
(b) All materials use
an
equivalentto Base
88m e h
amountof
a blowing agent.(c) All materials are manufactured in the m e mariner
and under the same application wnditiona
To
examine the key aspectsof
material perfor& tk- following tests were selected.1. To manufacttu-e a sprayed polyurethane foam based on 1. Change in thermal resistance during laboratory rPging
'
REPRINTED FROM CFCs & THE POLYURETHANE INDUSTRY: VOLUME 2 ,
2. Dimensional changes a t 70°C and either ambient RH; or 90% RH
3. Stressstrain curve 4. Water vapor permeance
5. Initial concentration of blowing agent 6. Rate
of
nitrogen diffusionResults of these tests on sprayed polyurethane foam manufactured with CFC-11 (with and without water) and
with alternative blowing agents HCFC-123 and HCFC-
141b should provide a good starting point for systematic research on the development of new polyurethane sprayed foams.
2. SAMPLE PREPARATION
2.1 Conditions of Foam Application
The foam was applied on a dry, 6 mm thick, sheet of ply-
wood (sheathing grade) with dimensions of 1.2 x 1.2 m. Initially one pass of the foam was sprayed on the plywood surface to seal it and prevent subsequent warpage. The plywood sheet was then turned around and forlr passes, each approximately 15 mm thick, were applied on the other surface. The applicator's gun was positioned a t right angle to the plywood a t a distance* between 1 and 1.2 m. During the pilot study (see Appendix) both a 15 mm and a 25 mm thickness of each pass were tried. The thickness of the sprayed layer a h r the four passes was to be checked in the top left corner a t a distance approximately 15 cm fivm both edges. If the total thickness was less than 50 mm, one more pass had to be applied. The final thickness of the foam was to be between 50 mm and 70 mm. Each sample was stored a t the manufacturing place for 48 hours and then shipped to IRC.
The material was sprayed with typical Gusmer urethane spray equipment a t each of two plants (BASF and CIL). The application conditions are listed in Table 1.
2.2 Characterization of the Foaming Pnwcss
Repeatability of the foaming process was ensured by measuring the following characteristics at each plant and for each of the material batches:
1. Cream and tack-free time
2. Maximum temperature reached in the foam
3. Time when the maximum temperature occurred
4. Density of thin layers (12 mm) cut either from a core or from a junction of two spray passes (interpass)
5. Density of 25 mm thick foam layer
Tab& 7. Spray eqvipnmnt and condikms of appbcation.
Description Location 1 Location 2 proportioning unit model .H-11" model H - I 1
gun model 'D' model 'D'
conditions in mixing chamber:
static primary tempirature 1 8 0 ~ (120 P I 5Z°C (125 FJ
Static proasure approx. 56-70 atm 56-?0atm(800 1000 pail bore t w r a t u r e X O c I95 F) 38Oc (100 f)
Prhe applicator ition was marked to ensure that. for all batches produfiuring this project. the distance between gun
T a b k 2a. Characterization of the baming process for semples manufactured at bcation # 1.
cream tack-free maximum tide at max. batch time time - temperature temperature
number second 6ec0nd degree C min.
Measurements of foam temperature were performed with a thermocouple'placed on the first pass and sprayed over with a second foam layer. These measurements, per- formed by BASF and CIL for material produced a t each location are shown in 'bbles 2a and 2b.
Measurements of foam density were performed with the water displacement method I l l . Results obtained by BASF and CIL laboratories are shown in Table 3 and indicate that the density originally planned was maintained within 10%.
2.3 Materials 1 J d in This Project
For all materials examined in this project the applica- tion technique and the reactivity profile were constant. The change was introduced by modifying the sprayed poly- urethane foams as follows:
1. Using an equivalent amount of blowing agent but changing t h e type of blowing agent kg.. CFC-11, HCFC-123, HCFC-14lb)
2. Using the same type of CFC (i.e., CFC-11) but reducing its amount to 83.3%. 66.7% and 50% of the amount used in Base 88, by parallel use of another blowing agent, namely CO, generated by reaction with water By creating the matrix of two variables, this research was focused on the effect of chanee in the amount or t v w of blowing agent used in the sprayed polyurethane foam. Details of material formulations and batch codes are listed
3. PERR)RMANCE CK4RACTEHISTICS OF
SPRAY El) POI,Y URETHANE FOAM WITH C F G l l
(BASE
HH)
3.1 Thermal Resistance under Caboratory Conditions
'Ib establish the long-term thermal resistance of the ma- terial, slices with 5 and 10 mm thickness are cut and their
T a b k 2b. Characterization d Ihe lbsming process lor
a m p b s manuiactumd at kmtian #2.
cream tack-free maximum time at u x .
batch time time temperature temperature
number. second second degree C min
***-*-*-*---
12 0.5 6.0 160 6.0
Table 3. Density measured during sample preparetion. out, the d i n g thctora can be used to calculate aging of the full thickneee foam nnmple.
The aging curve for the reference thickness can a h be
used to calculate the deaign value (RJ which is an average thermal -istame for the whole aging period (for practi- cal purposes we express the aging period in days). If R, is the thermal resistance on any day
(a,
integrating from the first to the last day (m), one defines R, as followa, d e n s i t y , kg/m3batch i n t e r p a s s c o r e 25 mn~ number l a y e r l a y e r l a y e r
.'
thermal resistance is deterhind as a functien of time (ag- ing curves). Then. wing the method described below, the long-term thermal resistance is calculated for the actual
material thickness. for practical purpoees, the integral may be replaced Bum by a
3.1.1 USE OF SLICING AND SCALING FACTORS It is practical to determine a characteristic aging curve for any sample of a gas-filled foam by following the change in thermal resistance of thin layers over a period and then applying scaling factors to determine the aging curve for any desired thickness. Such an approach has been de- scribed elsewhere [21. Thin slices of convenient thickness are cut from the sample and aged in the laboratory. Dur- ing the sample preparation, however, some cells in the layer adjacent to the surface are destroyed, making the ac- tual path of gas diffision shorter than the geometric thick- ness. Subtracting the thickness of destroyed surface layer (TDSL) from the geometric thickness l2.31, one obtains the effective thickness
(L)
for the slice.The thermal resistance ( R ) of the slice is determined as a function of time, t. The experimental curve so estab- lished for the tested thin layer, can now be used to calcu- late an aging time for a reference thickness
(L)
of the same material using the scaling factorAssuming that the d u c t i o n in thermal resistance fol- lows an exponential relation [3,4], the aging over a period of m days can be expressed as
Ri
-
R, = I - - log (8R.
-
R, log (m)where R. and R, are the thermal resistances on the h t and last days of the aging period The dimensionless ther- mal resistance defined by Equation (3) changes from 1 a t day 1 t o 0 at day m. .
From the above relations it can be shown that the aver- age thermal resistance R, is equal to the Rrvalue on day (d ), where
If one' considers an aging period of 25 .yeere (rn = 9125 days), according to Equation (4). the average thermal -is- tance & for that period is reached on day d = 2888, i e , after approximately eight years.
This approach is adopted in the present work. with
Lo
equal to 10 mm. If the material is homogeneous through- Table 4. Codes of materials received for joint SPI/NRC project on
sprayed polyurethane foams. 3.1.2 AGING CURVES OF 5
AND
10MM
THICK
LAYERS Blowing S Date when l o c a t i o n 1 l o c a t i o n 2agent r a t e r r e c e i v e d code code ARer completion of a pilot study (see Appendix) and se-
lection of the application technique, two more batches (13 and 14) of Base 88 were produced. Again slices of 5 and 10 mm thick were cut and their
t h d
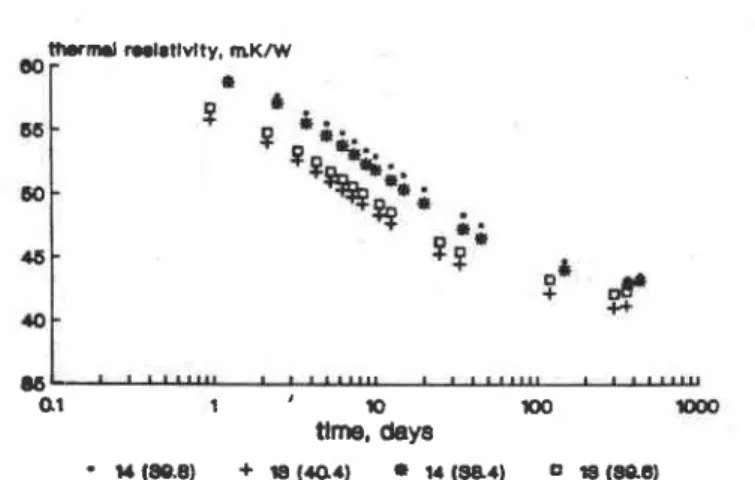
reeistivity over a pe- riod of90 days dehrmined. Changes in t h dnesbtivity versus scaled time** are shown in Figure 1 for 6mm
thick layers and in Figure 2 far 10 mmthick
byer~. Specimen identification, shown in these figures, include bat& num- ber and density.In
Figure 2, hawever, tm10mm
thickspecimens were
tested
together andthe
idanti6mtionshows density
d
eachof
them. As ohsemed drriing thepilot study, the agreement betvmen -ens &om the
~ F c 11
-
10 Nov 19B8 11 CFC11-
10 Nov 1980 12 C F C 1 1-
30 Nov 1988 12A CPC11-
16 Dcc 1988 1lA QC 11-
16 Jan 1909 m C 1 1-
17 Jan 1909 1 3 llCPC 123-
26 Jan 1989 21 HCFC123-
3 Mar 1909 CFC 11 1 . 0 14 Mar 1989 43 CFC 11 1 . 0 14 Mar 1989 CFC 11 1 . 5 30 Mar 1989 51QC 11 1 . 5 30 Mar 1909 **Scaled time means time emwprding to q$ng of 10 mm thick
8pe.cimene. Unl- 0th- atad, 111 agmg c~rece re@
inthbreportare vaeus d e d time For the srlrc of
breyity. h.ovn! -scaledu ie omitted in furthr -n- tat~on d the agrng ames.
HCFC l 4 l b
-
1 3 Apr 1989 HCFC l 4 l b-
20 Mar 1989 35Figure 1. Thermal resistivity of layers with 5 mm Lhickness, prepared
from batches 13 and 14 (code 407-52). lnitral values were 59.1. 55.8,
58.7 and 56.7 m . K N respecblely.
spme batch is better than between those prepared at differ- plants,, ie., different batches
9 analyse variability
d
the results, Figure 3 comparesI . r aging curves obtained on Base 88 material manufac-
tured a t one plant location and Figure 4 compares six curves obtained for five batches representing both loca- tions. These comparisons use the relative thermal resis- tivity, i.e, the ratio between the thermal resistivity and the initial thermal resistivity. There is an experimental scatter between aging curves, each specimen showing con- sistently higher or lower thermal resistivity values. The reason for these differences is unknown. They may be
caused by variations in period before testing of thermal re- eistance was initiated (caused by the transport from manu- facturing to testing place) or by a change of application technology.
Both Figures 3 and 4 indicate that, within an experi- mental error, one may express the changes of thermal re- sistivity by a single curve. Some scatter of results is caused by experimental error and one must select a specific aging
curve to represent the material. One may either select the
average or the worst set of results. In this research, to maintain a safety margin, the worst set of results (the lowest aging curve) is usually selected. The plot of relative thermal resistance against time of aging. selected to repre-
sent the material, is introduced here as the reference agrng
curve.
The
reference aging curve for Base 88 is the curve determined for batch 11A using specimens with densitiesof 36.3 and 38.3 kg/mJ, code 11A (36.3138.8) in Figure 4.
The reference aging curve will be used to predict aging of
the material layers with different thicknesses.
3.1.3 PREDICTING 25
YEAR THERMAL
RESBEWCEFor a service period of 25 years (9125 days), according to
.
Equation (3). the average thermal resistivity will be equalto the thennal resistivity on the 2888th day. If one as- aamea tbat the thickness of a board of the material is 50
mm,
the d i n g factor with respect to the reference thick-nena d 10 mm will be (50110P = 25. Thus 2888 days for a
60
mm
thick board will camspond to 2888125 = 116 daysfor
the reference layer with 10 mm effective thickness. At116 days
the
representative aging curve f a 10 mm. shownin Figure
4, reaches the value of relative thermal resistiv-ity equal to 0.73. Since this value on the reference aging
curve depends on selected service life of N years (10.25.40
.
U
(Xf 1 lo lGiJ
tlme, days ((1 (37.WW.V + a (00.4/S7.81
u m.vs&e~ 0 u (scwas.s~
Figutw 2. Thermal resistrvity of layers with 10 mm thickness. prepared
from batches 13 and 14 (code 407-141). Specrmen codes include batch number and density. Where two 10 mrn thick specimens were tested together, dersities o'each are shown. Initial values were 51.6.
55 1. 57.3 and 56.9 m.KIW respectively.
Figure 3. Relatrve thermal resrslrvrty 01 Base 88 layers wrth 5 and 10
mm thickness. prepared at locatron 2 (batches 12. 12A and 14).
Fg!m 4. Relative thermal resistrv~ty of Base 88 byen wth 5 mm and 10 mm Ihrckness. prepared at both locatrons.
yearn) and the thickness of actual material layer, it is
allied here the design d w . ' h e design ratio can now be
used ta calculate the design N-year thermal k s t i v i t y .
Multiplying the design ratio by the average initial ther-
mal reeistivity d the material, m e obtains the long-term
(design) thermal resistivity. In thia m h ,the long-term thermal resistivity is calculated for a 25-year p e r i d and a 50 mm thick layer of t h e prayed foam. i ~&sign , 25-year
thermal msistiui9 will be determined. Similar calcula- tions can be done for boa& of any t h i c k or for any se-
lected sewice life of the material.
For Base 88, the initial thermal resistivity values were listed in 'bible 5. The average initial thermal resistivity was 56.6 m.K/W for batch 13 and 59.8 m.K/W for batch 14.
The design 25-year thermal resistivity (25-year average thermal tesistivity) for a nominal thickness of 50 m m is:
56.6 x 0.73 = 41.3 m.WW for bat& 13, location 1 59.8 x 0.73 = 43.5 m.K/W for batch 14, location 2
3.2 Dimensional Stability
Dimensional changes were measured on 150
x
150x
25 mm specimens after 1.7.14 and 28 days of exposure to
70°C and two levels of humidity, ambient and high rela-
tive humidity (approximately 99%
RH).
'Ib maintain sucha high relative humidity, an inner chamber was placed
within a larger air conditioned chamber. The outer cham-
ber maintains humidity of approximately 90% RH at
70°C. The inner chamkr, made of copper and equrpped with a tight, removable lid, is partially filled with water
and provides high humidity, close to !%% RH. Specimens
are placed on a aeparate stand, within the inner chamber,
30 mm to 50 mm above the water level.
Figure 5 reports the results from these measurements.
The highest linear changes of Base 88 after 7 and 28
days respectively, a t ambient
RH,
are 0.6% and 1.6%. At998
R H
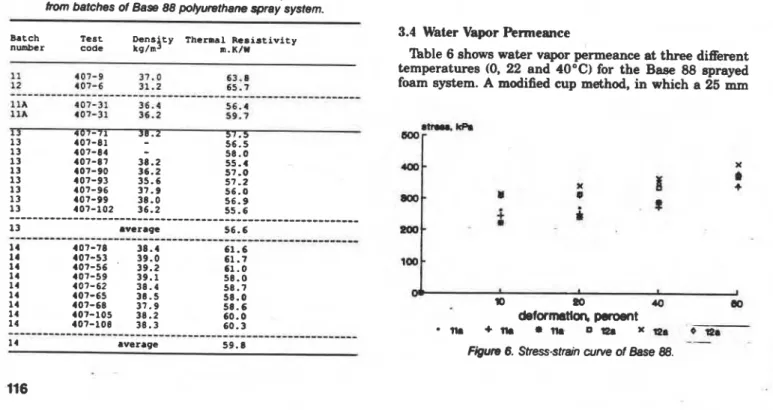
the highat are 5.0% and 8.0%.Table 5. Initial thermal msi'stivity of 25 mm W specimens cut
lrom batches of Base 88 pdywethane spray system.
Batch Test Dens ty Thermal Resistivity number code kglm
4
m.K/W ---*--- Ilk 4 0 7 - 3 1 36.4 5 6 . 4 1 1 h 407-31 36.2 5 9 . 7 ---*--- 14 average 59.8F & m 5. lkme&l chenge of
-&
88 under two expas~ies.~70°C. either ambmt humidtty or 99% RH.
3.3 Stnss-Strain
Curve
Following procedure A ofA!3TM test method D 1621 and
using a constant rate
of
eross-head movement, thestressstrain curve was measured on 150
x
150x
25rnm specimens. Figure 6 shows stress-strain curves for
batches lla and 12a. These curves are not drawn in the
range 0 to 10 percent d e h a t i o n , since this region of deformation is mostly charactmized by %rut bending"
151. The remaining part of the curve appears to relate better to the whole polymer matrix (struts and mem- branes). One should perhaps, underline that in this
work the stress-strain curve is used strictly for material
characterization.
The following are stress levels for Base 88, depending on
the location of manufacture, recorded a t 10 and 60%
deformation respectively:
location 1: 240 and 340 kPa location 2: 310 and 390 kPa
3.4 Water Vapor Permeance
'Igble 6 shows water vapor permeance at three different
temperatures (0, 22 and 40°C) for the
Base
88 sprayedfoam system. A modified cup method, in which a 25 mrn
d
I Ilo
m
10 a3deformatlm p m m t + n a .nr o l 2 a x m r
--
Tabla 6. Water vaporpmneance, in ng/s @ Pa, measured
between a water 8 ~ - end desiccent (modhd cup method) on Um Rase 88 sgrayed polyurethane foam.
- -- - Temperature 0 22 1 0 - bat& 11.
-
77-
batch 13 68-
93 batch 12.-
56-
b t c h 14 19-
63Tabk 7a Initial CFC conccnhation detetmined by D u h t &mda Inc. tor Base 88 samples.
Specimen Initial CFC 11 concentration, percent code and location test 1 test 2
- - -
13 board 1 10.2 12.6
13 board 2 12.4 13.6
14 9.6 10.4
Table 7b. Initial CFC concentration determined by the Division of Chemistry, NRCC for Base 88 samples.
specimen Initial CFC 11 concentration, code and location percent
13 10.5
14 11.3
7- 8. The effective nittugen diftusion coefficient and the
thickness of the destroyed M a c e layer (TDSL). B l w i n g Material TDSL Diffusio coefficient
agent batch m cnql s
thick specimen is placed between water and a desiccant
[6], is used for the experimental investigation.
The water vapor permeance of Base 88, measured at
.22"C. is:
location 1: 77 ngfis m2 Pa) loeation 2: 56 ng/(s m2 Pa)
3.5 Initial ~onc&tmtion of the Hlowing Agent
Measurements performed by DuPDnt Canada Inc and
Division of Chemistry,
NRCC
sre reported in 'hbles 7a and 7h Again, e small but aysternatic difference may be seen between the aamples manufactured at location 1(batch 13) and h t i o n 2 (batch 14). Momover, the range
of differences observed for location 1, where the initial
CM:
concentration varied from 10.2 to 13.6%. is too large to assume a single value for the initial CFC con- centration.3.6 Nitrogen Diffusion Coefficient
The method for meamring rate of gas d i f b i w [31, in- volves placing a few material discs in a waled chamber. increasing nitmgen p ~ ~ ~ u r e and monitoring changes in t h e total gas pressure in the chamber.
Four discs 5 mm thick and 150 mm in diameter, with carefully smoothed surhces were tested. The meults, listed in B b l e 8 indicate that for three tests the rate or nitrogen diffusion is practically constant. The average effective diffusion coefficient for nitrogen is 1.8 x
lo-"
cm2/s.4. PERFORMANCE CHARACTERISTICS
OF
SPRAYEI) POIYURETHANE RlAM WITH HCFC-123 ANI) HCFC-14lb
1.1 Thermal Resistance under Laboratory Conditions
Aging ofthin layers of sprayed polyurethane foam manu- factured with HCFC-123 is shown in Figures 7, 8 and 9. Figure 7 shows aging of 5 mm thick specimens and Figu1.e
8 shows aging of 10 mm thick specimens cut fmm batches
Figure 7. Thermal resrsbvrty of layers wrth 5 mm thckness. pmfmed lrom batches 21 and 22 (code 407-1 15) lnrlral values were 53.2. 52 1. 54.2 and 53.3 m. Km respectrvely.
a61 ' ' ' """ ' ' 'l"*" - ' ' -'
a1 1 lo 100 KKKI
timer days
Figure 8. ~Ikrmal resrst~it~ of layers with 10 mm thickness, prepared from batches 21 and 22 (code 407- 1 14). Inrtral values were 53.6. 53 3. 54 8 and 54.6 m. KIW respecbvely.
a1 1 lo X)O 1000
tlme, days
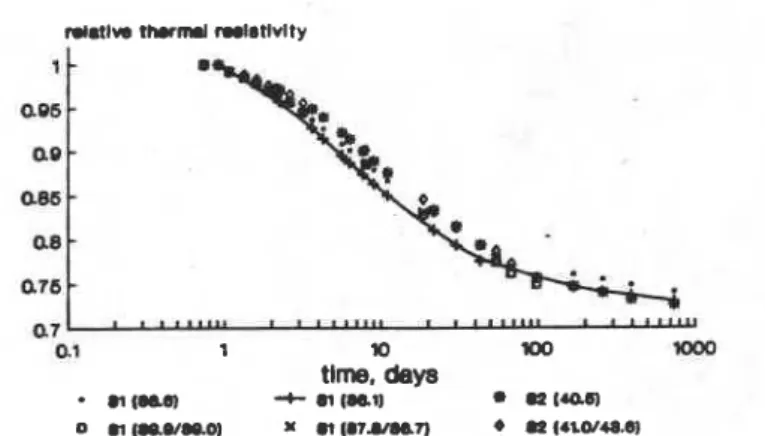
Figure 9. Relatrve thermal resistivrty of foam manufactured wrth
HCFC-123 (batches 21 and 22). hyers with 5 mm and 10 mm thrck- ness, prepared at both locatrms. Initial thermal resrsbvity values were
53.2. 54.2. 53.6and 54.8m.K~W.
Figure 10. Thermal resistivity of layers with 5 mm thickness. prepared from batches 55 and 56 (code 408-97). lnrtral values were 53.5. 53.5. 50.1 and 5 1.3 m. K/W respectively.
21 and 22. The HCFC-123 blown material, like the Baee
88, a h m moetly good agneement between specimens from each batch (ezcept for the 5 mm thick layers from batch 21) and a small difference between batches.
As in the previous analysis, thermal reeietivity in rela- tion to the initial value was
used
to ahow the aging curves (Figure 9). The diEerence in aging curves this time, howwer, appears to relate to specimen thickness, not manufacturing locetion. There is good agreement between aging curves for a given thickness even though the specimens are manufactured a t different locations. The lowest aging curves for batches 21 and 22, shown inFigure 9, give at 116 days the relative thermal
resistivity value of 0.75, which is the design ratio for 25 year service life.
Aging of polyurethane foam manufactured with HCFC-
141b is shown in Figures 10.11 and 12. Figure 10 shows
aging of 5 mm thick epecimens and Figure 11 shows ag- ing of 10 mm thick specimens cut from batches 55 and 56. Using the relative thermal resistivity, six of these measurements are shown in Figure 12. Again, a difference in aging curves relates to specimen thickness, not manufacturing location. The lowest aging curves for batches 55 and 56, shown in Figure 12, give a t 116 days the design ratio of 0.745.
Measured values of the initial thermal resistivity are
.
listed in 'hble 9 for batches 21 and 22 of the HCFC-123 blown foam, and in 'hble 10 for batches 55 and 56 of the HCFC-141b blown foam. The average initial thermal re- sistivities were 56.3 m . W and 56.0 m . W for HCFC- 123 and HCFG14lb blown foams respectively, giving the following design 25-year thermal raaistivities for a nominal thickness of 50 mm:0.75 x 56.3 = 42.2 m . W for HCFC-123 blown foam
0.745 x 56.0 = 41.7 m.WW for HCFC-141b blown foam
These results are very close to those obtained for Base 88 where, depending on the manufacturing facility, the de- sign 25-year thermal resistivity varied between 41.3 and 43.5 m.K/W. Within the constraints of this study, the de- sign 25-year thermal resistivity for Base 88 may be con- sidered identical to that of the foam blown either with HCFC-123 or HCFC-14lb alternative agents.
Figurn 11. Thermal &fivily d layem with. 10 mm thickness. pre- , pared from batches 55 and 56 (oode 4CB-96). Initial values were 53.0,
Figure 12 Refatwe thermal resrstwity of loam manulactured with
HCFC-14lb (batches 55 and 56), layers with 5 mm and 10 mm thick
ness prepared at both locations. hrtial thermal resistivity values were
C- . 53.5. 50.1, 53 0. 55.2 and 54 8 m. K/W
-
0 6 10 16 20 26 90
tlme, days
Figure 13. D~rnem~onal change under two exposures of sprayed
foam manufactured with HCFC-123: 70°C. erther ambent humrd~ty or
99% RH.
--u-I) -+.wlOeMHI + e l - -*.m1- -
-re 14. Lhmemonal change under two exposures d sprayed loem manufactured with HCFC- 141b: 70°C. either amplent humrdrty or 9996 RH.
Table 9. Initial thermal mreSlstivity of 25 mm lhick specimens cut
from spray system with HCFC-123.
Batch Test Dens t y me-1 n e s i s t i v f t y number code kg/.! m.K/w -- - 2 1 407-111 3 5 . 6 56.3 2 1 407-131 35.8 56.5 22 407-134 3 7 . 1 56.3
.
22 407-137 36.5 56.3 ---**+--- 21/22 average 56.3 4.2 1)imensional StabilityFigures 13 and 14 show results of measurements per-
formed on sprayed foem manufactured with HCFC-123 and HCFC-14lb respectively. The following are t h e highest values for the linear change for foam manufac-
tured with HCFC-123 after 7 and 28 days, respectiwb:
a t ambient RH : 1.4%, and 2.5%
a t 99%. RH : 7.OPkandlO.Wk
For the foam manufactured with HCFC-141L the highest
linear change values after 7 and 28 days respectively apcr
-
a t ambient RH : 0.5% and 1.5%
a t %RH : 4.1% and 6.5%
The dimensional stability of HCFC-14lb blown foam is practically identical to that of Base 88 (see Figure 5). The HCFC-123 blown material shows somewhat larger dimen-
sional changes a t both short and long-term exposure ia
high temperature and humidity. 1.3 Stress-Strain 'Curve
Figures 15 and 16 show the stress-strain curies Tim
sprayed foam manufactured with HCFC-123 and HCFC 141b respectively. The following are the lowest average stress levels for HCFC-123 and HCFC-141b blown faams, recorded a t 10 and 60% deformation respectively:
HCF'C-123 200 and 270 kPa
HCFC-14lb 270 and 310
k h
Both fmms shown in Figures 15 and 16 have so&&
less rigidity than the Base 88 material (Figure 6).
The
HCFC-141b blown material is closer to that b l m with
CFC-11, but the HCFC-123 blown material is nrm am-
pressible than Base 88.
4.4 Water Vapor k n n e a n c e
'hble 1 1 lists water vapor permeance measured an three
specimens from each batch using the modified cup m e t h d
Table 10. Initial rtmnnol msistiyay 01 25 mm thick qmcinmsm
rtom @ym&me m ysystem wilh W C 1 4 1 b . Wteh Test D.ns t y Thermal R e s i s t i v i t y
number code kg/.
4
m.K/W 408-114 36.7 54.8 408-121 31.8 54.0 408-98 36.9 57.6 408-101 37.8 57.9._-__---__---_
55/56 average 56.0oC
I0 6 . 20 *O do
defmtlon, percent
Figure 15. Stress-strain curve of the sprayed foam manufactured w~th HCFC- 123.
- 1 1
0 lo 20 40 00
deformation, percent
6 6 + 6 6 a 6 6 0643 X W 0643
Figure 16. Stress-stram curve of the sprayed foam manufactured wrth HCFC-1416.
Sd-
' ' """ ' ' ' " ' 1 1 1 ' ' ' """ ' ' I-a1 1 m KK) KKID
tlme, deys
81 (aae) + si par) + s2 (40.61
'
o a2 (41.81 Figure 17. Thermal resrstrvrly of layers vMIh 5 mm thrckness, prepared from batches 31 and 32 (code 408-21). lnrtral values were 55.5. 55.7. 58.3 and 56.6 m. KIW mpectwely.One may again o w a systematic W r e n c e in per- meance ofbateha produced a t each location; material pro- duced a t location 1 hae higher permeance. The average permeance at 22.C ia as follows:
HCFC-123, locations 1 and 2 87 and 76 ngl(8 mz Pa) HCFC-141b locations 1 and 2 92 and 67 ngAs m1
Pa)
Foams manufactured with HCFC-123 and HCFC-l4lb ehow slightly higher permeance than Base 88 foam.
4.5 Initial Concentration of the Blowing Agent
Measurements performed by DuFbnt Canada Inc are re- ported in a b l e 12. Again, a small but systematic dif- ference may be seen between the samples manufactured a t location 1 (21.55) and loation 2 (22,56). m p t for batch 56, 'Igble 12 e h m that different batches have a concentra- tion of blarrrring agent in cell-gas similar to that of Base 88. This indicates that the molar equivalence of different blowing agents was probably echieved during the foam preparation.
4.6 Nitrogen Dimusion k a r t
Results from the diffusion measurements are listed in 'hble 13. The average nitrogen d i h i o n coefficient for HCFC-123 blown foam is 2.6 x 10- cmlls and for HCFC- 141b blown foam 2.3 x lVs cml/s. Both cadicients are somewhat higher but not significantly different from
1.8 x 10-a cmlh determined fm Base 88 product.
5. PERFORMANCE CHARACTERISTICS OF
SPRAYED POWRETHANE
MlAM
WITH
CFC-11 AND WN'ER
5.1 Thermal Resistance under
Laboratory
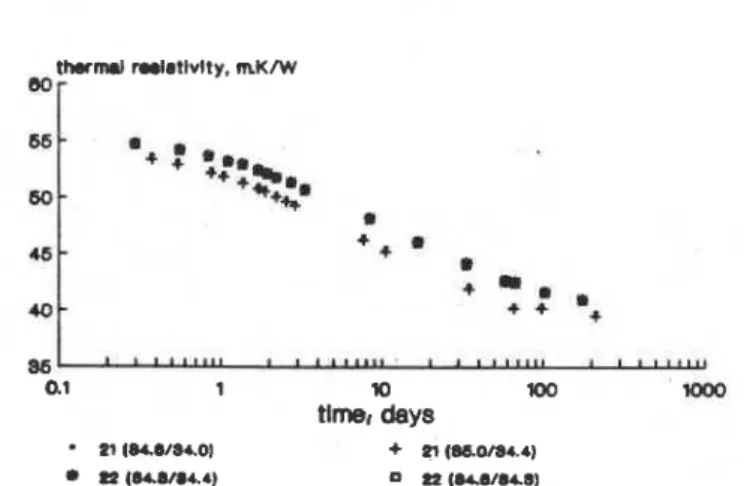
Conditions Aging of thin layers of sprayed polyurethane foam manu- factured with CFC-11 and 0.5% water are ahown in Figures 17, 18 and 19. Figure 17 shows aging of 5 mm thick specimens and Figure 18 shows aging of10 mm thick specimens cut from batches 31 and 32.As in the previous analysis, the relative thermal resistivity was used to show aging curves (Figure 19).
1 ' l ' l ' l a ' * = * m n L * * L * L = = n m m n l = * a * L L Y
a1 1 lo 100
aoa
d m . . .
rnlm.w=Ol + rn(.Iam&rl
*
8 Z ( 4 l # ~ 0 . mmm.Orm . .-- -
.-
.-
.F$ure 18. Thermel misbvity ot layers with 10 mm thickness, pre- pared from batches 31 and 32 (code 407-20). In&/ vekres wre 55.3, 54.2, 56.6 and 56.4 m. WW r w e l y .
Tabla 11. Water vapor 7 , measwed at 22OC with a modifkd cup method a, ihe sprayed polyurethane foam with
ehrmtive blowing agents.
h t c h Specimen Blowing Water vapor
cob. &naity agent
kglm3 11 ng/ ts 12
37:tl)ce
I3 hvgTabk 12. lnitlel HCH: concentration deermined by DuPont
. Canada Inc. on samples from SPUNRC juht reseamh program.
Batch code Initial HCFC concentration, percent test 1 test 2 123 21 12.1 13.9 22 11.9 12.7 -**--*---*--*--**--- McT? l4lb 5': e 9.5 10.6 56 7.2 7 . 5
Teble 13. The eftectibw nitrogen diffusion coefficient and the thickness of the destroyed sutiace layer (TDSL).
Blowing Material TDSL Diffusio coefficient
agent batch mm cmq/s
H W C 123 21 0.20 3.0x10-~
HCFC 123 22 0.20 2.3x10-~
HCFC 14lb 55 0.37 2 . 6 ~ 1 0 - ~
RCPC l4lb 56 0.29 2 . 0 ~ 1 ~ - 8
Tebk 14. Initial thermal resistivity of 25 mm Lhick specimens cut from the pOrVumtham spray foam manrlactured with
C F C l 1 and water.
Batch Teat Densjty Thermal Resistivity
number code kg/m ~ . K I W
31/32 average 50.8
---***---*-*---*--*----*---
Batch Teat Dons'ty Thermal Resistivity
n-r co* k p / J a.K/W 43 400-36 42.5 56.7 43 400-52 44.4 55.1 44 400-39 46.2 54.5 44 408-55 41.0 56.1 ---*---*---*---- 41/44
-
average 55.6 ---""-"---*---*--- ___ll__-_-r--*"r---h---*--- 51/52 average 51.9Fgum 19. R e b m thermal resrslw~ty of foam manufactured wrth CFC- 1 7
+
0.5% water, batches 31 and 32. layers wtth 5 mm and 10 mm thrckness. prepared at both locatrons. lnrtral thermal ressttv~ty values w e 5 5 5 . 55 7. 58.3. 55.3. 5 4 . 2 a n d 5 6 6 m . K N .Within experimental error, the changes of thermal resistivity may be defined by a single aging curve which represents all the specimens.
Using the same approach for predicting design 25-year thermal resistivity as discussed in Section 3.1.3, one finds that a t the 116th day of aging the design ratio is 0.74 (Figure 19). Measured values of the initial thermal resistivity are listed in a b l e 14 for batches 31 and 32, and the average initial thermal resistivity is 58.8 m . W .
Thus, the design 25-year thermal resistivity for material (nominal thickness equal to 50 mm) produced with CFC-11 and 0.5% water becomes 43.5 mK/W, i ~ , thermal resis- tivity identical to that of Base 88.
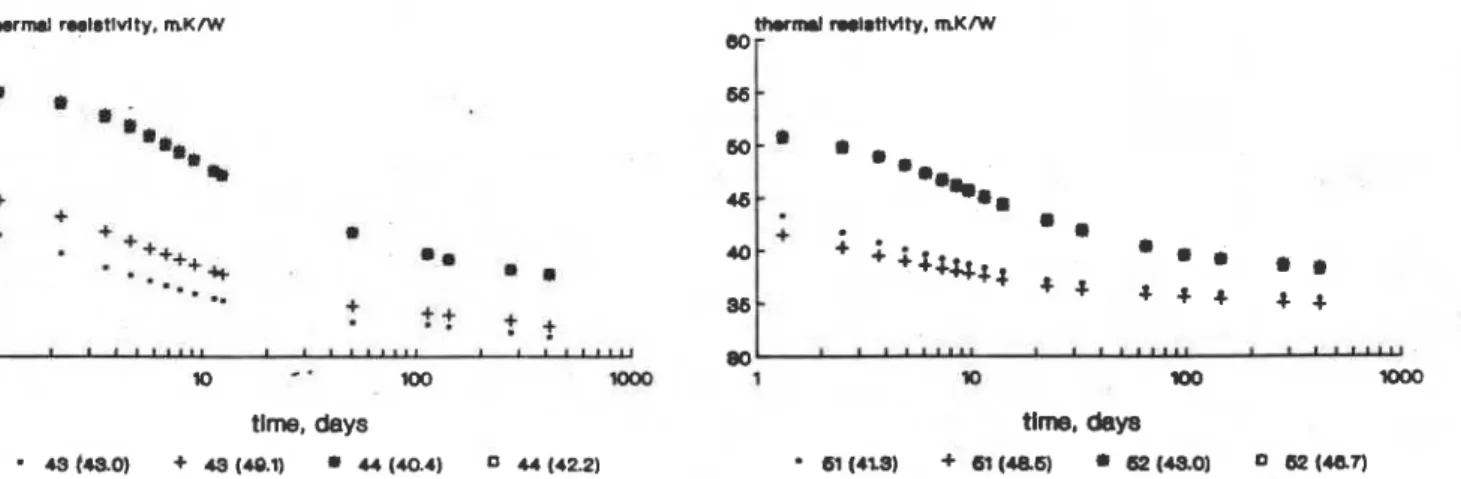
Aging of polyurethane foam manufactured with CFC-11 and 1.0 percent of water is shown in Figures 20, 21, and 22. Figure 20 shows aging of 5 mm thick specimens and Figure 21 shows aging of 10 mm thick specimens cut from batches 43 and 44. These figures show a large difference in thermal resistivity for material manufactured a t two loca- tions. For instance, Figure 20 shows the initial values of 46 m . K N and 56 m.K/W for batches 43 and 44 respectively. The use of relative thermal resistivity, Figure 22, partly reduced the differences between aging curves measured on different batches, but the remaining differences are yet too
large to establish a reference aging curve
Aging of polyurethane foam manufactured with CFC-11 and 1.5 percent of water is shown in Figures 23.24 and 25.
Figures 23 shows aging of 5 mm thick specimens and Figure 24 shows aging of 10 mm thick specimens cut from batches 51 and 52. Again. while there is a good agreement between specimens from each batch, there is a large dif- ference between the two batches. Figure 25, like the case
shown in Figure 22, shows such large difkrences between various aging curves, that to establish a unique relation which would describe aging of this fmm appears im- probable.
5.2 f ) i m e ~ a l Stability
Figure 26 shows results of measurements performed on sprayed foam manufactured with CFC-11 and varying amount of water. One obswves different patterns ofdimen- sional changes in the h a m manufactured with small (0.58) and large amount of water (1.5%). The material
tlme, days
Figwe 20. Thermal res$tivity of layers with 5 mm thickness, prepared from batches 43 and 44 (code 408-35). Initial values were 44 6. 4 7.4. 56.0 and 55.9 m. K N respectrvely.
86l
0.1 1 lo
Hme, days
Figure 21. Thermal resistivity of layers with 10 mm thickness, pre- pared from batches 43 and 44 (code 407-34). Initial values were 49.9. 50.0. 53.8 and 54.7 m.K/W respectively.
Figrrpe 22. Rebtrve thermal resrstivity ol loam manufactured with CFC-
1 1
+
1.0% water. batches 43 and 44. layers with 5 mm and 10 mm thickness. pepared a1 both kmtions. Initial thermal resistivtty values were44.6. 47.4. 56.0, 49.9, 50.0and53.8m.KMtlme, days
Figwe 23. Themral&tivtty d layers with 5 mm thn%ness, pepared
from batches 5 1 and 52 (code 408- 79). lnitiel values were 43.3, 4 1.5, 50.9 and 50.7 m. K/W respectively. 3oL ' " " " " 1 1 1 1 t 1 1 I I I 1 r n * t l 0.1 1 10 loo tlrne, days 61 (410159.0) 61 (44.2f41.D) 62 (47.a144.3) 0 62 (18.11410)
Frgure 24. Thermal resrstivity of layers with 10 mm thtckmss, pre-
pared from batches 43 and 44 (code 40866). Initial values are 44.2, 45.3, 51.7 and 52.9 m.K/W respectdy. a 7 1 m m * l l l * l - - * a 1 1 lo 100 mm time. d w at4l.m + m t . ~ srf.9801 o m ~ ~ w a a a ~ x a 1 r r ~ / 4 r q
*
sr ~ 4 7 . ~ ~ 9 ; . . -F & m 25. Relative thermal rasisiiviiy d foam manufechmed with CFC-
11
+
1.5% water, batches 51 and 52, eyers with 5 mm and 10 mm thickness, prepared at both &catrons. hitial thermal fesisistnnty dues--
- - -0 6 W) I 20 2B 90
' lime, deye
Figure 26. D f m e n ~ l change under two exposures of sprayed foam manufactured with CFC-I 1 and varyrng amounts of water: 70°C. e m r ambient humdily or 9996 RH.
with 0.5% water (codes 31 and 32) shows slow, progressive vpansion during the whole period of exposure. The srme
I .,9terial manufactured with 1.5% of water (code 52) shows,
however. a different pattern: initial shrinkage is followed by expansion. ARer 14 days of exposure to 99% RH there is another I.lwersal of dimensional changes resulting in a renewed shrinkage. At this stage both products (codes 51 and 52) follow the same pattern of dimensional changes.
By contrast, dimensional changes of the sprayed foam manufactured with 0.5% water are almost identical to those of Baee 88.
5.3 Streee-Strain Curve
Figure 27 shows stress-strain curves for sprayed foam
manufactured with CFC-11 and varying amounts of water.
Although all these curves are close to the stress-strain curve of
Base
88 material, one notices that an increase in the amount of water appears to cause some increase in rigidity.5.4 Water Vapor Permeance
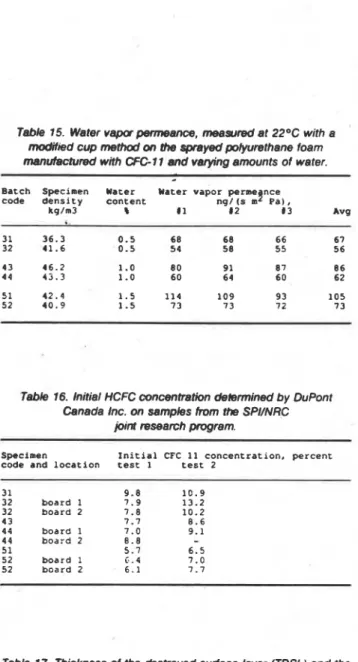
'Lgble 15 lists results of water vapor permeance mea- sured with the modified cup method a t room temperature.
-0 m 20 +D 00
deformation, percent
- 8 1 + a 2 0 4 4 ~ S I0 6 2
Hqum 27. Stress-strain curve for foam sprayed wrth CFC- 1 1 and vary- mg amount of water.
Again, one observes a systematic difference in permeance
of batches produced a t each location. For material gro- duced a t location 1 (batches 31.43 and 51) the permeance is significantly higher. The .kwrage permeabilities a t 22°C are:
0.5% water, location 1 and 2: 67 and 56 ng/(s m1 Pa) 1.0% water, location 1 and 2: 86 and 62 ng/(s m1 Pa) 1.5% water, location 1 and 2: 105 and 73 ng/(s m2 Pa) One notices that foam with 0.5% water has identical per- meance as Base 88, and that water vapor permeance in- creases with the amount d w a t e r used in the manufacture.
5.5 Initial Concentration of Blawing Agent
Measurements perfarmed by DuPbnt Canada Inc are rp
ported in Thble 16.
Thew
results may be compared to Base88 in the following way: batches 31 and 32 should have in- itial concentration of CFC-11 about 83% of that for base
88, batches 43 and 44 about 67%< and batches 51 and 52 about 50%. If base 88 ehwed initial
CFC
concentration of 9.6 to 13.6%. batches 31 and 32 should show 8 to 11.3%. . batches 43 and 44 between 6.4 to 9.1% and batches 51 and 52 between 4.8 and 6.8%. While most of the measurements fall within the expected range, the scatter in results is much too large. This scatter probably warrants a detailed analysis of the sampling procedure.Results obtained for nitrogen difision thmugh poly-
urethane sprayed foam manufactured with CFC-11 and
varying amounts of water are listed in 'bble 17. Again, the nitrogen diffusion coefficient is practically constant and comparable ta that for Base 88 material.
6. DISCUSSION
The first objectim of this project was to manufacture a reference generic spray, a material which could
b
repro.duced by various industrial laboratories a t any time The variability in raw materials, polyol blending, foaming and application conditions, sampling and many other factors were considered during a discussion with representatives from the polyurethane industry [9.10]. In effect, a review performed by the Research and Development Advisory
Committee on Myurethane formed by SPI Canada led to
specific constraints being suggested for the foaming pro- cess and s a m ~ l e m ~ a r a t i o n technique [Ill. 'Ib ensure that the material k d d
ba
reproducedat
various locations. a set of measurements to characterize the foaming process was eekted. These messures. as demonstratedbv
the D ~ I O ~ atudy. helped toachieve the d mof material &i&n& reauimd for a commrative investieation.physical and kechanical pmp&ties of this generic sprayed foam, ~ a l l e d Base 88, were to be similar to the best commercial prayed polyurethane fmma *Zb determine if this goal was echiwd, the key performance aspects of Base 88 are examined below and compared with t h e of typical polyurethane foams.
Long-term thermal pertiumancu. The design 25-year
thermal resistivity for Base 88 (nominal thickness equal to 50 mm) ranged between 41.3 m.KIW (location 1) and 43.5 m.K/W (location 2). It agrees well with the results of
Table 15. Water vapw penneance, measured at 22OC with a
moMt8d cup method on the sprayed polyurethane foam manufactured with CFC 1 1 and varying amounts of water. Batch Specimen Water Water vapor perme nce code density content ngl (s mq P a , ,
kg/m3 8 I1 12 13 Avg 31 36.3 0.5 68 68 66 67 32 41.6 0.5 54 58 55 56 43 46.2 1.0 8 0 91 87 8 6 44 43.3 1.0 6 0 64 6 0 62 51 42.4 1.5 114 109 93 105 52 40.9 1.5 7 3 73 7 2 7 3
Table 16. Initial HCFC concentration demnnined by DuPont Canada Inc. on samples from the SPI/NRC
@nt research program.
Specimen Initial CFC 11 concentration. percent code and location test 1 test 2
3 1 9.8 10.9 32 board 1 7.9 13.2 32 board 2 7.8 10.2 43 7.7 8.6 44 board 1 7.0 9.1 44 board 2 0.8 5 1 5.7 6.5 52 board 1 C.4 7.0 52 board 2 6.1 7.7
Table 17. Thickness of the destroyed surface layer (TDSL) and the effective nitrogen diffusion coefficient.
Blowlng Uaterial TDSL Diffusio coefficient
agent batch inn cm?/ s
CiC 11 3 1 0.23 2.4x10-~ CFC 11 32 0.17 1.7x10-~ CFC 11 43 0.18 2.0x10-~ CFC 11, 44 , 0.19 1.7xl0-~ , CFC 11 51 0.41 2.2xl0-~ CFC 11 52 , 0.32 1.6x10-~
a field study 1121, where the best material &owed long- term performance
of
41.6 m.WW (6 per inch). Ita h
agrees with the results obtained a tNRC
[131, where after 10 years of outdoor v u r e and 4 yearn of laboratory etor- age, thermal resistivityof
plyruethaneboards
varied be- tween 39 m.K/W (6.6 per inch) and 45 mKJW (6.5 per inch).Dimensional d i & . An inter-laboratory comparieon [7] showed poor reproducibility of dimensional stability measurements performed a t high humidity. Hence the measurements on dimensional stability which include high humidity exposure may be compared only within the
same laboratory-material-test method combination.
Measurements performed a t 70°C and ambient humidity are, however, reproducible between di&rent laboratories and may be used for interlaboratory comparisons-
This test, for Baee 88 (Figure ?), hooped 0.6% linear change f i r 7 days, while a bulletin from DuPont Inc 181 showed correeponding value
of
1.9% linear change for 35 kg/m3 polyurethane. Thus, Base 88 s h m better dimen- sional stability.Stress-strain curves. Approximately the same stress a t 10% deformation may Se seen in Figure 8 (Base 88) and in the above bulletin. The increase in stress needed to achieve 60% defbmiation appears, however, to be smaller for Base 88 [a].
Water vapor permeance. One observes that the water
vapor permeance of Base 88 is approximately half of that measured on polyurethane
boards
161.Thus, as shown by comparisons of four
key
perfomance characteristics, the objective aet for this project was achieved and Base 88 compares favorably with typical rigid polyurethane foams. The excellent properties of the Base 88 sprayed foam system (design 25-year thermal resistivity better than most unfaced polyurethane boards, dimensional stability better and water vapor penieance smaller than those of typical polyurethane [a]) give credit to the industry's representatives and their "committee agreed" design approach. Undoubtedly, Base 88 forms a good vehicle to convey existing industrial technology to the new generation of polyurethane spray 8yatems.The second objective was to compare key properties of Base 88 with those of sprayed foam manufactured with alternative blowing agents. As previously mentioned, material variability was reduced by constraints placed on the foam reactivity pmfile and application technique. Nevertheless the remaining material variability was still substantial. In spite of this variability, the present study provides a good basis for comparison of
Base
88 and foams manufactured with alternative blowing agents HCFC-123 and HCFC-14lb.The key physical and mechanical properties of sprayed
foam manufactured with alternative bl-g agents are
compnred with thoee of Base 88 belaw.
bng-term thermal per@rmame. The design' &-year
thermal resistivity for 50 mm thick foam
manufactured with HCFC-123 and HCFC-14lb were'42.2
and. 41.7 m.KM Repectively. These val- compare
favorably with the m e estimate for Bme 88, which ranged between 41.3 m.K/W (loeation 1) and
43.6 m.K/W
(location 2).Dimensional stabilily. There was practically no dif-
ference between Base 88 and HCFC-141b blown foam. The
HCFC-123 blown material showe wmewhat l a g e r dimen- sional changes a t both
shmt
and long-term eqmmm to high humidity.Stress-strain curves. Both HCFC-123 and HCFC-141b
blown foams are somewhat less rigid than Base 88 mate-
rial. With HCFC-141$ the foam was closer to Base 88, whereas HCFC-123 gave a more compressible product.
Water vapor permeance. Both foams manufactured with
alternative blowing agents h a w slightly higher per- meance than Base 88 foam.
Thus, as shown by comparisons of four key performance characteristics, there is no significant difference in the properties of the sprayed polyurethane foam manufac- tured with alternative blowing agents HCFC-123 and HCFC-141b and the same foam with CFC-11 blowing agent.
The third objective was to enhance the development of new polyurethane sprayed foam systems manufactured either with alternative blowing agents or reduced CFC-11.
l b this end, a matrix of reference materials and test
methods was developed with a view to enhancing further research on:
1. materials, by use of a structured test methodoloby 2. performance oriented test methods 1141, by use of refer-
ence materials for comparing the test methods 'Ib develop such a matrix, another aspect of blowing agent modifications was investigated, namely. that of a t r a d e d between CFC and CO, generated in partially water blown foams. While partially water blown foams showed some interesting trends in properties (eg an in-
crease in vapor permeance and structural rigidity with in- aeased amount of water used in the formulation), the most surprising observation of this research was made on thermal resistivity of the material manufactured with CFC-11 and 0.5% water. It was shown that the long-term thermal resistivity of this product was equal to that of the best Base 88 foam (location 2). It appears that the effect of lower initial thermal resistivity of the foam (CFC content was 14% lower than in Base 88) was compensated by posi- tive contribution from other variables. This indicates a need for further study on the effect of selected manufactur- ing variables.
It was observed that within experimental error, one characteristic aging curve was obtained for four of the tested materials: Base 88 and foams manufactured with
HCFC-123, HCFC-14lb, and CFC-11 together with 0.5%
water. This material characteristic, called the reference aging curve, as shown in section 3.1.3, could be used to pre- dict long-term thermal resistivity for materials with dif- ferent thickness and exposure periods. For a given service life
(N
years) and material thickness, using the reference aging curve, one may establish a design ratia Since the design ratio may be established for any thickness of the foam and duration of the aging period, one basic material characteristic (reference aging curve) may be used forvarious
applications of the same material.Multiplying the design ratio by the average of the initial thermal resistance, one may determine the design N-year thefmal resistivity (an average thermal performance over N yeare).
Thus,
the development of the reference agingcurve and deaign ratio to calculate aging a t any other
thickness or time is significant.
It
brings us a step closer to .-practical way for evaluating long-term thermal perfor- manceof
gasfilled foams.The reference aging curve is also a characteristic mate- rial property. When experimental error prevents deter- mination of a clear dependence of relative thermal resis- tivity on aging time, as was the case for foams blown with
CFC-11 and 1.0 or 1.5% of water. one has reason to believe that the various specimens tested do not represent the same material structure. In fact, it appears that a scatter of aging curves may be a good measure of optimization of variables affecting foam reactivity. Of course, how to define Bimilarity" of the material structure and how to relate the effect of variables in the manufacturing process to the polymer structure are topics far beyond the scope of this work.
7. CONC1,lJI)INC REMAKKS
This report compared six different polyurethane sprayed systems designed along two lines:
1. Different blowing agents (CFC-11. HCFC-123, HCFG
141b). with the same molar amounts of blowing agent 2. Same blowing agent (CFC-11) but its amount reduced by simultaneous use of CO, to 83%. 674 and 50% of that of Base 88
With the sample preparation technique carefully e m -
trolled, the foaming process aescribed by a set of selected measurements and the samples prepared independently by two experienced industrial laboratories, this ploject combined leading industrial technology and state-of-the- a r t test methodology. A total of 17 batches were p d u c e d and tested, each batch approximately 6 m 2 (64 ft') in size. This simulated material variability under actual manu- facturing conditions, an inevitable but often forgotten part of industrial research.
Evaluation of long-term thermal performance was based on the scaling approach [2], with the following measures taken to reduce variability in results of the thermal test- ing:
1. Thin slices of material (5 mm and 10 mm) were usedto determine aging curves.
2. Change in thermal resistance as a function of time was determined for each specimen separately and expressed in relation to their initial thermal resistivity.
3. After establishing experimental scatter, the reference aging curve was selected.
4. The average initial thermal resistance was determined
on 25 mm thick specimens using standard ASTM 300
or 600 mm square Heat Flow Meter apparatus and large material volume
All the sprayed foam systems, even though man&- tured with three blowing agents (CFG11. HCFC-123, HCFC-141b) appear to have similar long-term perfor- mance characteristics. This may be surprising because thermal resistivity of gaseous CFC-11 is 204 higher tham that of HCFC-123 [15]. But even more surprising is
tbe
fact that the design Wyear thermal resistivity ofBase
88obteined a t location 2 (upper limit of Base 88 astimated
b
identical to the value. obtained a t both locations, for thePUR
foam manufactured with 14 percenth
of'CM=-11.Pr
is evident that initial thermal performam is not the d y
factor that determines long-term thermal perfornaaaae What are the factors which. for the same initial the- resistivity. will give better long-term performance? This question is the subject of the second stage of S P U N E research project on sprayed polyurethane foams.
The other significant finding of this study is that despite the use ofdifferent blowing agents. the polymer matrix re- mained practically unchanged from one material ta