Publisher’s version / Version de l'éditeur:
Lighting Research & Technology, 24, 1, pp. 43-52, 1992
READ THESE TERMS AND CONDITIONS CAREFULLY BEFORE USING THIS WEBSITE. https://nrc-publications.canada.ca/eng/copyright
Vous avez des questions? Nous pouvons vous aider. Pour communiquer directement avec un auteur, consultez la première page de la revue dans laquelle son article a été publié afin de trouver ses coordonnées. Si vous n’arrivez pas à les repérer, communiquez avec nous à [email protected].
Questions? Contact the NRC Publications Archive team at
[email protected]. If you wish to email the authors directly, please see the first page of the publication for their contact information.
NRC Publications Archive
Archives des publications du CNRC
This publication could be one of several versions: author’s original, accepted manuscript or the publisher’s version. / La version de cette publication peut être l’une des suivantes : la version prépublication de l’auteur, la version acceptée du manuscrit ou la version de l’éditeur.
For the publisher’s version, please access the DOI link below./ Pour consulter la version de l’éditeur, utilisez le lien DOI ci-dessous.
https://doi.org/10.1177/096032719202400105
Access and use of this website and the material on it are subject to the Terms and Conditions set forth at
Semantic differential scaling: prospects in lighting research
Tiller, D. K.; Rea, M. S.
https://publications-cnrc.canada.ca/fra/droits
L’accès à ce site Web et l’utilisation de son contenu sont assujettis aux conditions présentées dans le site LISEZ CES CONDITIONS ATTENTIVEMENT AVANT D’UTILISER CE SITE WEB.
NRC Publications Record / Notice d'Archives des publications de CNRC:
https://nrc-publications.canada.ca/eng/view/object/?id=9a4392aa-11be-4e37-9857-35c409d49001 https://publications-cnrc.canada.ca/fra/voir/objet/?id=9a4392aa-11be-4e37-9857-35c409d49001
Semantic differential scaling:
prospects in lighting research
Tiller, D.K.; Rea, M.S.
NRCC-31739
A version of this document is published in :
Lighting Research & Technology, 24, (1), pp. 43-52, 92, DOI:
10.1177/096032719202400105
The material in this document is covered by the provisions of the Copyright Act, by Canadian laws, policies, regulations and international agreements. Such provisions serve to identify the information source and, in specific instances, to prohibit reproduction of materials without written permission. For more information visit http://laws.justice.gc.ca/en/showtdm/cs/C-42
Les renseignements dans ce document sont protégés par la Loi sur le droit d’auteur, par les lois, les politiques et les règlements du Canada et des accords internationaux. Ces dispositions permettent d’identifier la source de l’information et, dans certains cas, d’interdire la copie de documents sans permission écrite. Pour obtenir de plus amples renseignements : http://lois.justice.gc.ca/fr/showtdm/cs/C-42
Lighting Res. Techno/. 24(1J 43-52 (1992) Printed in Great Britain
Summary The semantic differential has been used to characterise the psychclogical aspects of lighting. It is unclear whether results from semantic differential scaling can stand alone. Two analyses, one of already published data, the second of new data, suggest that a correlation procedure may form the missing link between semantic differential scaling and more rigorous traditional psychophysical procedures.
Semantic differential scaling: Prospects in lighting research
Dale K Tillerf DPhil and MarkS Reai PhD
t
Institute for Research in Construction , National Research Council Canada, Ottawa, Ontario, KIA OR6; Lighting Research Center, Rensselaer Polytechnic Institute, Troy, New York, 12180-3590, USA
Received 27 March 1991, in final form 30 August 1991
1 Introduction
Psychophysics is the measurement of perceived physical characteristics of objects, using well defined behavioral responses from human observers. The aim is often to estab-lish functional relationships .between physical parameters and subjective reactions using written or verbal responses. Numerous techniques and procedures fall under the auspices of subjective reactions research. In lighting research, ques-tionnaires (e.g. References 1-3), rating scales (e.g. Reference 4) and magnitude estimation techniques (e.g. Reference S) have all been used in attempts to relate physical parameters to subjective responses. Of these various techniques, mag-nitude estimation has been exemplary in establishing pre-dictive functional relationships between physical measures of light and quantitative perceptual effects.
Perhaps because of the success of magnitude estimation many believe that the more qualitative and etheral aspects of the visual environment can also be examined using subjective techniques. Unlike magnitude estimation procedures, how-ever, many subjective reaction protocols do not have a well defined stimulus, nor do they utilise unambiguous responses.
Flynn<4
J was one of the first to apply Osgood'sC<>-IO) semantic differential in lighting research. It has since become the measurement tool of choice for most investigators interested in human responses to the qualitative aspects of the lighted environment (e.g. References 11-24).
The semantic differential consists of a set of bipolar, seven-category rating scales. The ends of each individual rating scale are defined by polar opposite adjectives (e.g. good-bad, large-small, spacious-<:ramped, hazy-clear etc.). People are asked to rate a variety of environmental attributes using each response scale. These ratings supposedly provide a characterisation of the quality and intensity of attributes along the dimensions rated.
Investigators using this technique have, at least implicitly, assumed that semantic differential scaling represents a typi-cal instance of measurement, as might be exemplified in the measurement of objects using a metre stick . When several people measure the same object, or different objects using a metre stick, their individual measurements of each object will usually agree closely, despite any influence of random and/or systematic error in measurement. This is because each person uses the metre stick to measure the same quality
of different objects, namely spatial extent, using the same units of measurement. It is helpful then to define measure-ment of any kind as the assignment of numbers to objects following some ruleClS-27). However, there
is
evidence to suggest that semantic differential scales are not always used consistently in measuring subjective reactionsCIO, 28-30>. One way to test whether different observers have used individual semantic differential scales in a consistent fashion is to examine the patterns of inter-scale correlations. If individual semantic differential scales have been applied consistently by independent groups of subjects rating the same stimulus, or by one group of subjects rating several different stimuli, then patterns of inter-scale correlation should remain relatively stable. In fact, Shaw(3o> found stimu-lus-dependent variations in the patterns of inter-scale cor-relations for the word concepts that he studied. Osgood eta!.<10l confirmed these findings, concluding such
stimulus-dependent variations suggested that 'the meanings of scales and their relations to other scales vary considerably with the concept being judged' (Reference 10, p 187). More importantly, the changes in scale meaning identified by these two authors are not attributable to any random error or to systematic measurement biases. The scales are simply used in an inconsistent fashion. Therefore, collecting more data will not, through averaging, alleviate any problems due to random error. Further, no simple linear transforms will be able to account for systematic measurement biases. Thus, it is difficult to accept, a priori, that semantic differential scaling is always a case of orthodox measurement.
In this paper we examine and compare patterns of semantic differential scale inter-correlations in two different sets of data. One set of semantic differential ratings was originally collected by Rea(31l, who had subjects rate six different task
lighting schemes. The second set of semantic differential ratings reflected subjects' impressions of four office spaces that were illuminated with different types of lighting but were otherwise identicaL This second set of ratings was collected in order that proper statistical analysis procedures could be applied, which was not possible with Rea's<31 > data. To our knowledge, this is the first time that such techniques have been applied to semantic differential ratings collected in lighting experiments. The patterns of scale intercorrelations were found to vary across the different lighting schemes in both sets of data. The implications of these findings are discussed, and possible strategies to improve the use of semantic differential scaling for lighting are described.
MMMMMMMMMMMMMMMMセMMMMMMセMMMMMMMMMMMMMMMMMMMMMMMMMMMMMMMMMMMMMMMMMMMMMMMMMMMMMMMMMMMMMMMMMMMMMMNFMMN Q@
)
D K Tiller and M S Rea
2-
GゥZィオセB@ 1VUAUJ & task, in which they compared two juxtaposed number lists
2 .I Procedures for discrepancies. The list at the subject's left was the
reference list, while the list on the right was the response The subjective scaling data used in the analysis were col- list. The reference list acted as a standard against which the leered by Rea(31' in conjunction with a visual performance numbers on the response list were compared. The subject's
experiment. These data were used because they were con- task was to compare the two lists as quickly and accurately veniently available, and were originally collected following as possible, and note discrepancies by placing a mark on the procedures similar to mose used in other studies on the response list .
psychological effects of lighting. The small number of
sem-antic differential scales used by Rea<31l makes it easy to Six different task lighting schemes produced changes in the
understand the implications of the observations. contrast of the number lists, which affected task completion
Briefly, Rea(31l had subjects perform a numerical verification times and accuracy. Illumination on the task was provided
Table 1 Task evaluation scale intercorrewtions across light settings
Light Attribute scale Correlation with
setong B-G D-E U- P S-S T-R D-B H-C F-S Bad-Good I Difficult-Easy 0.75711 Unpleasant-Pleasant 0.73236 0.78352 I MP90 Subduing-Stimulating 0.5857 0.76763 0.92578 1 Tiring-Relaxing 0 .7429 0.85372 0.94851 0.93714 I Dim-Bright 0.70511 0.62959 0.33534 0.21604 0.37217 Hazy-{;lcar 0.6528 0.84444 0.88856 0.95527 0.94686 1).3121 I Frustrating- Satisfying 0.8921 0.63955 0.66208 0.47439 0.62582 1).73493 0.4933 Bad-Good I セ@ Difficult-Easy 0.58298 1 Unpleasant-Pleasant 0.54653 0.49945 1 MPO Subduing-Stimulating 0.48571 0.37784 0.91898 I Tiring-Relaxing 0.54505 0.54901 0.90275 0.92118 Dim-Bright 0.74031 0.57625 0.41367 0.35746 0.43061 I Hazy-Clear 0.00000 0.28894 0.24514 0.34929 0.4911 0.10198 1 F rusttating-Satisfying 0.58025 0.6469 0.64905 0.50197 0.50493 0.58326 -0 . 19973 Bad-Good I Difficult-Easy 0.77298 I Unpleasant-Pleasant 0 .81771 0.72644 1 PM90 Subduing-Stimulating 0.70796 0.58301 0.77983 1 Tiring-Relaxing 0.66763 0.5937 0.86732 0.69272 Dim-Bright 0.77373 0.74126 0.56149 0.3337 0.29422 l Hazy-Clear 0.66203 0.58127 0.77531 0.46646 0.90282 0.40208 1 Frustrating-Satisfying 0.9175 0.77635 0.85454 0.68443 0.6535 0.75842 0.6566 Bad-Good I Difficult-Easy 0.57147 I U npleasant-Pieasant 0.61637 0.57673 1 PMO Subduing-Stimulating 0.45785 0.46263 0.75724 Tiring-Relaxing 0.55321 0.53074 0.74278 0.87383 I Dim-Bright 0.74474 0.50183 0.40276 0.55097 0.51556 1 Hazy-Clear 0.20371 0.42287 0.37361 0.76635 0.65775 0.48149 I Frustrating-Satisfying 0.56305 0.54504 0.60208 0.52105 0.67082 0.63604 0.38067 Bad-Good 1 Difficult-Easy 0.80l31 1 U npleasant-P1easant 0.84842 0.82795 I LP90 Subduing-Stimulating 0.7156 0.7518 0.87704 1 Tiring-Relaxing 0.74385 0.77437 0.9027 0.97367 I Dim-Bright 0 .57471 0. 44652 0.2891 0. 10669 0. 10303 l Hazy-Clear 0.72875 0. 75818 0.69947 0.75941 0.74159 0.521 19 I Frustrating-Satisfying 0.91809 0.76258 0.82929 0.62208 0.65776 0.63679 0.66936 Bad-Good I Difficult-Easy 0.78154 I Unpleasant-Pleasant 0.83459 0.73577 l LPO Subduing-Stimulating 0.70305 0.57999 0.91697 I Tiring-Relaxing 0.71818 0.65293 0.88741 0.95173 l Dim-Bright 0.62828 0.53311 0.27603 0.1865 0.29938 Hazy-Clear 0.59433 0.51561 0.74466 0.83393 0.84702 0.16694 1 Frustrating-Satisfying 0.84369 0.73621 0.75414 0.6794 0.68819 0.40952 0.71884
by a single luminaire (aperture 95 X 95 em), located above the subjects' task.
The six different lighting schemes were provided by chang-ing the illwnination angle or the degree of polarisation of illumination. Two illumination angles were provided by rotating the subject's desk about the centre of the task (0° veiling re.ficction angle and 90° illumination from the subject's left). Three degrees of vertically polarised
illumi-nation were produced by different luminaire diffuser panels (Piexiglass and mylar, PM approximately 4%; multilayer polariser, MP, approximately 20%; linear dichroic polariser,
LP, approximately 100%). The two illumination angles and three degrees of polarisation produced six different lighting schemes. Within each lighting scheme four randomly dis-tributed examples of each type of reference sheet (having text printed with either black matte, black gloss grey matte, or grey gloss ink) were presented.
Each of six subjects gave semantic differenLial ratings immediately after completing the number comparison tasks under a particular lighting configuration. Two sets of sem-antic ctifferential scales were used in the experiment. One
et of ·ix feeling scales' dealt with how the subject felt
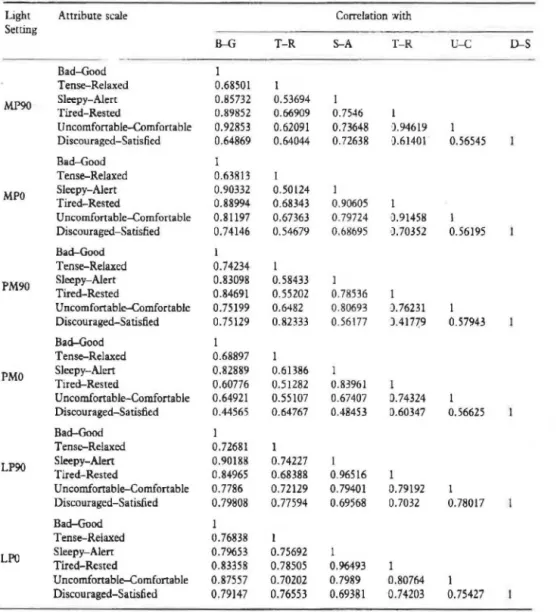
Table 2 Feeling scale intercorrelatio11s across light settings
Semantic differential scaling
durmg the preceding set of performance trials; the other set of eight 'task evaluation' scales dealt with the subject's overall evaluation of the task and environment during the preceding set of performance trials . All scales had negative valence terms on the left and positive valence terms on the right. Responses to the different scale categories were scored from one to seven; the better the perceived value of the attribute the higher the scale value.
Subjects did the task and seatings over the course of one morning and one afternoon session on two consecutive days. All experimental conditions were presented in a counter-balanced, randomised design. More complete details regard-ing apparatus, stimuli, observers and experimental protocol are available in Reference 31.
2.2 Results
Separate matrices of Pearson product-moment correlation coefficients, more commonly referred to as the sample cor-relation coefficient, or ,£32l, were calculated for the task evaluation and feeling scale ratings, at each of the six dif-ferent lighting schemes, giving 12 correlation matrices in all (six task evaluation scale matrices, and six feeling matrices).
Light Attribute scale Correlation 'Nith Setting B-G T-R S-A T- R U-C D-S Bad-Good I Tense-Relaxed 0.68501 I Sleepy-Alert 0.85732 0.53694 Tired-Rested 0.89852 0.66909 0.7546 MP90 U ncomforrable-Comfortable 0.92853 0.62091 0.73648 B4619 I Discouraged-Satisfied 0.64869 0.64044 0.72638 ').61401 0.56545 Bad-Good I Tense-Relaxed 0.63813 I Sleepy-Alert 0.90332 0.50124 I Tired-Rested 0.88994 0.68343 0. 90605 I MPO Uncomfortable-Comfortable 0.81197 0.67363 0.79724 D.91458 I Discouraged-Satisfied 0.74146 0.54679 0.68695 ').70352 0.56I95 Bad-Good I Tense-Relaxed 0.74234 I Sleepy-Alert 0.83098 0.58433 I Tired-Rested 0.84691 0.55202 0. 78536 PM90 Uncomfortable-Comfortable 0.75199 0.6482 0.80693 .).76231 I Discouraged-Satisfied 0.75129 0.82333 0.56177 INTQWセY@ 0.57943 Bad-Good Tense-Relaxed 0.68897 Sleepy-Alert 0.82889 0.61386 Tired-Rested 0.60776 0.5I282 0.83961 1 PMO Uncomfortable-Comfortable 0.64921 0.55107 0.67407 0.74324 Discouraged-Satisfied 0.44565 0.64767 0.48453 0.60347 0.56625 Bad-Good Tense-Relaxed 0.72681 1 Sleepy-Alert 0.90188 0.74227 I Tired-Rested 0.84965 0.68388 0.96516 LP90 Uncomfortable-Comfortable 0.7786 0.72129 0.79401 0.79192 I Discouraged-Satisfied 0.79808 0.77594 0.69568 0.7032 0.78017 Bad-Good 1 Tense-Relaxed 0.76838 I Sleepy-Alert 0.79653 0.75692 I Tired-Rested 0.83358 0.78505 0.96493 LPO Uncomfortable-Comfortable 0.87557 0.70202 0.7989 0.80764 I Discouraged-Satisfied 0.79147 0.76553 0.69381 0.74203 0.75427 Vol. 24 No. 1 (1992) 45
..
D K Tlller and M S Rea
Table 3 Range of variation in task evaluation scale intercorrelations across six ligiting schemes Attribute scale Correlation with
B-G !}...E U-P S-S T-R !}...B H-C F-S Bad-Good 0.0000 Difficult-Easy 0.2298 0.0000 Unpleasant-Pleasant 0.3019 0.3285 0.0000 Subduing-Stimulating 0.2578 0.3898 0.1685 0.0000 Tiring-Relaxing 0.1988 0.3230 0.2057 0.2810 0.0000 Dim-Bright 0. 1990 0.2947 0.2855 0.4443 0.4125 0.0000 Hazy-Clear 0.7287 0.5555 0.6434 0.6060 0.4558 0.4192 0.0000 Frustrating-Satisfying 0 .3550 0.2313 0.2525 0 . .2100 0.1833 0.3489 0.9186 0.0000
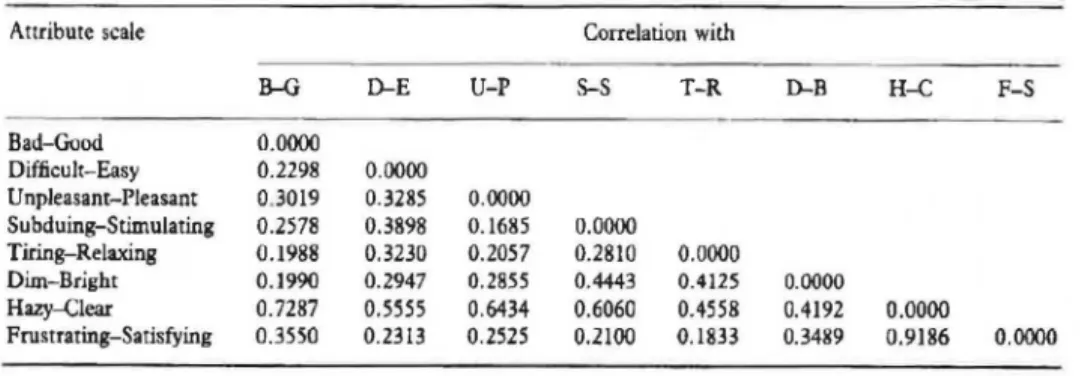
Table 4 Range of variation in feeling scale intercorrelations across six lighting schemes Attribute scale Correlation with
B--G T-R S--A T-R U-C !}...S ' Bad-Good 0.0000 t・ョセ@ Relaxed 0.1302 0.0000 Sleepy-Alert 0. 1068 0.2557 0.0000 Tired-Rested 0.2908 0.2722 0.2106 0.0000 Uncotnfonable-Comfonable 0.2793 0.1702 0.1329 0.2030 0.0000 Discouraged-Satisfied 0.3524 0.2765 0.2418 0.3242 0.2182 0.0000
:..
Tables 1 and 2 show the different task evaluation and feeling Table 5 Correlations for two different task evaluation scales with all
scale correlation matrices. For each pair of scales in the other scales under the different light settings
different task evaluation and feeling scale matrices, there
Attribute scale Correlation with
are six separate correlation coefficients, one at each of the different lighting schemes. Inspection of these tables
sug-Dim-Bright Hazy-Clear
gests that the relations between the different scales varied
depending on the particular lighting scheme rated . For 90°
o·
900o·
example, the scores on the hazy-clear task evaluation scalecorrelated 0.84 with scores on the 、ゥヲヲゥ」オャエセ。ウケ@ scale under MPt 0.7051 0.7403 0.6528 0.0000
the 90° multilayer polariser; rotating the desk to the 0° Bad-Good PM:j: 0.7737 0.7447 0.6620 0.2037
position under the same diffuser lowered the correlation LP§ 0.5747 0.6283 0.7288 0.5943
between these two scales to 0.29. Similarly, scores on the MP 0.6296 0.5763 0.8444 0.2890
frustrating-satisfying task evaluation correlated -0.20 with Difficult-Easy PM 0.7413 0.5018 0.5813 0.4229
scores on the hazy-clear scale under the multilayer polariser LP 0.4465 0.5331 0.7582 0.5156
at 0°; the correlation between the same two scales rose to MP 0.3353 0.4137 0.8886 0.2451 0. 72 under the linear polariser at the same desk orientation. Unpleasant- Pleasant PM 0.5615 0 .4028 0. 7753 0.3736 Thus, the strength of relationship between any two task LP 0.2891 0.2760 0.6995 0.7447
evaluation scales, indicated by the value of r, could vary
MP 0 .2160 0 .3575 0.9953 0.3493
across the six light settings. Subduing-Stimulating
PM 0 .3337 0.5510 0.4665 0.7664
The feeling scale intercorrelations exhibited similar changes. LP 0.1067 0. 1865 0.7594 0.8339
Ratings on the discouraged-satisfied scale correlated 0. 80 with MP 0.3722 0.4306 0.9469 0.4911
scores on the bad-good scale under the linear polariser at Tiring-Relaxing PM 0.2942 0.5156 0.9028 0.6578
90°. The correlation between scores on these two scales fell LP 0.1030 0.2994 0.7416 0.8470
to 0.45 under the plexiglass mylar diffuser at 0°. MP 1.000 1.000 0.3121 0.1020 The difference between the highest and lowest values of r for Dim-Bright PM 1.000 1.000 0.4021 0.4815 each pair of scales across the six different lighting schemes, or LP 1.000 1.000 0.5212 0.1669 range, provides an estimate of the variation in the cor- MP 0.3121 0. 1020 1.000 1.000
relations across the different light settings used in the original Hazy-Clear PM 0.4021 0.4815 1.000 1.000
experiment. Tables 3 and 4 show the range in correlations LP 0.5212 0.1669 1.000 1.000 across the six lighting schemes, for the task evaluation MP 0.7349 0.5833 0.4933 -0. 1997
and feeling scale ratings. Some of the scales showed wide Frusuated-Satisfied PM 0.7584 0.6360 0.6566 0.3807
variation, or instability, in their relationships with other LP 0.6368 0.4095 0.6694 0.7188
scales across the six different lighting schemes.
t MP = Multilayer polariser
Nevertheless, not all the scales were equally susceptible
+
PM= P1exigla.ss mylarto instability, as indicated by fewer and smaller stimulus- § LP = Linear polariser
dependent range variations in correlations with other scales. For example, intercorrelations of the hazy-clear task eval-uation scale with the other seven scales showed larger stimu-lus-dependent range variations, than intercorrelations of the
dim-bright task evaluation scale with the other seven scales.
Table S presents the individual correlations for these two particular scales with all the other scales, under the different lighting schemes. Inspection of this table clarifies the nature of such scale instabilities. Correlations of the stable
dim-bright scale with other scales are of similar magnitude across
the different desk orientations and diffuser combinations. In contrast, correlations of the hazy-clear scale with other scales exhibit larger variations in magnitude at the two different desk orientation and diffusing filter combinations. Changes in the desk orientation had a particularly strong effect on correlations of the hazy-clear scale with all the other scales.
Although suggestive, these findings remain inconclusive because some scale instability would of course be expected due to simple chance variation alone. Proper statistical analy-sis procedures are required to establish whether the observed scale instabilities reflect chance variation or more systematic changes in scale intercorrelations. This issue was resolved in the second study.
3 Study 2
3 .I Procedures
Two independent groups of 24 subjects rated the lighting in four offices that were identical in all respects except for the type of lighting illuminating each space.
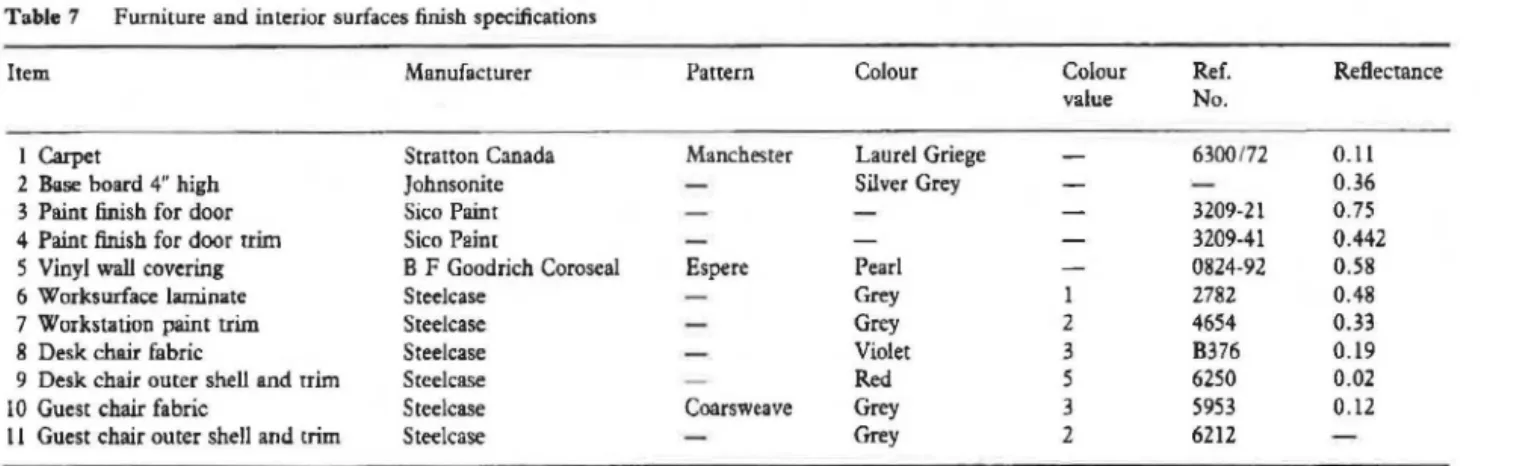
Each lighting scheme was selected to represent light settings used by John Flynn in his work on the psychological aspects of lighting. Rooms I and 3 were illuminated by overhead lighting. Room 2 was illuminated with a combination of overhead and peripheral wall lighting. Room 4 was illumi-nated with peripheral wall lighting. The luminances and illuminances at selected room surfaces under the respective lighting schemes are presented in Table 6. Details on the furniture and finishes installed in each of the four rooms are presented in Table 7.
Subjects rated their impressions of each room using a series of 30 semantic differential rating scales. The exact instruc-tions and complete rating questionnaire are presented in the Appendix. At the second and subsequent rating sessions, the instructions were not repeated on the cover page of
Table 7 Furniture and interior surfaces finish specifications
Semantic differential scaling
the questionnaire, as it was assumed that subjects could remember the task set for them.
Every subject rated each room once. The order in which rooms were rated was counterbalanced across subjects. At each of the four rating sessions, subjects entered the office, took the seat behind the standard desk facing the office door, and commenced the task.
3.2 Results
Separate matrices of Pearson product-moment correlation coefficients r were calculated from each group of ratings given in each room, giving eight matrices in all (i.e. two independent samples of scale ratings for each room). The
Table 6 Working plane horizontal illuminances and luminances of selec-ted surfaces in four test officest
Room E (lux) at desk 1000 300 100 4 100 Wall orientation North South East West Nonh South East West Nonh South East West North South East West Maximum (cd m ·' ) 78.1 58.4 57 .9 74.1 36.7 34.3 46.4 48.9 2.8 6.5 6.2 7.1 25.8 25.5 50. 1 34.8 Minimum Mean (cd m -2 ) (cd m -1) 25.7 50 .5 24 . 1 41.8 26 .7 45 .3 27 49.6 20.2 27 22 .3 28.2 18.8 27 .6 22 .6 32 .7 1.1 1.9 1.6 3.8 3.1 1.3 3.4 7.4 11.5 7 12.4 7.6 20.8 7.6 17.5
t Illuminances were measured from the same position on the desk top in each room using a Minolta T-IM llluminance Meter. Luminances were measured with a Topcon BM-3 Luminance Meter. Fifteen luminance measurements were taken to characterise the North and South Walls, each of which was nominally 12ft long, with an eight-foot ceiling. Twenty-one luminance measurements were taken to characterise the East and West walls, each of which was nominally 15ft long with an eight-foot ceiling. The luminance photometer was mounted 49 in above the lloor, on a uipod placed against the opposite wall. Each respective luminance measurement was taken by rotating the photometer to a different position in the vertical and azimuth planes.
Item Manufacturer Pattern Colour Colour Ref. Reflectance value No.
I Carpet Stratton Canada Manchester Laurel Griege 6300172 0.11 2 Base board 4" high Johnsonite Silver Grey 0.36 3 Paint finish for door Sico Paint 3209-21 0.75 4 Paint finish for door trim Sico Paint 3209-41 0.442 S Vinyl wall covering B F Goodrich Coroseal Espere Pearl 0824-92 0.58 6 Worksurface laminate Steelcase Grey 1 2782 0.48 7 Workstation paint trim Steelcase Grey 2 4654 0.33 8 Desk chair fabric Steel case Violet 3 8376 0.19 9 Desk chair outer shell and rrim Steelcase Red 5 6250 0.02 I 0 Guest chair fabric Steelcase Coarsweave Grey 3 5953 0.12 II Guest chair outer shell and trim Steelcase Grey 2 6212
Vol. 24 No. l (1992)
47
MMMMMMMMMMセセMMセセMMMMMMMMMMMMMMMMMMMMMMMMMMMM MMMMMM MMMMMMMMMMMMMMMMMMMM エ|@
D K Tiller and M S Rea
stability of response scale intercorrelations was tested by comparing respective intercorrelation pairs in the two inde-pendent matrices available for each room, using Edward's (Reference 33 pp 82-84) test for differences between two correlations. If the response scales were applied consistently, then each respective pair in the two independent matrices would be of similar direction and magnitude. On the other hand, if the response scales were applied in an inconsistent fashion by the two different groups of subjects, a large number of statistically significant differences between respective pairs of intercorrelations in the two matrices would be observed.
In fact, more statistically significant differences between respective pairs of intercorrelations in the two matrices for each room emerged than would be expected due to chance variation alone. At an alpha level of 0.05, one would expect 45 of the comparisons in a 30 x 30 matrix to achieve a statistically significant difference by chance alone. In room 1, 106 of the comparisons showed statistically significant differences; in room 2, 160 showed significant differences; 244 of the comparisons were significantly different in room 3; and finally, in room 4, 121 of the comparisons showed significant differences.
This analysis confirms that the scale instabilities observed in the first study reflect more than simple chance variation. Taken together, these results suggest either that semantic differential scaling is not an example of orthodox measure-ment, or that other factors (e.g. environmental, personal), affected the results. Without further evidence the former explanation is more parsimonious.
4 General discussion
As previously noted, psychophysics is the establishment of a functional relationship between a physically defined stimulus and a behavioral resp(>nse . Semantic differential scales are a special and ambitious form of psychophysics in that the stimulus is often unknown and the bipolar, often emotive, adjective scales are not necessarily related in any way to the (unspecified) stimulus. Much of what we firmly believe about human phenomena is based upon experiments where specific hypotheses have been tested by careful manipulation of one or more independent variables (stimuli) and measurement and statistical analysis of the dependent variable (responses). Since semantic differential scaling experiments typically do not control the independent able and do not necessarily isolate the best dependent vari-ables, it is of little surprise then, that the more conservative psychophysicist& have had little confidence in the technique or the results (e.g. Reference 29). Nevertheless, there are important questions about the perception of lighted spaces that probably cannot be answered with traditional psy-;:hophysical procedures whereby the stimulus and its associ-ated responses have been dearly identified prior to the initiation of the experiment.
Often in a lighted environment the presumed stimulus and its associated evocative response are not well understood. The problem facing experimental psychologists interested in the more ethereal aspects of architectural lighting is resolving the dilemma between a desire to ask meaningful questions about the environment, and the constraints imposed by rigorous psychophysical procedures.
For this paper, the dilemma may be more narrowly defined by the question 'Can semantic differential scales be used to
48
reduce our uncertainty about higher-order human per-ception of lighted environments?' The answer to this ques-tion may be 'yes', but the results of the previous analyses underscore the subtle and ambiguous nature of extracting information about human perception using semantic dif-ferential scales, as well as the importance of craftsmanship when conducting these experiments. Some of the important considerations for psychologists conducting experiments using semantic differential scales are discussed below.
4. I Definition of the stimulus
Researchers interested in the qualitative effects of lighting assume that most of the variance in subjective responses is due to changes in the lighting of a space. Obviously, this is more likely if the instructions to the subject, or the experimental context itself, have defined lighting lls the
environmental aspect under study. The rigorous procedures used in traditional psychophysical methods are particularly effective in establishing an experimental context wherein the independent variable (e.g. light, sound, etc.) is defined as the stimulus to be evaluated. In contrast, investigators studying the qualitative effects of lighting have not always adequately specified the lighting, or some feature of the luminous environment, as the stimulus, likely because the experimenters themselves do not always know what aspect of the visual environment is important. Hence, the possi-bility that other environmental or psychological variables have influenced subjective ratings seems rather likely. Many reports (e.g. References 11 , 13, 20, 21, 22) do not describe verbatim the instructions given to subjects, so it is impossible to determine whether the semantic differential ratings collected in those studies were likely determined by attributes of the lighting alone, or by additional nonluminous aspects of the environment.
Even when verbatim instructions are provided, investigators have not always accurately specified the lighting as the stimulus (e.g. References 23 , 24, 29). For instance, the instructions used by ReaC29l to collect the data analysed in
study 1 of this paper, asked subjects to give an 'overall evaluation of the task and environment' (Reference 29 p 122). These instructions invite subjects to consider more than just the light in noting their subjective impressions of a space. Numerous other aspects of the experimental situation could have influenced ratings (e.g. luminaire appearance, colour and texture of interior finishes and furnishings, dress and appearance of experimenters). It is perhaps not sur-prising then, that ReaCl9l found individual differences in response scale use. We do not know what stimuli his subjects were evaluating, whether different subjects were evaluating the same stimulus, or even whether the stimulus being evaluated remained constant for individual subjects. Since we do not know what constituted the stimulus, or stimuli, we cannot be certain that subjects' judgements would not have been more consistent had the stimulus been more accurately defined by the instructions.
The practical importance of adequate specification of the stimulus is highlighted by one other aspect of Rea's(29l
find-ings. He originally believed responses to the dim-bright
scale would reflect changes in the brightness of the task background and, since illuminance levels did not change, would remain constant throughout the experiment. However, two subjects used this scale to evaluate the experi-menta:ly manipulated target brightness (i.e. contrast). These two subjects were evaluating a different stimulus than had been assumed by the investigator. Clearly, it is not sufficient Lighting Research and Technology
___________
,-..,_,
_____________
-- - -
--·-
-Setnanzic differential scaling
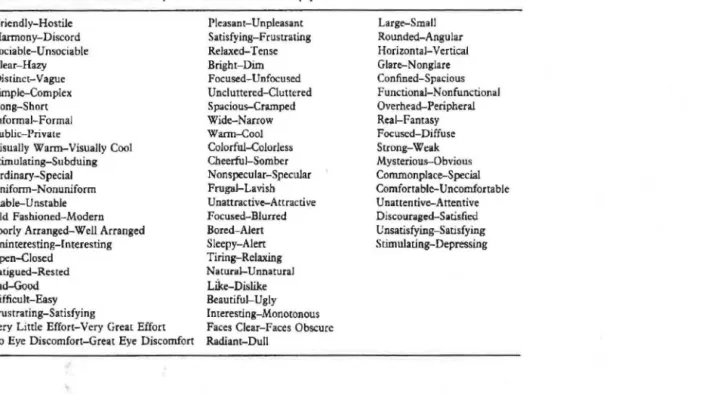
Table 8 Semantic differential response dimensions as used in papers cited in text Friendly-Hostile Harmony-Discord Sociable-Unsociable Clear-Hazy Distinct-Vague Simple-Complex long-Short Informal-Formal Public-Privat•
Visually Warm-Visually Cool Stimulating-Subduing Ordinary-Special U nifonn-Nonuniform Stable-Unstable Old Fashioned-Modern Poorly Arranged-Well Arranged Uninteresting-Interesting Open-Closed Fatigued-Rested Bad-Good Difficult-Easy Frustrating-Satisfying
Very Little Effort-Very Great Effort No Eye Discomfort-Great Eye Discomfort
Pleasant-Unpleasant Satisfying-Frustrating Relaxed-Tense Bright-Dim Focused-Unfocused Uncluttered-Cluttered Spacious-Cramped Wide-Narrow Wann-Cool Colorful-Colorless Cheerful-Somber Nonspecular-Specular Frugal-Lavish Unattractive-Attractive Focused-Blurred Bored-Alert Sleepy-Alert Tiring-Relaxing Natural-Unnatural Like-Dislike Beautiful-Ugly Interesting-Monotonous Faces Clear-Faces Obscure Radiant-Dull
for investigators to assume that subjects will evaluate the intended stimulus when the instructions and/or exper-imental context do not specifically and precisely define what is to be rated.
Reluctance on the part of the investigator to specify the stimulus in a semantic differential scaling experiment reflects uncertainty as to what in fact constitutes the stimulus under investigation. For traditional psychophysics this is a serious if not fatal problem with the procedure. Certainly the results of the present statistical analyses offer no support for the semantic differential approach since they clearly show that the scales were used inconsistently in the experiment (Tables 3 and 4), implying that the dependent variables (responses) were not unambiguously related to the independent variables (stimulus) under investigation (i .e. lighting geometry). 4.2 Definition of response dimensions
The second limitation with current semantic differential scaling practice involves the words that define the ends of the bipolar rating scales. In order for semantic differential scales to be used consistently by subjects, each response dimension should clearly refer to some salient and scalable aspect of the stimulus (e.g. the dim-bright scale refers to luminance, not to sound pressure). This will help ensure that every subject will always use a given scale in the same way to assess the same features of the different stimuli. If scales are used differentJy by different subjects or by the same subject at different times, the results will be difficult or impossible to interpret. In fact, Osgood showed that scales changed meaning as a result of inadequate definition of the dimension constituting each response scale.
In several studies Osgood deliberately failed to define the salient and scalable aspects of concepts that individual response dimensions referred to. For example, Osgood et
al. ooJ asked subjects to rate the concept BOULDER using a variety of semantic differential scales, including the follow-ing: long-short; healthy-sick; sacred-profane; and base-treble. Boulders are not normally considered to vary along
Vol. 24 No. 1 (1992) Large-Small Rounded-Angular Horizontal-Vertical Glare-Nonglare Confined-Spacious Functional-Nonfunctional Overhead-Peripheral Real-Fantasy Focused-Diffuse Strong-Wc:ak Mysterious--Obvious Commonplace-Special Comfortable-Uncomfortable Unattentive-Attentive Discouraged-Satisfied Unsatisfying-Sausfying Stimulating-Depressing
any of these dimensions. Nevertheless, people rated boulders along all of them. Osgood argued that such ratings were possible through a metaphorical application of response dimensions to concepts. However, the concept-dependent changes in patterns of inter-scale correlations observed by Osgood suggest that individual subjects used different meta-phors differentJy when evaluating the same concepts or stimulus. This is not orthodox measurement.
Not unexpectedly, similar difficulties exist when the sem-antic differential has been applied in lighting research. Table 8 shows the different semantic differential response dimen-sions used in previous studies. Inspection of this table sug-gests that only a few of the dimensions listed would potentially refer to scalable aspects of the luminous environ-ment: clear-hazy; visually warm-visually cool; no eye dis-comfort-great eye discomfort; bright-dim; focused-unfocused; colourful-<:olourless; nonspecular-specular; focused-blurred; and glare-nonglare.
Some of the remaining dimensions do not refer to any obvious features of the luminous environment: friendly-hostile; harmony-discord; frugal-lavish; open-dosed; mys-terious-obvious; and real-fantasy. Many other dimensions
might be metaphorically applied to the luminous environ-ment, but could just as readily be applied to numerous other aspecLs of any space: informal-formal; public-private ; old fashioned-modern ; uninteresting-interesting; cheerful-somber; pleasant-unpleasant; bad-good; natural-unnatural; commonplace-special; and functional-nonfunctional. Faced with response dimensions that do not refer to any salient aspects of the luminous environment, subjects in a typical lighting experiment must select some feature of the lighting, themselves, dle room, or past experience, that each dimen-SIOn might apply to and then give a rating. When response scales are applied metaphorically, we cannot expect different judges to apply the same metaphor in evaluating particular light settings, or single response dimensions to evoke similar metaphorical extensions across several different light settings. Nevertheless, metaphorical application of scales to
D K Tiller and M S Rea
stimuli may nut always be problematic. The cross modality matching procedures of psychophysics (e.g. Reference 5 pp 99-133) suggest that metaphorical extensions are legitimate, as long as different subjects use the same metaphor con-sistently to evaluate stimulus attributes. Here again, however, reduced ambiguity, both in terms of the stimulus and the response is very important.
Traditional psychophysical techniques present subjects with a standard stimulus (referred to as a modulus), that serves as a baseline against which all the stimuli to be judged in the actual experiment are comparedl5l. Subjects might be presented with a series of pre-experimental standards, one for each response dimension studied, that would limit the range of stimulus conditions presented during the actual experiment. So, for example, to define the salient and scal-able aspect of the visual environment referred to by the response dimension 'visually warm-visually cool', subjects could be placed into a room having fluorescent lamps with a high correlated colour temperature, where it would be explained that the lighting in the room would be rated as 'visually cool'. They would then be escorted into another room, where lamps with a lower correlated colour tem-perature had been installed, and told that the conditions in this second room would be rated as 'visually warm'. Any intermediate conditions observed during the experiment itself would be nlted accordingly', using the range of cat-egories on the response scale. This procedure would be repeated for each of the response dimensions included in any experiment. In this way, an attempt to ensure that different subjects use individual response dimensions con-sistently to scale the same aspects of different stimuli would have been made. This procedure might also limit range biases, as discussed by PoultonC28J.
4 .3 I ntercorrelations
The discussion up to this point has been argued from the position of traditional psychophysics, namely, that the stimulus must be well defined and the response clearly related to that stimulus. As suggested in the first part of this section, however, semantic differential scales may offer some hope for psychologists wanting to extract information about higher-order perceptual events by relaxing the adherence to these traditional psychophysical tenets. If experimental psychologists are hampered in their efforts to understand perception by restricting enquiry to those experiments where the stimulus and response are clearly defined, it seems unlikely that progress can be made in understanding higher-order perceptual events where the stimulus and the response are not precisely known. On the other hand, deliberate or inadvertent ignorance of rigorous experimental control and protocol, which require an understanding of the independent (stimulus) and dependent (response) variables, will only serve to confuse or mislead architects and lighting designers about perceptual phenomena. To break out ofthis dilemma, intercorrelation analyses like the one conducted in this paper may serve as the missing link between traditional psycho-physics and studies of higher-order subjective reactions. To appreciate this point better it is worth discussing the results of this analysis in more detail.
From the intercorrelations in Tables 1 and 2 and the sub-sequent analyses presented in Tables 3 and 4, it is clear that some scales are used inconsistently. Some of these inconsistencies are apparently reliable. For example, the
hazy-clear scale is used in a particularly inconsistent fashion.
It is not always associated in the same way with, say, the
50
good-bad scale. This means, in effect, that a 'clear' stimulus is 'good' sometimes, but not always. There are at least two possible interpretations of these results. The first is that the
hazy-clear scale was a meaningless and unreliable tool for measuring human subjective reactions because it was used inconsistently. A more interesting alternate interpretation is that the hazy-clear scale was, in fact, getting at something different than the other scales when the experimental con-ditions were assessed by subjects. However, one does not know from this analysis which interpretation is more likely. Therefore, at least two experiments must be performed in this line of research. The semantic differential scale should serve as a formal 'fishing expedition' for generating hypoth-eses that can be tested in a more rigorous psychophysical context. In other words, the results of semantic differential scaling experiments are, by themselves, meaningless, but coupled with a series of strategically planned experiments, they can serve as an invaluable first step in developing an undemanding of higher-order human reactions to lighted environments. Thus, the intercorrelation analysis may serve as the vital missing link in identifying those scales which subjects have used (consistently) in a peculiar fashion. It also serves to identify those scales which have been used in the same way and thus may help make the experimental procedures more efficient through identification of scale redundancies.
This leads us then, to return to the results of Rea's paperC29l
and speculate about the nature of the hazy-clear scale with the purpose of developing a hypothesis and proposing a new experiment. In effect, the following is an example of how one might proceed from the results of a semantic differential scaling experiment.
Examination of Table 5 shows that at the 90° desk orientation there was a high correlation between the 'clear' response and the 'good', 'easy', 'pleasant', 'stimulating', 'relaxing', and 'satisfied' responses. At the 0° orientation, however, these correlations were reduced or disappeared. Hence, some important factor other than lighting geometry could have been influencing the subjective responses, because the
hazy-clear response was not always clearly associated with the other subjective evaluations under this condition. Further detailed examination of the results in Table 5 shows that the correlations between 'clear' responses and 'good', 'easy', 'stimulating', 'relaxing', 'pleasant', and 'satisfied' responses were high when the linear polariser was used at 0". Since the linear polariserwas designed to reduce veiling reflections, as did rotation of the desk to 90°, it may be inferred that the
hazy-clear response, unlike the other identified responses, did not covary with changes in the amooot of veiling reflec-tions. Rather, a different factor influenced responses on this scale. To speculate, then, the targets may remain 'clear' at the 0° desk orientation, irrespective of contrast-reducing veiling reflections. When veiling reflections reduced the contrast of the print under the two other diffusers, the relationships between 'clear' ratings and the other more global responses breaks down. Hence, hazy-clear may relate to image quality (which always remains high), while the other, more global responses relate to contrast, or to a combination of many visual factors including contrast and image quality, that were modulated by veiling reflections. To test this hypothesis, a subsequent study should be conducted whereby both contrast and image quality are used as inde-pendent variables.
Although an hypothesis can be formulated about the mean-ing of the hazy-clear scale it should be carefully noted that
development of this hypothesis hinged upon an assumption about visual responses from other lines of enquiry (i.e. refraction and entoptic scatter) . It is stiJl unclear whether there is an answer to our earlier quesrion: 'Can semantic differential scales be used to reduce our uncertainty about higher-order human perception of lighted environments?' Is
there really a timulus for the scale spaciou.s-co11jined as Flynn proposed, or, as Osgood has suggested, arc responses of this
type simply metaphors for something simpler, like overall brighmess? Without an understanding of psychological responses from other lines of enquiry it may be impossible to move beyond semantic differential scales. It is certainly true that without ingenious experiments wruch may follow from the results of semantic differential scaling experiments, it will be impossible ever to resolve these alternative expla-nations.
In summary, without serious attempts by future exper-imental psychologists to perfonn a series of strategic experi· ments, lin.le progress will be made in developing an understanding of hjgher-order, subjective responses. Sem-antic differential scaling experiments arc meaningless by themselves, but can serve a the critical first step in devel-oping reasonable hypotheses about proposed higher-order phenomena. Such studies must be followed by rigorous psychophysical experiments where the stimulus and response have been cleady defu::ted.
.Acknowledgements
We thank M
J
Ouellette, R G Davis, P R Boyce and a referee for their constructive comments on earlier drafts of this work. This paper is a contribution from the Institute for Research in Construction, National Research Council of Canada, and the Lighting Research Center, Rensselaer Poly-technic Institute.References
Dillon R F and Vischer J C User Ma>UUJI: Tenant Questionnaire Survey
(Ottawa, Ontario: Architectural and Engineering Services, Public Works Canada) (1987)
2 Dillon R F and Vischer 1 C Derivation of the TeMtU Questionnaire Survey Assessment Method: Office Building Occupulll Survey Data Analy· sis (Ottawa, Ontario: Architectural and Engineering Services, Pubfk
Works Canada) (1987)
Gillette G and Brown M A Occupant Evaluarian ofCammercial Office Lighting Vol. I Methodology and Bibliography (Oak Ridge, TeMessee:
National Laboratory) (1986)
4 Flynn J E, Spencer T ], Martyniuk 0 and Hendrick C Interim study of procedures for investigating the effect of light on impressions and behavior]. filum. Eng. Soc. 3(2) 87-94 (1973)
Stevens S S Psychaplt.ysics: lnlroduction to ils Perceplual Neural and
Social Prospects (New York: Wiley) (1975)
6 Osgood C E The nature and measurement of meaning Psychological BuUetm 49(3) 197-237 ( 1952)
Vol. 24 No. 1 (1992)
Semantic differential scaling
Osgood C E Semantic space revisited Word 15(2) 192-200 (1959)
Osgood C E Studies on the generality of affective meaning systems
American Psychologist 17(1) 10-28 (1962)
9 Osgood CE FocusonMeaning(The Hague and Paris: Mouton)(l976) 10 Osgood C E, Suci G J and Tannenbawn P H The Mearuremem of
Meaning (Urbana: University of Illinois Press) (1957)
I I Bernecker C A and Mier 1 M The effect of source luminance on the perception of environment brightness J. Ilium . Eng. Soc. 15(1)
253-271 (1985)
12 Davis R G Computer graphics as a design tool Lighting Des. Applic. 16(6) 3S-40 (1986)
13 Davis R G and Bernecker C A An evah.1ation of computer graphic iinages of the lighted environment]. Ilium. Eng. Soc. 14(1) 493-514
(1984)
14 Davis R G and Gimhner D Light source color light level and sub· jective response: Evaluating the Kruithof curve]. Ilium. Eng. Soc.
19(1) 27-38 (1990)
15 Flynn J E A study of subjective responses to low energy and non· unifonn lighting systems Lighting Des .• '\pptic. 7(2) 6-15 (1977)
16 Flynn J E, Hendrick C, Spencer T J and Martyniuk 0 A guide to the methodology procedures for measuring subjective impressions in lighting]. lllum. Eng. Soc. 8(2) 95-110 (1979)
17 Flynn I E and Spencer T J The effects of light source color on user impression and satisfaction]. Ilium. Eng. Soc. 6(3) 167-179 (1977)
18 Flynn J E, Spencer T J, Martyniuk 0 and Hendrick C The influence of spatial light on huiiUin judgement Comptes Rendu, 18e Session p75-03, CIE Congress, London 39-46 (1975)
19 Flynn J E and Subisak G J A procedure for qualitative study of light level variations and system performance J. Ilium. Eng. Soc. 8(1) 23-35 (1978)
20 Golden P 1 The effects of lighting a public speaker upon observer impression Lighting Des. App/ic. 15(12) 37--43 (1985)
21 Hawkes R J, Loe D Land Rowlands E A note towards the under-standing of lighting quality]. Ilium. Eng. Soc. 8(2) lll-120 (1979)
22 Hughes P C and McNelis J F Lighting productivity and the work environment Lighting Des. App/ic. 8(12) 32--40 (1978)
23 McNelis J F, Howley J G, Dore G E and Delaney W B Subjective appraisal of colored scenes under various fluorescent lamp colors
Lighting Des. Applic. 15(6) 25-29 (1985)
24 Smith S W and Rea M S Relationships between office task per· formance and ratings of feelings and task evaluations under different light sources and levels Compces Retrdu, /9e session ?79-35, C/E Congress, Kyoto pp 207-2.11 (1979)
25 Campbell N R Proc . Symp. Measurement and its importat!Ce for phil-osophy Aristotelian Society Supplement 17 (London: Harrison) (1938)
26 Stevens S S On the theory of scales of measurement Science 103(2684)
677-080 (1946)
27 Torgerson W S Theory and Methods of Scaling (New York: Wiley)
(1958)
28 Poulton E C Observer bias Applied Ergonomics 6(1) 3-8 (1975)
29 Rea M S Calibration of subjective scaling responses Lighting Res. Techno/ . 14(3) 121-129 (1982)
30 Shaw DR Variation in inllrl'-scale correU.tiorJ an the semaruic differentral as a function of the concept judged MS Thesis, University of Illinois at
Urbana (1955)
31 Rea M S Visual perfonnance with rea iistic methods of changing contrast]. lllum. Eng. Soc. 10(13) 164-177 (1981)
32 Walpole R E lmroduction to Slatistics (3rd edn) (New York :
Ma<:-millan) (1982)
33 Edwards A L ExperimenUJl Design in Psychological Research (New
York: Holt Rinehart & Winston) (1960)
D K Tiller and M S Rea
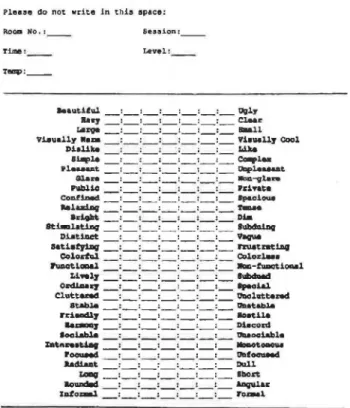
Appendix: Semantic differential scaling questionnaire used in Study 2
nセ G MMMM MMMMMMMMMMMMMMMMMM MM
tィゥN」セ@ アオ・セエゥッョョ。ゥイ・@ ie part of a lat"qer project atudying tho effoct of environmental hcton on セ・カ・イャ@ kJ.nds ot. hwaan behavior. Your task
today is to rate the 1\ood.e, feeling.s end i.mp.re.s.tions that the llqhtlnq
in this room creates for you u.3in; a :!erie.s of utinq scales.
The ratinQ"!I are to be done in the follo"'ing fllolnner. If you 1110uld
de!cribe the lighting in this room as vary good, you vould place a check
mark on ttlCI scale as snown below:
Bad_,_,_,_,_,_,
v-On the other hand, if you would describe the ll';Jhting in エィゥセ@ セッッュ@
Ul verv bad, your check mark .should be placed as follo"'s: . . d
v,_ ,_ ,_ ,_ ,_ ,_
-Use the intecudia.te cateqorie.e of the scale to indicate
inte.rmecU.ate judgeraents. Be sure to read both キッイセ@ at each end. of 1
scale before you decide vhera to place your check marlr.. Then are no
riqht or wronq anaweu: we are interested only in you.r subjective,
ju.dguwnt concerning the roOD' 1 appear•nce un<le.r it.o pre.,-ent lighting
l!yotem.
AftaJ: CQ!IIpl•ting this aet of .ratlng3, ve will .arranqe three other
times lor you to return to rate otha.r styles of roam lightinq. Thrae
other return .appointMnt8 will b& mad.e before you leave tod.ay.
Now plea.se turn the pAge, ancl rate your s@jectiva illpxeuiona o!
the liqohtinq in thio room U3inq the t"otinq .sc:ale11 provided. Thank you.
Plea.se do not write in this apace:
RoQD No.: _ _ Se.sl!ion: _ _
Ume: _ _ Level: _ _
Tlllq): _ _
Figure Al
52
•.