How important are interview methods and questionnaire
designs in research on self-reported juvenile delinquency?
An experimental comparison of Internet
vs paper-and-pencil questionnaires and different
definitions of the reference period
Sonia Lucia&Leslie Herrmann&Martin Killias
Published online: 20 February 2007
#Springer Science + Business Media B.V. 2007
Abstract There has been relatively little change over recent decades in the methods used in research on reported delinquency. Face-to-face interviews and self-administered interviews in the classroom are still the predominant alternatives envisaged. New methods have been brought into the picture by recent computer technology, the Internet, and an increasing availability of computer equipment and Internet access in schools. In the autumn of 2004, a controlled experiment was conducted with 1,203 students in Lausanne (Switzerland), where“paper-and-pencil” questionnaires were compared with computer-assisted interviews through the Internet. The experiment included a test of two different definitions of the (same) reference period. After the introductory question (“Did you ever...”), students were asked how many times they had done it (or experienced it), if ever,“over the last 12 months” or “since the October 2003 vacation”. Few significant differences were found between the results obtained by the two methods and for the two definitions of the reference period, in the answers concerning victimisation, self-reported delinquency, drug use, failure to respond (missing data). Students were found to be more motivated to respond through the Internet, take less time for filling out the questionnaire, and were apparently more confident of privacy, while the school principals were less reluctant to allow classes to be interviewed through the Internet. The Internet method also involves considerable cost reductions, which is a critical advantage if self-reported delinquency surveys are to become a routinely applied method of evaluation, particularly so in countries with limited resources. On balance, the Internet may be instrumental in making research on self-reported delinquency far more feasible in situations where limited resources so far have prevented its implementation.
DOI 10.1007/s11292-007-9025-1
S. Lucia (*)
:
L. Herrmann:
M. KilliasEcole des sciences criminelles, University of Lausanne, 1015 Lausanne, Switzerland e-mail: [email protected]
Key words internet survey . research method . self-reported juvenile delinquency . time reference period
Introduction
In this paper we first give an overview of the methods used in research on self-reported delinquency of juveniles. After a summary of the state of knowledge, we present a randomised experiment conducted with more than 1,200 students in a medium-sized Swiss city (Lausanne, Lake Geneva region) having a population of approximately 150,000, or about 500,000 if the suburbs are included. It will be shown that interviewing students on self-reported delinquency and victimisation through Internet questionnaires is feasible. This method was shown to have little effect on the response behaviour, including answers and missing data. In view of the many advantages of Internet interviews in terms of administration, and in view of the positive attitude of students and schools toward this method, this new ap-proach would be instrumental in making interviews with students on such subjects even more popular, particularly so in countries where research budgets are limited, and would allow a considerable increase in the size of international, national and local samples.
Background: current methods of interviewing on self-reported delinquency
Compared with victimisation surveys, interviewing on self-reported delinquency has remained relatively traditional. During the methodological debate preceding the first International Self-reported Delinquency (ISRD) Survey of 1992 (ISRD-1, Junger-Tas, Terlouw & Klein,1994), the question of computer-assisted telephone surveys had been briefly discussed but rapidly dismissed, because of a lack of relevant pre-tests of self-reported delinquency (Klein,1989). A consensus was rapidly reached that face-to-face interviewing was the most reliable method. Interviewing in the classroom was dismissed at that time, because the samples were supposed to include age brackets (up to age 20 years) beyond compulsory school age in many countries. It is not clear whether findings based on interviews in the home setting produce results comparable to written interviews in the classroom. Some types of behaviour that may be sensitive to reveal in the household may not be sensitive for reporting in a classroom setting, and vice versa (Gfroerer, 1996). Some researchers found no difference in adolescent reports of sensitive information given in home and school settings (O’Malley, Bachman & Johnston,1983; Zanes & Matsoukas,1979); other researchers did find such differences. Needle, McCubbin, Lorence and Hochhauser (1983) found that adolescents interviewed at home reported a lower mean lifetime use of cigarette and beer than did adolescents interviewed at school, indicating that the presence of parents influenced their responses. Turner, Lesser, George, Hubbard and Witt (1992) found that the presence of a parent during a household interview inhibited the reporting of drug use, particularly by respondents 12 to 17 years of age. Johnston and O’Malley (1985) indicated that one of the major advantages of conducting a survey of adolescents in a school setting is that anonymity can be
assured; home surveys are less anonymous. Furthermore, adolescents can answer sensitive questions as to illicit behaviour without their parents or other family members being present. Information coming from controlled experiments shows that, at home, adolescents are more willing to provide sensitive information to the computer than to an interviewer or on self-administered questionnaires (Turner, Ku, Sonenstein & Pelck, 1996; Wright, Aquilino, & Supple, 1998). In a quasi-experimental test with two parallel samples conducted in two west German cities (Freiburg and Cologne), Oberwittler and Naplava (2002) compared interviews of young people of 15 years in the classroom (on a self-administered, written questionnaire) and through the classical face-to-face method (with a self-administered self-report part). This test showed that interviews in the classroom are feasible, cost less, and would produce a better representation of students from lower classes and immigrant background. The results did not differ dramatically, inasmuch as interviews in the classroom provided slightly higher rates of self-reported offences and lower victimisation rates. Response differences could be noted across modes. Concerning self-reported delinquency, the analysis revealed large differences, both in the prevalence of delinquency and its correlations with independent variables such as minority status or low socio-economic status (SES). The authors explained the different rates by a selection effect, whereas the correlations they observed might also have supported a mode effect related to the interview situation.
Nowadays, paper-and-pencil (P&Ps) surveys in classrooms are a common practice in empirical adolescence research. Beyond the test by Oberwittler and Naplava (2002), this technique has been successful in other international studies, such as the multi-site survey on school violence conducted by the Kriminologisches Institut Niedersachsen (KFN) in Hanover (Wetzels, Enzmann, Mecklenburg, & Pfeiffer, 2000), and was applied in several other cities, including Zurich (Eisner, Manzoni, & Ribeaud,2000). In some countries, improvements were noticed when the students were seated in rooms that were larger than the usual classroom, leaving a generous space between them, and were asked to drop the completed self-administrated questionnaire into a ballot box (Killias,2002, p. 266). These improvements touch mainly upon the anonymity of personal data and, thus, may increase responses on sensitive items. Already during ISRD-1, Switzerland (Killias, Villettaz & Rabasa,1994) and other countries using face-to-face interviews have applied the sealed envelope technique (Becker & Günther,2004).
Interviewing through the Internet in the classroom
In recent years schools have made considerable progress in the use of computers. Many secondary schools throughout Europe may by now have a computer room where students are being taught how to use computer technology. This should make it possible, at least theoretically, to replace classical self-administered questionnaires (using paper and pencil) by computer-assisted interviews (CAIs) in the school’s computer room. A major school-based survey using computer-assisted Internet interviews has been conducted in the Netherlands (Weerman et al., 2003). Haines, Case, Isled and Hancock (2004) applied interactive computer-assisted self interviewing over a 5-years period to 5,000 young people in Wales and internationally. They showed that this instrument provides reliable and valid results
(Haines et al., 2001; Haines & Case, 2003; Case & Haines, 2004, cited by Haines et al.,2004).
Several studies have suggested that the level of privacy in the various modes of interviewing may dramatically affect the survey measurements of sensitive behaviours (Jones & Forrest,1992; Turner, Danella & Rogers,1995). Traditionally, surveys have attempted to encourage more accurate reporting of sensitive behaviour by combining face-to-face interviews with a self-administered P&P questionnaire to be handed over to the interviewer in a sealed envelope (Killias et al.,1994; Becker & Günter, 2004). Some respondents may still remain suspicious as to the privacy of their responses, especially if an identification number is recorded on the questionnaire. Another criticism of P&P questionnaires is the difficulties arising in the extensive use of contingent questioning (that is, branching or skip patterns). Even well-educated respondents may have trouble following the instructions for navigating through a complex self-administered form (Jenkins 1997, cited by Turner et al.,1998). New and innovative methods are required to improve the validity of the data (Gfroerer,1996), because, increasingly, respondents are being asked sensitive questions (Tourangeau & Smith,1996) on topics such as sexual behaviour, drug use, and illegal activities. More recently, Fendrich et al. (2004) compared self-reported data from computer-assisted interviews with biological drug testing among adults (18 to 40 years). Here, the interviews suggested a higher prevalence of marijuana use and lower rates of cocaine and heroin use than found in the drug tests. Under-reporting of recent drug use was apparent in interviews for all three substances. Subjects were more likely to under-report cocaine use than marijuana use and, more generally, the more recent use of any of these substances, which is consistent with the idea that disclosure is affected by the sensitivity of behaviour.
Many studies that collect such information have used computer-assisted interviewing, including computer-assisted self-interviewing (CASI) and audio computer-assisted self-interviewing (Audio-CASI). Beebe, Harrison, McRae, Anderson and Fulkerson (1998) evaluated the impact of a computerised self-administered questionnaire on the collection of sensitive information in a school survey of adolescents. They compared the reports of sensitive information obtained by computers with those obtained by the more traditional P&P method in the case of students that were randomly assigned to the two survey conditions. In the computer room some contextual information, such as the number of students in the room, the distance between students, and whether the computer was networked before the student was logged out and the responses saved onto a floppy disk, was taken into account. It was found, as a tendency, that a higher percentage of students reported an individual item in the P&P version rather than in the computerised version. These results are quite different from those obtained in similar studies conducted in household settings (Turner et al.,1996; Wright, Aquilino, & Supple, 1998) and in research on the effects of computer surveys on the disclosure of sensitive information in general (Weisband & Kiesler, 1996, cited by Beebe et al.,1998). In fact, perceived privacy among respondents increases with the distance between computers in the same room. Weisband and Kiesler (1996, cited by Beebe et al., 1998) found no apparent differences between P&P and computer questionnaires so long as the computers were at least five feet apart. These results suggest that the relatively small distance between many of the students who used computers accounts
for the different finding reported by Beebe et al. (1998). They concluded that the effects of student proximity may have been exacerbated by the interface utilised in their study. In fact, the programme left the answers on the screen while the student moved the cursor to a“continue” button, thus potentially exposing his answers to others. In contrast, some CAI programmes refresh the screen as soon as the respondent hits a key for the answer. Weisband and Kiesler (1996, cited by Beebe et al., 1998) suggested that such differences in the computer interfaces may affect disclosure. In their study, Turner et al. (1998) randomly assigned 1,690 subjects to either an audio-computer-assisted self-interviewing (audio-CASI) or to a more traditional self-administered questionnaire (P&P), in order to measure highly sensitive behaviour. Young men aged 15 to 19 years were much more likely to report risky behaviour when interviewed with audio-CASI measurement technology. The technology appears to have a more pronounced effect on the reporting of behaviour that is particularly sensitive, stigmatised, or subject to serious legal sanctions, than on less sensitive areas of conduct. In conclusion, the greater privacy offered by audio-CASI technology may reduce under-reporting.
Several studies have specifically evaluated the comparability of computer-based (CB) and P&P questionnaires used for adults (Mead & Drasgow, 1993; Hetter, Segall & Bloxom,1997). Thus, Choi and Tinkler (2002) mentioned that, despite the straightforward nature of the process of “computerising” P&P items, one cannot simply assume that CB or a Web-based (WB) system is equivalent to P&P items. Findings from previous studies should not be generalised to other, similar situations. In their study, Choi and Tinkler (2002) evaluated the score comparability, in mathematics and reading tests, of CB and P&P items administered to 800 third- and tenth-grade students. They found that Web-based online assessments have a great potential in large-scale student assessments. In fact, online assessments provide immediate feedback on students and reduce the massive printing and mailing costs of distributing P&P test materials for a large-scale assessment programme. The challenge is to produce CB scores that are comparable to their traditional P&P counterparts when the administration mode of the test changes. Not only the types of items should be taken into account, but also the effects of format or design on the levels of unit and item response or on data quality. It has been shown that there are systematic effects of design on the behaviour of respondents in Web surveys. Already in the 1970s, Wright and Barnard (1975, 1978, cited by Jenkins & Dillman, 1997) had written that the problems of completing self-administered questionnaires fell into two categories: problems with the language used, and problems arising from the way information is arranged in space. Self-administered surveys, whether on paper or through the Web, rely on both verbal (question wording) and visual information to communicate with respondents (Jenkins & Dillman,1997; Redline & Dillman, 1999). Different authors (Sanchez, 1992/Smith, 1995, both cited by Couper et al.,2001) reported several examples where unintentional layout changes produced differences in both self-administered and interviewer-administered sur-veys, while Dillman, Redline and Carley-Baxter (1999) showed how routing or skip errors are affected by the design of a paper questionnaire. Different experiments on design approaches have been assessed in Web surveys. For example, Couper et al. (2001) assessed the effect of having or not having a progress indicator. They also compared the differences between presenting related items on one screen and
presenting one question per screen. Finally, they tested the influence between clicked radio buttons and entering a numeric response in a long-text or short-text box.
Rather than arguing for one approach over another for all applications, these results suggest that Web survey design should reflect the particular task at stake. Together with question wording, the presentation of the items in a Web survey can and does provide guidance to respondents on what kinds of answers are being sought, as they often do in other interviewing contexts. Design also affects the efficiency with which respondents complete a Web survey, which may be an important consideration in reducing burden and minimising incompleteness and non-response.
Definition of the reference period
In general, scholars are highly concerned about the impact of different interview methods. For example, the advent of computer-assisted telephone interviews (CATIs) in victimisation studies provoked considerable debate, particularly in continental Europe (Killias,2002, pp. 69–73). Of course, concern about the effects of any change in methodology requires comment. However, researchers used to be far less concerned about the influence produced in respondents by different wordings in a questionnaire. In an experimental test of two different versions of an otherwise identical questionnaire in the Netherlands, Scherpenzeel (1992) had shown, however, that respondents reported between two to three times higher rates of robbery and burglary victimisation once they were asked whether or not they had been victims of any such offence “over the last 12 months”, than they did in the other version used in the International Crime Victimisation Surveys (van Dijk, Mayhew & Killias, 1990), where respondents were first asked whether they experienced any such incident “over the last 5 years”, and, if so, “when, more precisely, it had taken place” (namely during the last year or earlier). The experiment by Scherpenzeel (1992), as well as several randomised experiments in Germany (Schwind, Fetchenhauer, Alhborn, & Weiss,2001; Kury,1994) and in Switzerland (Scherpenzeel,2001), showed at the same time that victimisation rates differed only slightly between CATIs, written questionnaires, and personal interviews. Thus, the way the definition of the reference period is phrased turned out to be far more crucial than the interview method. In the present context, we therefore varied the way the reference period was defined, and tested two versions experimentally within the P&P sample (see below,“The two reference periods”).
Our questionnaire
Methods have been tested so far in many studies, but this has been done in different contexts, such as self-administered written questionnaires in a classroom vs face-to-face interviews in household settings. It is a difficulty in many studies that, whenever differences are found, it is hard to tell whether they reflect the method or the context. Therefore, we decided to conduct a controlled experiment comparing computer-assisted interviews through the Internet with P&P questionnaires. In our test the same self-administered questionnaire was tested in schools with students aged 14 to 16 years, once on paper and once on the computer.
We started with a small controlled experiment involving 181 students aged approximately 14 years from ten classes of grade 8. Having compared the two methods in this experiment, we have then been able to improve the method, and a second trial was performed with 1,203 students of grades 8 and 9 (aged 14 to 16 years) who were interviewed in 56 classes.
Some important points mentioned in the literature have been taken in account. First, we tried to motivate respondents by making the questionnaire quite “user-friendly", by using colours but, at the same time, avoiding too many visual features so as not to distract the respondent from the task of answering the questions seriously. In brief, we tried to develop a design that was as friendly as it was sober. We decided not to use a progress indicator, in order to prevent students from noticing too quickly that answering“yes” increased the length of the questionnaire.
In Switzerland most schools have the same type of computer (Macintosh) and use the same browsers (Safari), which means that the questionnaire always appears on the screen in the same way. Our questionnaire includes around 50 general questions and more than 700 follow-up questions. Thus, we grouped questions when this made sense, in much the same way as in the P&P version where questions concerning one topic (for example: school, grade, gender, age) are displayed on one page in order to avoid scrolling as much as possible. Before going to the next page, respondents had to mark a box“go to following page”, thus leaving them the time needed to check, and eventually correct, any answers given to any questions on the screen. Thus, corrections could be made with comparable ease in the paper-and-pencil version and in the Internet version. Moreover, when the items were part of a scale (implying a strong correlation among the items), we presented them as far as possible on one screen. Different studies have shown that fewer data are missing when radio buttons are used, as in our questionnaire. A short box is used whenever the respondents had to answer with a number (for example,“How many times did you do...?”). A short box is also used to add a category that is not on the list presented. In fact, short boxes allow the respondents to answer without being forced into pre-fixed categories. We used the long-box entry only a few times in order to allow the respondents to add comments but without expecting any information from this.
Distance between students (Beebe et al.,1998) has not been formally controlled, but students were seated with sufficient space between them. Since one-half of the students in each class were interviewed in the computer room, sufficient space was available to leave one seat empty between any two students filling out a written questionnaire. In the computer room each student was seated in front of“his/her” computer presenting the programme before starting the questionnaire. The computer teacher was present in order to assist in the case of unforeseen technical problems.1 Each answer given was recorded online in a database that is hosted on a Web-server of the University of Lausanne. Once a student responds to any item, the questionnaire will automatically jump to the next relevant question, leaving out all those that are no longer of interest, given the answer to the preceding one. Corrections are also possible. All these features are consistent with many of the 1
In the present test the first author was present at all sessions in Cossonay. During the second test, supervision was less systematic, because the presence of computer teachers turned out to be more decisive. Once duly instructed, they could easily replace researchers as supervisors.
advantages of computer-assisted telephone interviews or computer-assisted person-nel interviews (CATIs/CAPIs). Beyond these advantages, students do need less time, since, being immediately led to the next relevant question, they do not have to read questions that do not apply. They also have more fun in doing this job, whereas filling out a self-administered questionnaire may remind students more of a written examination. Finally, teaching students how to fill out a questionnaire over the computer is also more consistent with the school’s educational mission.
As found when comparing computer-assisted with classical personal interview techniques, the major advantages of the new method are:
– fast availability of the results, all responses being quickly accessible,
– the low financial burden, since, for a questionnaire of the length implied here, data entry takes at least 25 minutes for a well-trained student and costs at least €10 each when controls are included, or about €20,000 for a sample of 2,000 students.
Beyond these and other potential advantages, the important issue to be addressed is that of finding out whether computer-assisted interviews through the Internet will produce results similar to those of traditional“paper-and-pencil” questionnaires. The results of our controlled experiments offer new insights into this question.
Simultaneously, and in order to learn more about the effects of different ways of defining the reference period, we tested two versions of the paper-and-pencil questionnaire. Details are given in the section“The two reference periods”. So far, scholars had been very much concerned about respondents “forgetting” to report certain incidents, but they were far less worried about telescoping effects, although the latter can distort results to at least the same extent (Killias,2002, pp. 74–78).
The controlled experiment
As a first step, a small controlled experiment was conducted in two local schools near Lausanne, involving 181 students of grade 8, which compared interviews with classical paper-and-pencil questionnaires and through the Internet. This pre-test showed that the two methods gave similar results and that Internet interviews are feasible for a study on self-reported delinquency in a student population aged about 15 years.
The programme used in the present experiment was PHP Surveyor, i.e. a set of PHP scripts that interact with MySQL to develop surveys, publish surveys, and collect responses to surveys. Once a survey has been created, it can be published as an online survey (displayed as single questions, groups of questions, or all questions on one page), or a data entry system can be used for administration of paper-based versions of the survey.
Because of the dichotomous or dual nature of all data used in this paper, all rates in the following tables have been tested for significance using chi-squared. We present a number of comparisons in each table and recognise that the use of a large number of significance tests at the 0.05 alpha level is likely to result in a number of statistically significant results just by chance. Since we want to be particularly sensitive to possible differences between the different approaches, we decided not to
correct for multiple test bias, which would have resulted in more stringent significance thresholds. Nonetheless, when a large number of tests were run, we were cautious not to make too much of the results gained. In all tables N refers to the total sample under each experimental condition (including missing values).
Random assignment to Internet or P&P
During October 2004, a far larger experiment, involving 1,203 students, was conducted in the schools of the city of Lausanne (Lake Geneva, Switzerland). The procedure of randomisation was as follows: the student seated next to the door was assigned number 1; after him/her, all other students were numbered in increasing order, i.e. number 2, 3, 4, etc. The teacher had to look up, on a table handed over to him, the column corresponding to the number of each student in his or her class. For each column, the teacher had a list of random numbers created by our computer program for each student. According to the number of computers available in the computer room, the teacher then called the first 12 to 15 students numbered under that column to proceed to the computer room. For example, in a class of 20 students with 12 computers available, the teacher had to send students with the random numbers 19, 9, 12, 2, 13, 4, 14, 3, 20, 15, 11, and 18 to the computer room; the remaining eight students (random numbers 6, 7, 10, 16, 17, 8, 5, and 1) stayed in the classroom, where they received a P&P questionnaire. The purpose was to use all computers available. Therefore, the sample interviewed through the Internet was 615 vs 588 interviewed by P&P.
The students assigned to P&P randomly received one of the two versions of the written questionnaire (see“The two reference periods”). The numbers were entirely equal (308 vs 280), the “12-month” version being systematically used as the first option.
This procedure produced samples of very similar demographic composition. We also found no significant differences in the reporting of non-sensitive information, such as family structure, belonging to a group of friends, or attachment to school.
The student population studied included the full scale of programmes available at that level (i.e. a track leading later to the“baccalauréat” or high school diploma, a medium-level track usually leading to more qualified apprenticeships, and a lower-level track leading to less qualified jobs).
MA students of the Ecole des sciences criminelles at Lausanne University supervised interviews in the classroom using “paper-and-pencil” questionnaires. In the computer room, in most cases, the computer teacher was the supervisor; after some time, it was felt that an MA student did not have to be present, since students hardly raised questions while filling out the questionnaire on the computer. Compared with paper, the computer offers more privacy, at least so long as the teacher (or any other person) is not standing directly behind the respondent; even in such a case, a person standing behind could at best see the answers given on a particular page, while answers given on a paper-and-pencil questionnaire remain visible on all pages. Computer teachers usually are not acting as class teachers and, therefore, are not considered so much as “authority figures” by the students. The presence of such a person was judged necessary to assure the smooth functioning of computer equipment and Internet connections. Contrary to filling out a
paper-and-pencil questionnaire, students at a computer are kept busy, which makes it much easier than in the classroom to maintain discipline.
The two reference periods
In the present questionnaire, students were asked, with respect to victimisation, drug use, as well as delinquency items, whether they had ever experienced them, and, if so, how many times it had happened over the last year. The paper and Internet questionnaires did not differ in lifetime prevalences2, but the paper-and-pencil questionnaire was presented in two versions, each given to one-half of that sample. In order to test the effect of different definitions of the “last-year” reference period, students assigned to P&P were randomly assigned to the two versions. In the “P&P” version (filled out by 588 students), the time limit (for the reference period) was phrased in one of the following two ways:
(A) “How often did you do this....over the last 12 months?”
(B) “How often did you do this....since the school vacation of October 2003?” Two hundred and eighty students randomly received a questionnaire asking “Since October 2003”, and 308 received one asking “During the last 12 months”. The interviews took place between mid-October and early November 2004. Thus, the period“since the October 2003 vacation” was slightly longer (on average, about 12.5 months). Since only version A was available over the Internet, the comparison for all last-year rates included only those students of the“P&P” condition who were assigned to questionnaire version A. Lifetime rates were compared using the full samples (615 on the Internet and 588 on“P&P”), since versions A and B did not differ on how lifetime prevalence questions were phrased.
In the following section, lifetime prevalence rates are compared across the interview methods, using the full sample of 1,203 students and the chi-squared tests. In the section “Effect of different definitions of the reference period”, the results concerning the effect of the two definitions of reference period (“over the last 12 months” versus “since the October 2003 vacation”) are presented. In “Last-year prevalence rates by interview method”, the comparison of the two methods on last-year prevalence rates (923 students) are presented.
Results
Lifetime prevalence rates by interview method
Victimisation by interview method (lifetime)
Table1 shows the prevalence of the several types of victimisation over the entire lifetime, as well as an overall measure of victimisation.
2
This test was limited to the paper–pencil questionnaire, the reason being that this questionnaire could be far more easily presented in two versions.
The results shown in Table1indicate that reports on victimisation does not differ between the two interview methods.
Self-reported use of substances by interview method (lifetime)
Rates of self-reported use of several substances over the entire lifetime are presented in Table2.
Table2shows that rates of self-reported drug use do not significantly differ across interview conditions.
Delinquency scores by interview method (lifetime)
In Table3 we observe two strong differences out of 22 comparisons (P<0.01), the rate for vandalism being higher, the rate for driving without licence being lower, under the“P&P” condition. In two cases there is a marginally significant trend towards differences: theft at home and selling of soft drugs (P<0.05). Overall, rates are sig-nificantly higher under the P&P and under the Internet condition in two cases each.
Effect of different definitions of the reference period
Although the school vacation of 2 weeks during October is far from being a landmark in a child’s subjective calendar, it may be helpful in testing the effect of limiting more precisely the beginning of the reference period, compared with the usual“over the last 12 months” phrase where the limit may be far less compelling for the respondent. Results of this test are presented in this section.
Percentage Victimised P&P (N=588) Internet (N=615)
Robbery 9.7 8.8
Racket (extortion) 5.2 5.1
Sexual assault 4.8 5.1
Assault 10.7 12.9
All victimisations 23.0 24.0 Table 1 Lifetime prevalence of
victimisation in the two groups by interview method, in percentages
Users (%) P&P (N=588) Internet (N=615) Beer, wine, alcopops 62.5 62.2
Strong alcohol 44.0 41.7 Cigarettes, tobacco 44.1 48.3 Marijuana, hashish 22.7 18.9 Heroin 1.1 1.3 Cocaine 1.6 0.5 Ecstasy 2.2 1.0 LSD/hallucinogens 2.7 1.3 Speed/amphetamines 1.1 1.2
Table 2 Lifetime prevalence of self-reported drug use by inter-view method, in percentages
Victimisation by reference period
Table 4 shows that victimisation rates tend to be consistently (although not significantly) higher under the“during the last 12 months” condition. These results match earlier findings of Dutch experimental research (Scherpenzeel, 1992). Whenever the limit is more“subtle”, victims may be willing to report incidents as “recent” although, strictly speaking, they had occurred prior to the last 12 months. Contrary to the Scherpenzeel (1992) experiment, this tendency is visible in our data, even though victims in a first step were invited to indicate any such experiences over their entire lifetime. Despite this opportunity to report all incidences, a more clearly defined temporal limit seems to be taken more seriously and keeps respondents from “cheating” by including all experiences as “recent”.
Table 3 Lifetime prevalence of self-reported delinquency by interview method, in percentages
Deviant Behaviour (% Admitting) P&P (N=588) Internet (N=615)
Truancy 26.0 24.8
Running away 7.1 6.3
Driving without licence 36.8 44.4 P≤ 0.01
Shoplifting (more than€35) 12.8 13.4
Shoplifting (less than€35) 38.4 39.7
Breaking into a car 1.9 2.6
Harassing somebody in the street 11.1 12.0
Theft at school 20.9 21.8
Theft at home 12.6 17.1 P≤ 0.05
Fare dodging 66.0 63.6
Vehicle theft 6.0 5.8
Theft of an object from a vehicle 4.7 5.9
Assault 15.3 13.3
Threats with gun/knife 4.1 3.6
Racket 1.4 1.3
Robbery 3.8 3.8
Arson 5.2 4.4
Selling soft drugs 7.8 4.8 P≤ 0.05
Selling hard drugs 1.4 1.2
Graffiti 21.8 20.4
Vandalism 17.3 10.9 P≤ 0.01
Theft from the person 17.9 14.6
Percentage Victimised
“Since School Vacation of October 2003” (N=280)
“During the Last 12 Months” (N=308) Robbery 3.2 4.9 Racket (extortion) 1.1 2.6 Sexual assault 1.1 2.6 Assault 4.6 7.1 All victimisations 8.6 13.0
Table 4 Victimisation rates by definition of the reference period (“12 months” vs “October 2003”)
Self-reported use of substances by reference period
Table5shows quite similar rates of self-reported drug use for both time limits, with a few (insignificant) exceptions regarding illegal drugs where rates are generally low. In interpreting these results, one should also take into account the low absolute frequencies. In order to avoid the problem of low frequencies, we collected drugs into just two categories in Table6. No significant difference emerges.
Delinquency scores by reference period
Table 7 shows that the two time limits produced similar rates of self-reported delinquency, just as found for the use of substances. No significant difference is found. The results presented in Tables 4,5, 6 and 7 suggest that respondents may be influenced by the definition of the reference period, more in connection with victimisation and drug use than in relation to delinquency. For self-reported delinquency (SRD) items, the way the temporal limit is framed apparently does not matter. However, for victimisation items, although there is no significant difference, the “12-month” version seems to cause higher rates than the “last October” version. Formulae like “over the last 12 months” may easily be understood by some respondents as meaning “what fairly recent experience comes to your mind?”, whereas clear-cut time limits may be taken more seriously. A feasible explanation may be that victims (and particularly those who experienced serious crimes) may appreciate having an opportunity to report whatever they may have lived, whereas reporting delinquent acts or drug use may not be as“rewarding” for the respondent. Therefore, respondents may be more inclined to respect the time limit (however phrased) when it comes to delinquency or otherwise less desirable acts, whereas victims will try to include whatever they can as long as the reference period does not make it absolutely clear that certain incidences are no longer relevant. Although, in the present case, the questionnaire allowed victims in the first
Table 5 Substance use by definition of the reference period (“12 months” vs “October 2003”) Users (%) “Since School Vacation of October 2003”
(N=280)
“During the Last 12 Months” (N=308) Beer, wine, alcopops 57.8 60.3 Strong alcohol 42.4 41.1 Cigarettes, tobacco 41.8 36.2 Marijuana, hashish 19.9 21.8 Heroin 0.4 1.7 Cocaine 1.1 1.7 Ecstasy 1.5 2.7 LSD, hallucinogens 2.3 3.1 Speed, amphetamines 0.4 1.4
place to report any offences experienced over the entire lifetime, the telescoping of older incidents into the last-year period could not be entirely prevented.
Last-year prevalence rates by interview method
In this section last-year prevalence rates of victimisation, drug use and offending, measured by Internet vs Paper-and-pencil, will be compared. As mentioned in the sections “The two reference periods” and “Effect of different definitions of the reference period”, the paper-and-pencil version included an experimental test of two different definitions of the (same) reference period. Therefore, only students who, under the paper-and-pencil condition, had the same questionnaire as in the Internet
Deviant Behaviour (% Admitting) “Since School Vacation of October 2003” (N=280) “During the Last 12 Months” (N=308) Truancy 20.8 18.8 Running away 6.2 3.6
Driving without licence 26.3 33.6 Shoplifting (more than€35) 8.3 10.4 Shoplifting (less than€35) 29.1 24.4
Breaking into a car 1.4 1.3
Harassing somebody in the street 8.7 9.3 Theft at school 12.4 13.1 Theft at home 8.0 7.6 Fare dodging 50.4 51.8 Vehicle theft 4.7 4.0 Theft of an object from a vehicle 4.0 4.3 Assault 9.5 10.9
Threats with gun/knife 2.5 3.3
Racket 1.1 1.0
Robbery 3.6 2.0
Arson 4.3 3.0
Selling soft drugs 4.4 7.6
Selling hard drugs 0.4 1.7
Graffiti 17.8 16.3
Vandalism 10.9 11.2
Theft from the person 12.6 11.1 Table 7 Delinquency rates by
definition of the reference period (“12 months” vs “October 2003”)
Table 6 Use of“soft” vs “hard” drugs by definition of the reference period (“12 months” vs “October 2003”)
Users (%) “Since School Vacation of October 2003” (N=280)
“During the Last 12 Months” (N=308)
Soft drugs (alcohol, cigarette/ tobacco, cannabis/marijuana)
68.5 71.1
Hard drugs (heroin, coke, XTC, speed, LSD)
version (with a reference period of 12 months) have been considered in the following comparisons of the two interview methods. Thus, the number of person interviewed under the “P&P” condition is reduced from 588 to 308, while the Internet sample remains unchanged (615).
Victimisation by interview method (12 months)
Table8 gives the rates of victimisation over the last 12 months.
In Table8, higher rates are found in the “P&P” version in all five comparisons, whereas rates were more equal when lifetime prevalence rates were considered (as in Table1). However, just was as found for the lifetime prevalence rates, no significant difference is found regarding last-year rates.
Self-reported use of substances by interview method (12 months)
Table9shows that the results do not significantly differ across interview conditions, with the exception of the use of LSD/hallucinogens, which is significantly more often admitted in the “P&P” method. Compared with lifetime prevalence rates (Table 2), where the picture is more balanced, the results in Table9 are similar to those observed for victimisation (Table8), in so far as drug use, apart from smoking cigarettes and tobacco, is more often admitted under the“P&P” condition. We shall return to this surprising difference between lifetime and last-year comparisons in the discussion section. However, use of hard drugs being too rare in our sample to allow
Table 9 Last-year prevalence of self-reported drug use by interview method, in percentages
Users (%) P&P
(N=308)
Internet (N=615) Beer, wine, alcopops 60.3 57.0
Strong alcohol 41.1 38.2
Cigarettes, tobacco 36.2 36.6
Marijuana, hashish 21.8 16.8
Heroin 1.7 1.2
Cocaine 1.7 0.5
Ecstasy 2.7 0.5 Marginal cell frequencies < 5a
LSD, hallucinogens 3.1 1.2 P≤0.05
Speed, amphetamines 1.4 0.7
aNo significance test possible
Percentage Victimised P&P (N=308) Internet (N=615)
Robbery 4.9 4.8
Racket (extortion) 2.6 2.2
Sexual assault 2.6 1.5
Assault 7.1 4.2
All victimisations 13.0 10.9 Table 8 Last-year prevalence
(in percentages) of victimisation by interview method
valid significance tests, all soft and hard drugs have been collected into two categories. No significant difference emerges (Table10).
Delinquency scores by interview method (12 months)
Table11gives 12-month rates for all SRD items for the two randomised groups. In Table11we observe only three significant differences out of 22 comparisons: the rate for selling soft drugs, vandalism, and theft from the person, all of them being higher under the“P&P” condition. Once more, however, last-year prevalence rates under the“P&P” condition tend to exceed those under the Internet condition more often than in Table3, where lifetime rates have been compared.
Summary of comparisons between paper-and-pencil and Internet
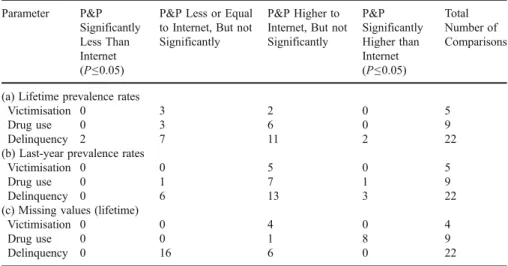
Given the somewhat contradictory outcomes, all comparisons between P&P and Internet interviews on victimisation, drug use, and delinquency are presented in Table12, both for lifetime (Table12a) and for last-year prevalence rates (Table12b). In addition to prevalence rates, Table12c extends the comparison to missing values, i.e. situations where respondents did not answer certain items (“jumping”, i.e. leaving the appropriate box blank). The possibilities of non-response (or giving answers such as“I do not know”) or “jumping” certain items were strictly identical on both the Internet and the P&P questionnaire. Therefore, it is not without interest to see whether one method produces higher rates of“missing values” (i.e. boxes left blank) than another method3.
Table12a shows a reasonably balanced picture. Lifetime prevalence rates are significantly different between the two versions in only four of 36 comparisons, two each favouring one of the two methods. The distribution of insignificant differences is again relatively even, with 13 comparisons yielding higher rates for the Internet, and 19 yielding higher rates for the“P&P” versions.
So far as missing values are concerned (Table 12c)4, the picture is relatively balanced for the insignificant comparisons (16 vs 11). However, non-response (i.e.“jumping”) to questions related to drug use is significantly more frequent— in eight of nine comparisons—under the “P&P” condition. Given the low fre-quencies of missing values, we have restricted the comparison to lifetime items5.
So far as last-year prevalence rates are concerned (Table 12b), differences between the two methods are higher, under the“P&P” condition, in 29 out of 36 comparisons from which four rates are significant. Thus, there seems to be some differences between methods where short-term rates are at stake, but not for lifetime prevalence rates. We shall discuss the reasons under the Discussion section.
5
The results are almost identical for last-year prevalence rates.
4In order not to overcharge the paper, we have not reproduced here the tables with detailed missing
values. These results can be obtained on request from the first author.
3
As mentioned in ’The controlled experiment”, we decided not to correct for multiple test bias, since we wanted to be especially caution about possible differences between the two different methods. However, we looked at the differences also using more stringent thresholds of significance (P<0.01). For lifetime prevalence rates, we found two significant differences instead of four and 34 (instead of 32) non-significant comparisons, of which 14 were “in favour” of the Internet and 20 were “in favour” of “P&P”. When looking at last-year prevalences, we found no significant differences, and the distribution of insignificant differences was seven “in favour” of the Internet and 29 “in favour” of “P&P”. As could be expected, we observed fewer significant differences than with the 0.05 threshold, but the trend did not change.
We also looked at the missing values (lifetime), using P<0.01, and found the same value as in Table12c. When looking at the prevalence of missing values during the last year, we found only four significant differences, all concerning hard drugs.
Table 11 Last-year prevalence (in percentages) of self-reported delinquency by interview method
Deviant Behaviour (% Admitting) P&P (N=308)
Internet (N=615)
Truancy 18.8 18.3
Running away 3.6 4.5
Driving without licence 33.6 35.4 Shoplifting (more than€35) 10.4 8.4 Shoplifting (less than€35) 24.4 21.6
Breaking into a car 1.3 1.8
Harassing somebody in the streets 9.3 9.1
Theft at school 13.1 12.5
Theft at home 7.6 8.8
Fare dodging 51.8 47.0
Vehicle theft 4.0 4.0
Theft of an object from a vehicle 4.3 3.6
Assault 10.9 8.4
Threats with gun/knife 3.3 2.2
Racket 1.0 0.8
Robbery 2.0 2.7
Arson 3.0 2.5
Selling soft drugs 7.6 3.8 P≤ 0.05
Selling hard drugs 1.7 0.3 Marginal cell frequencies < 5a
Graffiti 16.3 13.8
Vandalism 11.2 6.4 P≤ 0.05
Theft from the person 11.1 8.4 P≤ 0.05
a
No significance test possible
Table 10 Last-year prevalence (in percentages) of use of soft/hard drugs by interview method
Users (%) P&P (N=308) Internet (N=615)
Soft drugs (alcohol, cigarettes/ tobacco, cannabis) 71.1 66.8 Hard drugs (heroin, coke, XTC, speed, LSD) 5.3 3.1
Interaction effects
Interaction effects between the two methods and several possibly intervening variables, such as gender, nationality, and level of education6were considered.
No relevant interaction effects were found with nationality and educational level. Pupils from different national backgrounds and educational levels answered consistently the same way through one or the other version. However, gender seemed to interact with method in the case of some items of offending and victimisation. In general, boys admitted more victimisation over the“Internet”, and more delinquent acts on “P&P”, while the responses among girls were more balanced, except for drug use, which girls admitted more easily on the Internet. On balance, interaction effects do not seem to produce much change in the picture as it emerges from the preceding sections.
Qualitative observations
During the pre-test (The controlled experiment), a number of qualitative observa-tions were made (Kissling, 2004). In general, it seems that self-administered questionnaires may remind students of a written examination, whereas responding
Table 12 Summary of all comparisons between“paper-and-pencil” and Internet interviews Parameter P&P
Significantly Less Than Internet (P≤0.05)
P&P Less or Equal to Internet, But not Significantly
P&P Higher to Internet, But not Significantly P&P Significantly Higher than Internet (P≤0.05) Total Number of Comparisons
(a) Lifetime prevalence rates
Victimisation 0 3 2 0 5
Drug use 0 3 6 0 9
Delinquency 2 7 11 2 22
(b) Last-year prevalence rates
Victimisation 0 0 5 0 5
Drug use 0 1 7 1 9
Delinquency 0 6 13 3 22
(c) Missing values (lifetime)
Victimisation 0 0 4 0 4
Drug use 0 0 1 8 9
Delinquency 0 16 6 0 22
6
The Swiss school system offers three different levels of education for the ages at stake, namely (1) the “voie baccalauréat” or high school diploma, which, at age 18 years will qualify students to attend a university or any other form of higher education, (2) a medium track, which prepares students for more qualified apprenticeships (such as banking and clerical careers), and (3) a lower track, which usually leads to apprenticeships in manual jobs.
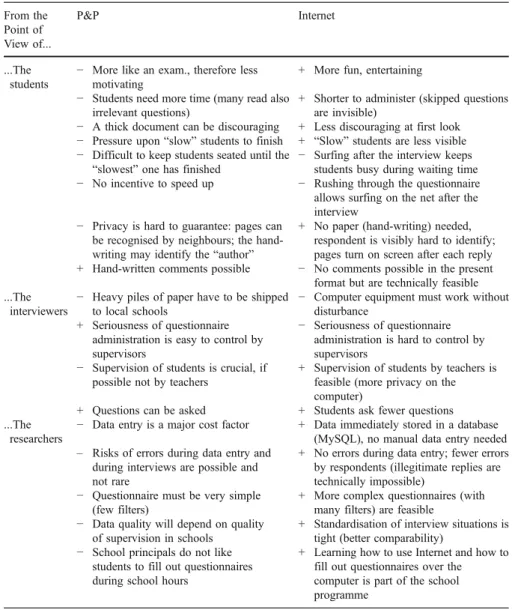
through the Internet is considerably more “fun” and less discouraging. Many students expressed their preference for the Internet version. Responding through Internet requires less time, and differences in the time needed by students are less “visible”, because students who have finished early with the questionnaire may continue surfing the Net. Under the P&P condition, it was difficult at times to keep students seated and to prevent them from disturbing“slower” fellow students. On the other hand, P&P allows important details to be added in the margins of the page or answers to be qualified by hand-written comments. Such comments and notes are not always easy to read, however, and marks and figures are sometimes hard to
Table 13 Summary of advantages and disadvantages ofBpaper-and-pencil'' and Internet interviews (based on Kissling,2004) From the Point of View of... P&P Internet ...The students
− More like an exam., therefore less motivating
+ More fun, entertaining − Students need more time (many read also
irrelevant questions)
+ Shorter to administer (skipped questions are invisible)
− A thick document can be discouraging + Less discouraging at first look − Pressure upon “slow” students to finish + “Slow” students are less visible − Difficult to keep students seated until the
“slowest” one has finished − Surfing after the interview keepsstudents busy during waiting time − No incentive to speed up − Rushing through the questionnaire
allows surfing on the net after the interview
− Privacy is hard to guarantee: pages can be recognised by neighbours; the hand-writing may identify the“author”
+ No paper (hand-writing) needed, respondent is visibly hard to identify; pages turn on screen after each reply + Hand-written comments possible − No comments possible in the present
format but are technically feasible ...The
interviewers
− Heavy piles of paper have to be shipped to local schools
− Computer equipment must work without disturbance
+ Seriousness of questionnaire administration is easy to control by supervisors
− Seriousness of questionnaire administration is hard to control by supervisors
− Supervision of students is crucial, if possible not by teachers
+ Supervision of students by teachers is feasible (more privacy on the computer)
+ Questions can be asked + Students ask fewer questions ...The
researchers
− Data entry is a major cost factor + Data immediately stored in a database (MySQL), no manual data entry needed – Risks of errors during data entry and
during interviews are possible and not rare
+ No errors during data entry; fewer errors by respondents (illegitimate replies are technically impossible)
− Questionnaire must be very simple (few filters)
+ More complex questionnaires (with many filters) are feasible
− Data quality will depend on quality of supervision in schools
+ Standardisation of interview situations is tight (better comparability)
− School principals do not like students to fill out questionnaires during school hours
+ Learning how to use Internet and how to fill out questionnaires over the computer is part of the school programme
interpret during data entry. Although our computer-assisted questionnaire did not allow for comments, such devices are feasible using different programmes. Even this advantage of P&P may thus become available on the Internet in the future.
On a different level, school principals may be more inclined to allow the interviewing of students over the Internet. Filling out electronic questionnaires can easily be built into ordinary computer lessons and is generally considered an essential part of the knowledge that students are expected to acquire at that age. Therefore, interviews over the Internet do not necessarily imply the alienation of students from their primary task. Our recent experience with an ongoing national survey on self-reported delinquency, victimisation, drug use, and school violence has largely confirmed this. Of 72 secondary schools (grades 7 to 9) randomly sampled, only two refused, despite a generally strong resistance among school principals against any form of survey research on their student population. In the negotiations with school principals, the training effect in computer skills turned out to be a particularly striking argument. Although no statistics have been established on this, we guess that without it, roughly one-third of the schools might have refused to participate in our national study on self-reported delinquency among Swiss students aged 13 to 15 years.
The advantages and drawbacks of the two methods have been summarised in Table13.
Beyond advantages from the viewpoint of schools, teachers and students (who prefer, by far, the Internet condition), this method makes interviewing considerably cheaper and easier. No heavy piles of questionnaires on paper have to be shipped to the different schools, no data from hand-written questionnaires need to be entered into the computer, nor is it possible to give more than one answer wherever one only is allowed, and anonymity may be more credibly guaranteed through the Internet. It is also questionable whether the presence of a researcher is really necessary when students answer a questionnaire over the computer. In our experiment we have no longer insisted on the presence of a researcher in the computer room in some classes, since experience has shown that the computer teacher is the really critical figure (given possible problems with Internet connection and other technical hassles), and that students ask far fewer questions than under the “P&P” condition. (Obviously, electronic questionnaires are better designed and more self-explanatory.) If computer teachers can replace a researcher, further cost savings may be possible, particularly in large countries and when a national sample of schools or students is to be interviewed. Particularly, the reduction in costs will be an important factor in making follow-up interviews for longitudinal studies more feasible. Similarly, research on juvenile delinquency based on self-report studies will become far more practicable in countries with limited resources—once computer equipment is available. We shall develop this point in the conclusions.
Discussion
As indicated in Table12a and b, we compared 72 prevalence rates in all, to which the two rates indicated in Table6 could be added. Out of the 72 comparisons, we found eight that were significant, at least at P<0.05. Given that, by chance, we
might expect to find about three or four significant differences in 72 comparisons, a reasonable conclusion would be to say that the choice between Internet and paper-and-pencil questionnaires has a modest impact on outcomes.
Interestingly, our experimental test produced a far more balanced result for lifetime prevalence rates (Table12a) than for the last-year rates, which tended to be higher under the “P&P” condition (Table 12b). This might be related to an interaction effect with the limit of the reference period (12-months). As shown in the section“Effect of different definitions of the reference period”, the “12-month” time limit produced slightly (but rather consistently) higher victimisation and drug use rates than a reference period with a fixed point in time (“fall vacation”), a result that is consistent with earlier research on telescoping effects. Owing to lack of resources7, the experimental component with the two definitions of the “last-year” period was limited to the“P&P” condition, and we do not know whether the slight trend toward reporting more incidences in the“12-month” version would have been found under the Internet condition as well. Keeping this uncertainty in mind, we may speculate that students might answer with higher precision on the computer than on a more“flexible” paper form, particularly with respect to the reference period. If this were the case, the usual“12-month” limit would not only be less problematic under the Internet than under the “P&P” condition but would also explain the surprising fact that the choice of the method seems to be more important for short-term (1-year) reference periods than when the entire lifetime is at stake.
The fact that non-response (“missing values”) in the form of “jumping” questions is more frequent in the “P&P” condition lends some support to the assumption that students may reply over the computer with greater“seriousness” and precision. Out of 35 comparisons between the two methods, missing values turned out to be 19-times more frequent under the“P&P” condition and 16-times under the Internet condition. In particular, eight among the 19 comparisons showing higher missing values rates in “P&P” were significant, and all were related to drug use. We do not think this should be interpreted as a social desirability effect, but rather as an illustration of the fact that students answer electronic questionnaires with more concentration and more precision. There is no other obvious explanation why the choice of the method should have an impact in the short run but not in the long run. There is no indication, more particularly, that social desirability effects might affect response behaviour. Some of the significant differences actually relate to delinquency items that are not particularly hard to admit, such as vandalism, theft from the person (both are higher under the P&P condition), driving without a licence and theft at home (both are higher under the “Internet” condition). If methods had an effect on response behaviours, we rather would have expected it for items such as assault, robbery/racket or other more serious offences. The fact that vandalism is significantly more often admitted in P&P questionnaires, while no such trend is found for graffiti, is puzzling and suggests that some differences may be related to random factors or to other factors not considered so far, such as the visual presentation that inevitably is never exactly the same under the two conditions. In the present case we opted for a presentation of all results concerning all items. This is likely to produce a“multiple test bias”. On the other hand, the question here 7
Preparing two different questionnaires would have unduly complicated this (first) experimental test of Internet vs paper-and-pencil questionnaires.
was not that of establishing the (in)effectiveness of a programme but of seeing whether an attractive new method (interviewing over the Internet) could be adapted to research on self-reported juvenile delinquency without losing unduly in validity of results. Looked at from this angle, the testing of as many comparisons as possible is a conservative way of establishing that such risks, even in the worst case, will be limited. The purpose, obviously, was not that of showing that there is definitively no method effect at all (Weisburd, Lum & Yang, 2003) but of seeing how much distortion one will have to face when switching from one method to another and weighing any disadvantage of this kind against possible advantages such as lower refusal rates among schools. We would also like to warn against the widespread idea that“more” necessarily means “better”. Earlier European victimisation surveys had produced rates of victimisation exaggerated by up to a factor of 3, owing to massive telescoping effects under the umbrella of the “12-month” time limit set in most questionnaires. In this sense, the sometimes (though not consistently) lower rates under the Internet condition may also reflect more seriousness and precision among students who respond in a classroom, particularly in respect of the reference period. Future research should look more closely into the visual presentation of items, possibilities to correct inaccurate answers (discovered by the respondent during the interview), the impact of the presence of a (computer) teacher and/or a researcher, and possible interaction effects, particularly with gender and ways to define the reference period. Although, according to the present findings, some interaction with gender needs to be kept in mind, the good news is that students from less demanding school tracks or of different cultural backgrounds do not react differently to Internet or classical paper-and-pencil questionnaires. In the light of these findings and of the qualitative observations (in“Qualitative observations”), the interviewing of juveniles on self-reported experiences with victimisation, drug use, and delinquency may be done through the Internet without any risk of major distortions in the results, but with many obvious advantages.
Conclusions
The experiment showed that interviewing adolescents (aged 14 to 16 years) through the Internet is feasible, that this method significantly (P<0.05) affects no more than 10% of all relevant prevalence rates, and that significant differences are not consistently in“favour” of one method. Other observations have shown that Internet interviewing is far more popular among students, that non-response to specific items is more frequent on paper-and-pencil surveys, and that school principals are more inclined to allow interviewing in class over the computer. These advantages are reinforced by important cost savings relative to P&P questionnaires, in the first place because data do not need to be entered. It may even be possible to let students respond to an Internet interview without a researcher present, although additional testing on this issue may be necessary.
Comparing the two methods, it is concluded that interviewing through the Internet will greatly facilitate major surveys among students and, therefore, is likely to become the standard method in the foreseeable future. Given the substantial reduction of field costs, surveys on self-reported delinquency may be greatly facilitated through
this method. This may be a critical advantage in countries with limited research budgets, particularly at a time when computers have become generally available in schools of such countries as well (a trend that is well visible currently in Eastern Europe). If interviews can validly be realised without the presence of a researcher (i.e. under the sole responsibility of the computer teacher), national probability samples, based on one or two classes in perhaps dozens or hundreds of schools, could easily be surveyed at minimal costs. So far, self-report studies have often been limited to one city or one school8, obviously because budgets could not be stretched to send researchers to schools located hundreds of miles away. In the same vein, samples may become far larger than we have been used to seeing so far and, thus, would allow the studying of more severe (and rare) forms of behaviour.
These factors may critically favour future international (comparative) research, such as the International Self-reported Delinquency (ISRD) Survey (Junger-Tas, Terlouw & Klein,1994) that is currently being repeated in about 30 countries9. It may also favour longitudinal studies that so far have often been beyond budgetary limits, even in relatively wealthy countries.
Thus, the new method could lead to a breakthrough in delinquency research similar to how the advent of CATI 20 years ago has helped to multiply victimisation surveys. The advent of CATI, first in Swiss and then in the International Crime Victimisation Surveys (Killias,1990; van Dijk et al., 1990), had encountered stiff resistance among many researchers who, especially in Europe, considered this (cheap) method to be insufficiently“serious”. Despite the widespread reservations against CATI, victimisation studies have developed to unprecedented popularity at the international level as well as at national levels, thanks to the enormous cost savings made possible by it. With traditional face-to-face or mail surveys, such studies would certainly have continued to be conducted on city samples of modest sizes (see, as examples, Kury, 1994, and Schwind et al., 2001). This recent criminological experience illustrates how methodological innovations often stimulate growth of knowledge. It is not impossible that the Internet may have effects on research on juvenile delinquency similar to those that CATI had some 20 years ago on crime victimisation surveys.
Acknowledgements This experiment has been possible thanks to the Directors of the secondary schools at Cossonay, Penthalaz and Lausanne, the researchers who created PHP Surveyor, Isabelle Moulet and Romain Voisard at the University of Lausanne for their assistance with templates, PHP coding and many other tasks, as well as our School’s MA students, who supervised classes during interviews, and students and computer teachers who gave their time. We thank also Dr. Oberwittler for helpful suggestions during the preparation of the experiment. Special thanks are due to four anonymous reviewers who offered most valuable suggestions on how to present the results and to Klaus Müller for his correction of the English language.
8This fact increased, obviously, reluctance among principals who, not without justification, feared
criticism in case of“negative” results for their schools, a risk they would not face if only one class per school was being interviewed. On the same line, having one or two classes interviewed is a minor disturbance of school routine, compared with a survey covering the entire student population.
9
ISRD-2 is a follow up of ISRD-1, which was launched by the Research and Documentation Centre of the Dutch Ministry of Justice in 1992. All countries collected the data during 2006, and a joint publication of national chapters will be published in a book at the end of 2007.
References
Becker, R., & Günther, R. (2004). Selektives Antwortverhalten bei Fragen zum delinquenten Handeln. ZUMA-Nachrichten, 54, 39–59 (28.05.2004).
Beebe, T. J., Harrison, P. A., McRae, J. R. J., Anderson, R. E., & Fulkerson, J. A. (1998). An evaluation of computer-assisted self-interviews in a school setting Public Opinion Quarterly, 62, 623–632. Choi, S. W., & Tinkler, T. (April 2002). Evaluating comparability of paper-and-pencil and computer based
assessment in a K-12 setting. Paper presented at the annual meting of the National Council on Measurement in Education New Orleans, LA.
Couper, M. P., Traugott, M. W., & Lamias, M. J. (2001). Web survey design and administration. Public Opinion Quarterly, 65, 230–253.
Dillman, D. A., Redline, C. D., & Carley-Baxter, L. R. (1999). Influence of Type of Question on Skip Pattern Compliance in Self-Administered Questionnaires. Paper presented at the Joint Statistical Meetings of the American Statistical Association, Indianapolis.
Gfroerer, J. (1996). Special populations, sensitive issues, and the use of computer-assisted interviewing in surveys. In R. B. Warneke (Ed.), Health Survey Research MethodsConference Proceedings (pp. 177– 180). DHHS Publication No. (PHS) 96–1013. Hyattsville, Md.: National Center for Health Statistics. Eisner, M., Manzoni, P., & Ribeaud, D. (2000). Opfererfahrungen und selbst berichtete Gewalt
beiSchülerinnen und Schülern im Kanton Zürich. Aarau: Sauerländer.
Fendrich, M., Johnson, T. P., Wislar, J. S., Hubbell, A., & Spiehler, V. (2004). The utility of drug testing in epidemiological research: results from a general population survey. Addiction, 99, 197–208. Haines, K., Case, S., Isled, E., & Hancock, A. (2004). Extending entitlement: Making it real. Cardiff:
Welsh Assembly Government.
Hetter, R., Segall, D. O., & Bloxom, B. M. (1997). Evaluating item calibration medium in computerized adaptive testing. In W. A. Sands, B. K. Waters, & J. R. McBride (Eds.), Computerized adaptive testing: from inquiry to operation. Washington D.C.: American Psychological Association. Jenkins, C. R., & Dillman, D. A. (1997). Chapter 7: Towards a theory of self-administered questionnaire
design. In L. Lyberg, P. Biemer, M. Collins, E. DeLeeuw, C. Dippo, N. Schwarz & D. Trewin (Eds.), Survey measurement and process quality (pp. 165–196). New York: Wiley-Interscience.
Johnston, L. D., & O’Malley, P. M. (1985). Issues of Validity and Population Coverage in Student Surveys of Drug Use. In B. A. Rouse, N. J. Kozel & L. G. Richards (Eds.), Self-report methods of estimatingdrug use: meeting current challenges to validity. NIDA Research Monograph 57, 31-54. Washington, DC: U.S. Government Printing Office.
Jones, E. F., & Forrest, J. D. (1992). Underreporting of abortion in survey of U.S. women: 1976 to 1988. Demography, 29, 113.
Junger-Tas, J., Terlouw G. J, & Klein, M. W. (1994). Delinquency behavior among young people in the Western World. Amsterdam and New York: Kugler.
Killias, M. (1990). New methodological perspectives for victimisation surveys: The potential of computer-assisted telephone surveys and some related innovations. International Review of Victimology, 1(2), 153–167.
Killias, M. (2002). Grundriss der Kriminologie. Berne: Stämpfli.
Killias, M., Villettaz, P., & Rabasa, J. (1994). Self-reported Juvenile Delinquency in Switzerland. In J. Junger-Tas, G. J. Terlouw, M. Klein (Eds.), Delinquent behavior among young people in the Western World (pp. 186–211). Amsterdam: Kugler.
Kissling, I. (2004). Comparaison des modalités de passation: Internet contre papier-crayon. Lausanne: ICDP-ESC, University of Lausanne.
Klein, M. W. (Ed.) (1989). Cross-national research in self-reported crime and delinquency. Dordrecht/ Boston/London: Kluwer Academic Publishers.
Kury, H. (1994). Zum Einfluss der Art der Datenerhebung auf die Ergebnisse von Umfragen. Monatsschrift für Kriminologie und Strafrechtsreform, 77(1), 132–144.
Mead, A. D., & Drasgow, F. (1993). Effects of administration medium: A meta-analysis. Psychological Bulletin, 114(3), 449–458.
Needle, R., McCubbin, H, Lorence, J., & Hochhauser, M. (1983). Reliability and validity of adolescent self-reported drug use in a family-based study: A methodological report. International Journal of the Addictions, 18, 901–912.
Oberwittler, D., & Naplava, T. (2002). Auswirkungen des Erhebungsverfahrens bei Jugendbefragungen zu ,heiklen’ Themen - schulbasierte schriftliche Befragung und haushaltsbasierte mündliche Befragung im Vergleich. ZUMA-Nachrichten, 51, 49–77.