DOI 10.1007/s11151-008-9164-1
Is there any Impact of University–Industry Knowledge
Transfer on Innovation and Productivity? An Empirical
Analysis Based on Swiss Firm Data
Spyros Arvanitis · Nora Sydow · Martin Woerter
Published online: 5 June 2008
© Springer Science+Business Media, LLC. 2008
Abstract This study investigates the impact of a wide spectrum of knowledge
and technology transfer (KTT) activities (general information; educational activities; research activities; activities related with technical infrastructure; and consulting) (a) on two innovation indicators in the framework of an innovation equation with a endogenized variable of KTT activities as an additional determinant of innovation; and (b) on labour productivity in the framework of a production function with endogenized innovation variables and the variable for KTT activities as additional production factors.
Keywords Knowledge and technology transfer· Innovation activities · R&D
activities
JEL Classification O30
1 Introduction and Plan of the Study
The topic “knowledge and technology transfer” (KTT) has spurred great interest among academic researchers and policy-makers for many years. The interaction of business sector and science institutions through the exchange of knowledge and tech-nology has become a central concern not only for applied economics but also for
S. Arvanitis (
B
)· N. Sydow · M. WoerterETH Zurich, KOF Swiss Economic Institute, 8092 Zurich, Switzerland e-mail: [email protected]
N. Sydow
e-mail: [email protected] M. Woerter
economic policy in recent years.1In a knowledge economy, science is exerting an increasingly large influence on innovation, especially in fast-growing knowledge-intensive industries. Thus, the extent and intensity of industry–science relationships is considered to be a major factor contributing to high innovation performance at the firm level, industry level, or country level (OECD 2002).
The experience of the U.S. suggests that research excellence of publicly financed science institutions and the commercialization of research results by private enter-prises are compatible goals that reinforce each other, if both sides adopt a long-term perspective (as e.g. in aerospace, computers and telecommunications). However, there is accumulating evidence that many OECD countries are lagging behind in terms of KTT. The interface between business firms and science institutions, especially univer-sities, has to be improved and as a consequence knowledge and technology transfer activities have to be intensified. Also in Switzerland it is asserted by many observers that the industry-science interface is far from satisfactory (e.g.,Zinkl and Huber 2003). Particularly in the view of policy-makers an intensive exchange of knowledge is not a goal by itself but a means to sizable economic benefits. Measuring the effects of transferred knowledge and technology is a methodological challenge for economists because the effects are usually numerous and they are almost always difficult to sepa-rate from other parts of firms’ activities. In many instances, determining the meaning of knowledge transfer “effectiveness” proves to be a difficult task.2
Under knowledge and technology transfer (KTT) we understand broadly any acti-vities targeted at transferring knowledge and technology that may help a company or a research institution—depending on the direction of the transfer—to further promote its activities.
This study investigates the impacts of a palette of KTT activities (general infor-mation; educational activities; research activities; activities related to technical infra-structure; and consulting) (a) on two innovation indicators in the framework of an innovation equation with an endogenized variable for KTT activities as an additional determinant of innovation; and (b) on labour productivity in the framework of a pro-duction function with endogenized innovation variables and an endogenized variable for KTT activities as additional production factors. The data used in the study were collected by means of a survey of Swiss enterprises that took place at the beginning of 2005.
New elements of the analysis are: (a) the differentiated measurement of a wide spectrum of KTT activities covering 19 single forms of KTT activities; (b) the use of a three-equation system for estimating the impact of KTT activities on innovation and economic performance; and (c) the wide coverage of industries and firm size
1 Economics: see, e.g., volume 28, issue 3–4 of the Journal of Technology Transfer August 2003 devoted
to the “Symposium on the State of the Science and Practice of Technology Transfer”; volume 34, issue 3 of Research Policy April 2005 (edited by A.N. Link and D.S. Siegel) dedicated to “University-based Technology Initiatives”; volume 64, issue 4, the Journal of Economic Behaviour and Organization August 2007 (edited by A. Jaff, J. Lerner, S. Stern and M. Thursby), dealing with “Academic Science and Entre-preneurship”; Policy: see, e.g.,OECD(1999),OECD(2002), andOECD(2003).
2 See, e.g.,Bozeman(2000) andGeorghiou and Roessner(2000) for recent reviews of the central issues
related to this question; for reviews of the related econometric issues see, e.g.,Klette et al.(2000) andHall and Van Reenen(2000).
classes (manufacturing, selected service industries, construction; firms with at least 5 employees). This is the first study on this topic for Switzerland.
In Sect.2we present a summary of the empirical literature. In Sect.3 we intro-duce our three-equation model of knowledge and technology transfer, innovation, and productivity and discuss the applied estimation method. Sect.4deals with the data used in this study. In Sect.5we present the econometric estimates for the three model equations. Finally, Sect.6contains a summary and some conclusions.
2 Summary of Empirical Literature
We distinguish two groups of empirical studies that pursue similar research ques-tions to those in this paper and are based on firm-level data:3(a) studies investigating the impact of KTT activities on the innovation performance at firm level based on direct measures of KTT activities emphasizing formal R&D co-operation and/or the intensive use of university knowledge as an external knowledge source via publica-tions, educational activities, etc.; (b) studies dealing with the impact of KTT activities on firms’ economic performance measured, e.g., by labour productivity, total factor productivity, sales growth and so on.
Most of the studies that are based on direct measures of KTT activities, primar-ily R&D co-operation and/or intensive use of university knowledge as an external knowledge source, found a positive effect of KTT activities on different measures of innovation performance such as the propensity of registering an innovation for patenting, the number of patent applications, the R&D intensity, and the introduction of product and/or process innovations as well as the sales share of innovative products. This was particularly the case for R&D cooperation with universities and/or other pub-lic research institutions in European countries (seeBecker 2003,Fritsch and Franke 2004for Germany; Monjon and Waelbroeck 2003 for France;Lööf and Broström 2006for Sweden).
Moreover, a study based on data for firms from several European regions for 1996 found that co-operation with scientific institutions increases firms’ abilities to reali-ze more radical innovation and to introduce products that are “new to the market”; university knowledge seems to be not important for the generation of incremental inno-vations (Kaufmann and Tödtling 2001). Further, in a recent study based on pooled data for France, Germany, Ireland, and Spain,Mohnen and Hoareau(2003) found that the probability of cooperation with research institutions is positively correlated with the propensity of patenting but not with R&D intensity.
There are also several studies based on U.S. firm data showing a positive rela-tionship between the use of university knowledge and the innovative performance
3 For recent studies on the impact of public R&D expenditure on business R&D at country or sector level
see, e.g.,Guellec and van Pottelsberghe de la Potterie(2003) (17 OECD countries) andBönte(2004) (West German manufacturing industries); for studies measuring the impact of public R&D expenditure on eco-nomic performance at sector or country level, see, e.g.,Mamuneas(1999) (6 high-tech US manufacturing industries);Guellec and van Pottelsberghe de la Potterie(2001) (16 OECD countries);Sorensen et al.(2003) (Danish manufacturing industries); andBönte(2003) (U.S. manufacturing industries).
of firms. Some earlier pioneering studies go back to the 1970s and 1980s; see, e.g., the investigations ofMansfield(1991,1998) covering 76 major firms for the period 1975–1994 or the study ofNelson (1986) based on the data from the Yale Survey 1984 in 130 industries. In a recent studyAdams et al.(2003) found that cooperative research and development agreements (CRADAs) have stimulated industrial patents and company-financed R&D in the industrial labs of 200 major U.S. companies. How-ever, a study dealing with projects supported by the Advanced Technology Programme (ATP) in the U.S. could not find any significant effect of university participation in such projects on the generation of new technology applications; moreover, university participation showed even a negative effect on the expectation of commercialization of new inventions (seeHall et al. 2003).
Finally, many studies investigating the impact of university knowledge on eco-nomic performance found a positive effect either on labour productivity, sales pro-ductivity with respect to innovative products, or sales growth (e.g.,Brandstetter and Ogura 2005for the U.S.;Belderbos et al. 2004for the Netherlands). However, a study of Italian firms could not identify a positive contribution of research collaboration with universities to firm performance (Medda et al. 2005). Further, a study on the technology programmes of the European Union found an improvement of economic performance of the participants of the EUREKA Framework but not of the 3rd and 4th Framework Programme for Science and Technology (FPST) (seeBenfratello and Sembenelli 2002).
On the whole, the results of these studies are indicative but not completely compa-rable. Many of the observed differences can be traced back to differences with respect to the sectors and industries covered in the studies, the specification of the variables of KTT activities (mostly too narrowly defined), and the nature of the investigations (cross-sectional versus longitudinal approach).
3 Conceptual Framework, Model Specification, and Estimation Method
3.1 A Model of Knowledge and Technology Transfer, Innovation, and Productivity Our main hypothesis is that KTT activities would improve the innovation performance of firms and also—either directly or indirectly via innovation output—their economic performance in the narrow sense; e.g., average labour productivity. This KTT effect could be traced to an increase of technological opportunities anticipated by firms due to university–industry knowledge transfer. This would include effects from a wide pal-ette of KTT activities such as exchanging scientific and technical information, various educational activities (e.g. recruitment of R&D personnel from the universities, joint PhDs, specialized training courses), consulting, use of technical infrastructure, and, of course, cooperation in research. The prominent role of technological opportunities as a major supply-side determinant of innovation is often emphasized in the literature (e.g.,
Klevorick et al. 1995; for the empirical relevance of technological opportunities for Swiss firms seeArvanitis and Hollenstein 1996). We further hypothesize that R&D activities that are closely related to knowledge generation would be more strongly enhanced by the interaction with universities than would activities that are near to the
market launching of a new product (e.g., construction of prototypes, test production, market tests for new products, etc.).
We formulated a three-equation model starting with the knowledge and technology transfer (KTT) equation (1) that contains the factors that determine KTT activities; then proceeding to the innovation equation (2) that is explained, among other things, by KTT activities; and ending up with the productivity equation (3) containing both the variable for KTT activities and the innovation variables. A formal expression of these three equations is as follows:
KTT= α0+ α1LQUAL+ α2LC+ α3R&D+ α4LEXPQ+ α5LAGE
+α6FOREIGN+ α7OBSTACLE1+ · · · + α11OBSTACLE5
+control variables + u(1) (1)
(LRDS; LNEWS) = β0+ β1LCI+ β2LEXPQ+ β3LAGE+ β4FOREIGN
+β5KTT+ control variables + u(2) (2)
LQ/L= γ0+ γ1LCI+ γ2FOREIGN+ γ3(LRDS; LNEWS) + γ4KTT
+control variables + u(3) (3)
The description of the variables in the above equations follows in the next sections (see also Table1).
3.2 Specification of the KTT Equation: Determinants of KTT Activities
The dependent variable in equation (1) is the dummy variable KTT that takes the value 1 for firms that have engaged in knowledge and technology transfer activities in the period 2002–2004. Firms reporting that they were involved in any kind of KTT activities in the reference period had to choose at least one specific activity out of a list of 19 individual activities such as joint Master and Ph.D. theses, joint courses, recruitment of university graduates in R&D, joint R&D projects, long-term research contracts, utilization of university technical infrastructure, etc. (seeArvanitis et al. 2005for more details).
Given its technological profile a firm intending to get involved in KTT activities would have to consider the benefits and costs of this involvement. Possible benefits should not be restricted to the outcomes of joint R&D projects but also cover e.g. knowledge gains through the recruitment of qualified R&D personnel, specific train-ing courses, joint doctoral dissertations, etc.; financial benefits through time-savtrain-ing in R&D and reduction of technological risks; and other not directly economic benefits like image improvement, indirect access to competitors’ know-how, and so on (see
Veugelers and Cassiman 2005).
We hypothesized that the resource endowment of a firm would be an important factor determining a firm’s ability to benefit from KTT activities. Thus, a first group
Ta b le 1 KTT acti vities, innov ation p erformance and labour producti vity Explanatory v ariables KTT (1 ) LRDS (2 ) LQ/L (3 ) LQ/L (3 ) LNEWS (4 ) LQ/L (3 ) Eq. (1) KTT instrumented LRDS instrumented KTT instrumented KTT instrumented LNEWS instrumented Eq. (2a) E q. (3aa) Eq (3ab) E q. (2b) Eq. (3b) LQ U A L (5 ) 0.301*** (0.042) LCI (6 ) 0.014 (0.019) − 0. 029 (0.053) 0.059***(0.010) 0.059*** (0.010) 0.095** (0.040) 0.055*** (0.010) R&D (7 ) 1.142*** (0.075) LEXPQ (8 ) 0.010 (0.021) 0.032 (0.056) 0.072* (0.039) LA GE (9 ) 0.094** (0.042) − 0.836*** (0.098) − 0.195*** (0.072) FOREIGN (10 ) − 0.002 (0.091) − 0.559*** (0.205) 0.274*** (0.040) 0.271*** (0.045) − 0.015 (0.153) 0.268*** (0.042) Im p e d im e n ts (11 ): OBST ACLE1 0.082** (0.033) Lack of information OBST ACLE2 − 0.105** (0.035) Firm deficiencies OBST ACLE3 − 0.119*** (0.035) Deficiencies of univ ersities OBST ACLE4 0.060* (0.031) Costs, risks OBST ACLE5 0.008 (0.033) Or ganiz./institut. obstacles KTT_INSTR (12 ) 8.024*** (0.152) 0.065*** (0.019) 1.372*** (0.084) LRDS_INSTR (13 ) 0.008*** (0.002) LNEWS_INSTR (14 ) 0.044*** (0.013)
Ta b le 1 continued Explanatory v ariables KTT (1 ) LRDS (2 ) LQ/L (3 ) LQ/L (3 ) LNEWS (4 ) LQ/L (3 ) Eq. (1) KTT instrumented LRDS instrumented KTT instrumented KTT instrumented LNEWS instrumented Eq. (2a) E q. (3aa) Eq (3ab) E q. (2b) Eq. (3b) Constant − 2.849*** (0.279) 9.647*** (0.650) 11.087*** (0.084) 11.143*** (0.094) − 0.054 (0.518) 11.166*** (0.097) N 2428 2428 2428 2428 2428 2428 N (left-censored) 1638 1364 Pseudo R 2 0.287 0.454 0.096 Adj. R 2 0.136 0.136 0.135 W ald test (χ 2) 592.5*** 5048.4*** 349.3*** 367.1*** 927.3*** 357.2*** Number of replications 500 500 500 500 500 Note . (1) KTT : dummy v ariable for kno wledge and technology transfer acti vities in the p eriod 2002-2004; (2) L RDS: logarithm o f the R&D expenditure di vide d b y sales (R&D intensity); (3) L NEWS: logarithm o f the sales share o f n ew products; (4) LQL: logarithm o f v alue added p er emplo y ee (emplo yees calculated in full -time equi valents); (5) L Q U AL: logarithm o f the share o f emplo yees with tertiary-le v el v ocational education 2004 (univ ersities, univ ersities of applied sciences, o th er b u siness and technical schools at tertiary le v el); (6) LCI: logarithm o f g ross in v estment per emplo yee 2004; (7) R &D: R &D acti vities yes/no; (8) LEXPQ: logarithm o f exports as a share of sales; (9) L A G E: logarithm o f fi rm age; (10): FOREIGN: dummy v ariable for foreign fi rms; (11) impediments: OBST ACLE1 to OBST ACLE5: see Arv anitis et al. 2005 fo r d etails on the construction o f these v ariables; control v ariables: 4 dummy v ariables for 4 sectors of the economy: high-tech manuf acturing (chemicals, p las tics, m achinery , electrical machinery ,electronics, instruments and v ehicles); lo w-tech manuf acturing (all other m anuf acturing industries); kno wledge-based services (ba nks, computer services, b usiness services); traditional services (wholesale trade, transportation); reference industry: construction; 6 dummy v ariables for fi rm size; reference firm size class: 5-19 emplo y ees; ***, **, * d enote statistical significance at the 1 %, 5% and 10% test le v el respecti v ely
of determinants is related to the resource endowment of the enterprises with human capital (LQUAL; logarithm of the share of employees with tertiary-level education) and physical capital (LCI: logarithm of gross investment expenditure per employee). We expected that especially firms with high human capital intensity and R&D activ-ities (R&D; R&D activactiv-ities yes/no) would show greater knowledge absorptive capa-city; thus they possess the profile needed for KTT activities with science institutions. Physical capital intensity would be a complementary measure for absorptive capacity especially for manufacturing firms. Firms with greater knowledge absorptive capacity would be most frequently found in high-tech manufacturing (e.g., the pharmaceutical industry, electronics) and in knowledge-based service industries (e.g., the software industry). Thus, a firm’s industry affiliation would be important for the propensity to engage in KTT activities.
Further firm characteristics that we expected to be related to KTT activities were the degree of exposure to international competition measured by the logarithm of sales share of exports LEXPQ (positively related; know-how requirements are high for international oriented firms), the logarithm of firm age LAGE (positively related; older firms have a longer experience with cooperative arrangements), status as a subsidiary of a foreign-based company FOREIGN (the sign of this effect is not a priori clear), and firm size measured by the number of employees (6 dummy variables; positively related; scale effects with respect to the utilization of scientific knowledge may exist). Possible costs would include high transaction costs due to deficiencies in the inter-face between the firm and the science institution either on the side of the firm or the science institution, high information asymmetries, high financial risks due to the uncertainty of research outcomes, property rights problems, and costs of possible tech-nological dependence on the science partner. As proxies for such possible costs, we used variables for five groups of obstacles of KTT activities constructed by a principal component factor analysis of 26 individual obstacles (OBSTACLE1 to OBSTACLE5; seeArvanitis et al. 2005for details).
3.3 Specification of the Innovation Equation
Since KTT activities are mainly conducted to strengthen firms’ R&D activities in general or to help develop new innovative products, we expect that the involvement in KTT strategies would be reflected primarily in a higher innovation performance.
In order to analyse the relationship between strategies and measures of innovative performance we specified an innovation equation. Innovation performance is measured (a) by the input variable LRDS (logarithm of R&D expenditures divided by sales) and (b) the output variable LNEWS (logarithm of the sales share of new products).4 We used as independent variables proxies for the intensity of physical capital (LCI),
4 We used logarithms as dependent variables because of the high variance as compared to the means of
the variables LRDS and LNEWS. In order to be able to calculate the logarithms of R&D intensity for firms without R&D expenditures, we put these firms at the minimum value 0.001 of R&D intensity of firms with R&D expenditures. We then calculated the logarithms and subtracted ln (0.001)= −6.908 from all logarithms to get 0 values for the firms without expenditures. The minimum value for the sales share of new products was 0.01, thus minimum LNEWS= ln (0.01) = −4.605.
the degree of exposure to international competition (LEXPQ), firm age (LAGE), the affiliation of the firm (FOREIGN; foreign firm yes/no), and firm size (6 dummy vari-ables). According to standard empirical evidence from earlier studies we expected positive effects for LCI, LEXPQ, and firm size. The effect of the variable FOREIGN is not a priori clear. It is also not a priori obvious, if younger firms should be more inno-vative than older firms (variable LAGE). For firm size we expected to find a positive effect that would diminish with increasing size (seeArvanitis 1997).
According to our main hypothesis, we expected that the involvement in KTT activ-ities would strongly enhance firms’ innovation performance. Innovative firms have a tendency to acquire external knowledge, particularly science-based knowledge, to complement the in-house generated know-how. For this reason, we included a dichotomous variable for the KTT activities (KTT: overall KTT activities yes/no) that we expected to be strongly positively correlated with both innovation measures. 3.4 Specification of the Productivity Equation
Our main hypothesis is that KTT activities would contribute as an additional produc-tion factor to an improvement of labour productivity of KTT-active firms compared to firms that are not involved in such activities. The overall positive KTT effect could be traced back, first, to a direct link to productivity. Thus, we expected a significantly positive coefficient for the KTT variable. This direct effect would include effects from a wide spectrum of KTT activities such as exchanging information, various educational activities (e.g., recruitment of R&D personnel, joint PhDs, specific training courses), consulting, use of technical infrastructure, and, of course, cooperation in research. Second, we further expected that there is also an indirect effect of KTT activities channelled through the firms’ innovative activities that are strongly enhanced by such activities (see Eq.2above). Behind this expectation is the idea that university knowl-edge would raise the effectiveness of R&D with respect to economic performance by complementing, not substituting for, in-house knowledge.
Besides the innovation variables LRDS and LNEWS and the variable KTT we also used physical capital intensity (LCI), the variable FOREIGN, and firm size as further independent variables in the productivity equation.
3.5 Estimation Method
In a first step, we estimated a probit model for Eq. (1) with the dichotomous variable KTT as dependent variable.
In a second step, we estimated tobit models for Eq. (2) with LRDS and LNEWS as dependent variables that were downward censored at 0 respectively. However, being involved in KTT activities is not exogenous to innovation activities. We accounted for this endogeneity effect by estimating a second version of each innovation equa-tion, in which the variable for KTT activities (KTT) was instrumented. This is the estimate we present in Table1. As instruments we used the right-hand side variables of Eq. (1). The variables OBTACLE2 and OBSTACLE3 that correlate strongly with KTT in Eq. (1), but do not correlate significantly with the two innovation variables
are the identifying instruments. Based on the estimated parameters of this model we calculated estimated values for KTT that were then inserted as right-hand side vari-ables in the innovation equations (2-stage procedure). Bootstrapping was used in order to correct the standard errors of the estimated parameters (see Table1). As an alter-native procedure, a FIML estimation of equation (2) was also applied in order to test the robustness particularly of the estimates for the variable KTT (procedure treatreg in STATA). In Table 1 we present only the results for the 2-stage procedure because they are qualitatively similar to those of the latter estimation.
In a third step, we estimated an OLS model for Eq. (3) with value added per employee LQ/L as the dependent variable. We accounted for the endogeneity effects of the variable KTT and the innovation variables LRDS and LNEWS respectively by estimating three further versions of the productivity equation; a first one in which the variable for KTT activities (KTT) was instrumented; and a second and a third one, in which the innovation variables LRDS and LNEWS were instrumented. We present these estimates in Table1. As instrumental equations we used Eq. (1) for KTT and Eq. (2) with instrumented KTT for LRDS and LNEWS. The variable LAGE is the identifying instrument, since it correlates strongly with the two innovation variables in Eq. (2), but does not correlate significantly with labour productivity. Based on the estimated parameters of this model we calculated values for KTT that were inserted as independent variables in the productivity equation (2-stage procedure). Bootstrap-ping was used in order to correct the standard errors of the estimated parameters (see Table1).
As in the case of the endogenization of variable KTT in Eq. (2) above, we tested the robustness of the estimates of Eq. (3) by applying as an alternative procedure a FIML estimation of Eq. (2) (procedure treatreg in STATA). In Table1 we present only the results for the 2-stage procedure because they are qualitatively similar to those for the latter procedure. We applied the alternative procedure also for LRDS and LNEWS based on an instrument equation without endogenizing KTT. Also in this case the results are similar to those of the former procedure, but the two approaches are not equivalent because in the latter case the variable KTT is not endogenized in the instrument equations for LRDS and LNEWS.
4 Data
The data used in this study were collected in the course of a survey of Swiss firms that yielded data on the incidence of KTT activities, on forms, channels, motives, and impediments of the KTT activities as well as on some basic firm characteristics (inno-vation and R&D activities, investment, sales, exports, employment and employees’ vocational education).5The survey was based on a (with respect to firm size) dispro-portionately stratified random sample of firms with at least 5 employees covering all relevant industries of the manufacturing sector, the construction sector, and selected service industries (excluding industries with an expected very low propensity of KTT activities, such as hotels/catering, retail trade, real estate/leasing, personal services)
as well as firm size classes (on the whole 25 industries and within each industry three industry-specific firm size classes with full coverage of the upper class of large firms). Valid answers were received from 2582 firms (45.4%) in the underlying sample. The response rates do not vary much across industries and size classes with a few exceptions (over-representation of wood processing, energy industry, and machinery; under-representation of clothing/leather industry). The non-response analysis (based on a follow-up survey of a sample of the non-respondents) did not indicate any serious selectivity bias with respect to the incidence of KTT activities with science institu-tions. A careful examination of the data of these 2582 firms led to the exclusion of 154 cases with contradictory or non-plausible answers; there remained 2428 valid answers that were used for this analysis (see TableA1in the appendix for the compo-sition of the dataset; TableA2presents some descriptive statistics; TableA3presents the correlation matrix for all of the variables in the three equations).
Further, we used the multiple imputations technique byRubin(1987) to substitute for missing values in the variables due to item non-response (seeDonzé 2001for a detailed report on these imputations).6The estimations were based on the mean of five imputed values for every missing value of a certain variable. To test the robustness of this procedure we estimated the innovation models and the productivity model also for the original data without imputed values and compared the results. This comparison showed relatively high robustness with respect to the effects for the variables KTT, LRDS, and LNEWS, which are the main subject of this study.
5 Results
5.1 KTT Equation
Table1presents the results of the probit estimates for the KTT Eq. (1) (column 1). The variables for human capital intensity (LQUAL) and the propensity to R&D activities (R&D) have highly significant positive coefficients. Both variables are closely related to a firm’s ability to absorb new knowledge from its environment. Thus, high human capital intensity and the existence of in-house R&D activities seem to be important preconditions for unfolding KTT activities. On the contrary, capital intensity (LCI), the third variable in our model referring to firms’ resource endowment, does not appear to be relevant for distinguishing between firms with KTT activities and those without this type of activity.
Export intensity (LEXPQ) taken as a measure of a firm’s degree of exposition to international competition shows no significant effect. Firm age (LAGE) is positively correlated with KTT, older firms having a greater experience in cooperating with sci-ence institutions than do younger ones. There is no differsci-ence between domestic and foreign firms with respect to KTT activities (FOREIGN).
6 Multiple imputation is a statistical procedure for predicting missing values due to item non-response
based on the information of observed values. The idea behind multiple imputation is that for each missing value several values instead of just one are imputed by some econometric procedure.
The statistically significant negative coefficients of the variables for firm deficiencies (OBSTACLE2) and deficiencies of science institutions (OBSTACLE3) show that both kinds of obstacles can prevent firms from developing KTT activities. As the positive coefficient of the variable OBSTACLE1 shows, lack of information on the activities of science institutions is a problem for firms having KTT activities, not for firms without such activities; therefore it is not a proper obstacle to getting
involved in KTT.
Too high costs and/or risks (OBSTACLE4)—e.g., too high follow-up investment needed for the commercialization of research outcomes, uncertainty with respect to research outcomes)—do not seem to hamper KTT activities seriously. The slightly positive coefficient for this variable we interpret as a hint that cost and risk problems can emerge for firms which are already involved in KTT activi-ties.
Finally, organizational and institutional obstacles (OBSTACLE5)—such as prob-lems with property rights, lack of support of commercialization of outcomes, management problems of the science partner, etc., that are often considered as a main source of mismatching between enterprises and science institutions in the empirical literature—are not important in the case of Swiss firms.
There is a positive relationship between firm size and the propensity to KTT acti-vities (not shown in Table1). Larger firms anticipate more and better possibilities for KTT activities than do small ones, presumably due to their higher knowledge absorptive capacity (e.g., specialized R&D departments, “knowledge and technology monitoring” units, use of advanced methods of knowledge management).
5.2 Innovation Equation
Table1contains the tobit estimates for the two dependent variables (LRDS, LNEWS) with the variable KTT instrumented (columns 2 (Eq. 2a) and 5 (Eq. 2b)).
The variable reflecting the firms’ resource endowment (LCI) has the expected pos-itive sign and is highly significant only in the LNEWS equation (column 2) but not in the LRDS equation (column 5). Capital intensity does not appear to be a comple-ment to R&D intensity but an important precondition for a high share of new prod-ucts, which implies high follow-up investment expenditures after R&D for realizing the innovation. Further, we could find a weak positive effect of the variable LEX-PQ only for LNEWS. Older firms seem to be less innovative with respect to both innovation variables than are young ones; thus firm age (LAGE) is negatively cor-related with both innovation variables. After controlling for all other things, foreign firms seem to have a lower R&D intensity and a lower share of new products than do domestic ones, as is indicated by the negative sign of FOREIGN, but only in the LRDS estimate is the coefficient for this variable statistically significant. Further, firm size is positively correlated with the innovation variable LRDS but not with LNEWS.
Last but not least, the variable KTT has also the expected positive sign and is highly significant (columns 2 and 5 respectively). This is a further important result emphasiz-ing the relevance of KTT activities for a firm’s innovation performance. In accordance
with our expectations, there is a positive significant effect of KTT both for the input innovation (LRDS) and the output innovation variable (LNEWS).
Since the results are only cross-section estimates, it is not possible to test directly the existence of causal relations between the independent variables, particularly KTT, and the dependent variables. Nevertheless, some robust regularities emerge, which, if interpreted in view of our main hypothesis, could indicate the direction of causal links.
In sum, KTT activities seem to improve considerably the innovation performance of firms both in terms of R&D intensity and sales of new products.
5.3 Productivity Equation
As expected, the coefficients for the variable for physical capital (LCI) are positive and highly statistically significant (Table1; column 3 (Eq. 3aa), 4 (Eq. 3ab) and 6 (Eq. 3b)). The elasticity of gross investment per employee varies between 0.055 and 0.059, meaning that an increase of 1% of this variable is correlated with an increase of 0.055% to 0.059% of labour productivity. In accordance with earlier studies (e.g.,
Arvanitis and Hollenstein 2002), the elasticity of R&D intensity is lower than that of the physical capital intensity (0.008 vs. 0.059 in column 3). Further, the coeffi-cient of the LRDS variable is smaller than that of the LNEWS variable (0.008 vs. 0.044), reflecting the larger time lag between R&D expenditures and economic per-formance than between sales share of new products and economic perper-formance. Both coefficients become smaller and statistically insignificant with instrumented KTT due to the high multicollinearity between these variables; for this reason KTT is not included in the estimates in the columns 3, and 6; similarly, LRDS and LNEW are not included in the estimates in column 4. The coefficient of the variable FOREIGN is also positive and highly significant, which can be interpreted as a hint that for-eign firms are, after controlling for all other factors, more productive than domestic ones.
Now we turn to the technology transfer variable KTT (column 4). The coefficient of this variable is positive and highly significant. An economic interpretation of this coefficient is that on average a switch from a firm without KTT activities to a firm that is involved in such activities is correlated with an increase of 6.3% in labour productivity.7It seems that a direct link of KTT activities to productivity does really exist. This means that KTT active firms do have a productivity advantage vis-à-vis firms without such activities.
Moreover, the positive and significant coefficients of the (instrumented) innovation variables, which themselves are based on instrumented KTT, show that there is also an important indirect link of KTT activities via an innovation process, particularly R&D activities, to labour productivity.
Also in this case the warning with respect to causal conclusions based on cross-section investigations already mentioned in Sect.5.2has to be kept in mind.
7 We calculated the relative increase of labour productivity by the formulas: 100∗ln(1 + 0.065) = 6.3;
6 Summary and Conclusions
This study investigated the determinants of a wide spectrum of knowledge and technology transfer (KTT) activities (general information; educational activities; research activities; activities related with technical infrastructure; and consulting) as well as the impact of these activities (a) on two innovation indicators in the frame-work of an innovation equation with a variable for endogenized KTT activities as an additional determinant of innovation; and (b) on labour productivity in the framework of a production function with endogenized KTT activities and endogenized variables of innovation performance as additional production factors.
In sum, KTT activities with research institution and/or institutions of higher educa-tion seem to improve considerably the innovaeduca-tion performance of firms both in terms of R&D intensity and sales of new products.
Further, KTT activities seem to exercise a positive influence on labour produc-tivity both through a direct effect as well as through an indirect effect through the enhancement of innovation performance.
New elements of the analysis are: (a) the differentiated measurement of (the range of) KTT activities covering 19 single forms of KTT activities; (b) the use of a three-equation system for estimating the impact of KTT activities on innovation and eco-nomic performance; and (c) the wide coverage of industries and firm size classes (manufacturing, selected service industries, construction; firms with at least 5 emplo-yees). The main drawback of the study is the lack of data for more than one point of time, which does not allow the confirmation as well elaboration of the cross-sectional findings in a longitudinal framework. We hope to be able to offer some remedy for this problem in the near future.
Acknowledgements This study was financially supported by the ETH-Board. Comments and suggestions from the participants of the Annual Conference of the Swiss Association for Economics and Statistics in Lugano, Switzerland, 9–10 March 2006, the EUNIP Conference in Limerick, Ireland, 20–22 June 2006, the 33rd EARIE Conference in Amsterdam, Netherlands, 25–27 August 2006 and the 28th CIRET Conference, Rome, Italy, 20–22 September 2006, two anonymous referees and the editor of this journal are gratefully acknowledged.
Appendix
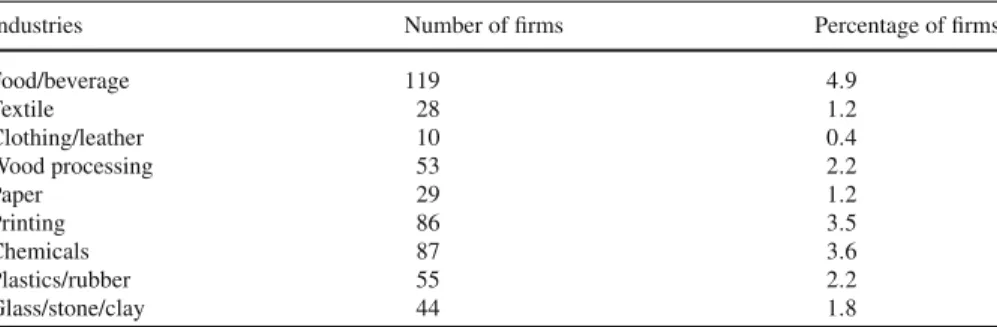
Table A1 Composition of the dataset by industry and firm size class
Industries Number of firms Percentage of firms
Food/beverage 119 4.9 Textile 28 1.2 Clothing/leather 10 0.4 Wood processing 53 2.2 Paper 29 1.2 Printing 86 3.5 Chemicals 87 3.6 Plastics/rubber 55 2.2 Glass/stone/clay 44 1.8
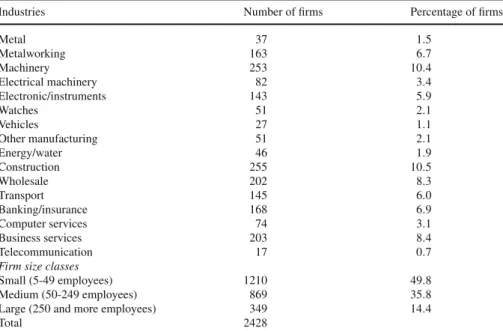
Table A1 continued
Industries Number of firms Percentage of firms
Metal 37 1.5 Metalworking 163 6.7 Machinery 253 10.4 Electrical machinery 82 3.4 Electronic/instruments 143 5.9 Watches 51 2.1 Vehicles 27 1.1 Other manufacturing 51 2.1 Energy/water 46 1.9 Construction 255 10.5 Wholesale 202 8.3 Transport 145 6.0 Banking/insurance 168 6.9 Computer services 74 3.1 Business services 203 8.4 Telecommunication 17 0.7
Firm size classes
Small (5-49 employees) 1210 49.8
Medium (50-249 employees) 869 35.8
Large (250 and more employees) 349 14.4
Total 2428
Table A2 Descriptive statistics
Variable Mean Std. Dev.
Q/L 311980 3888115 RDS 0.016 0.114 NEWS 8.037 14.911 KTT 0.260 0.439 QUAL 22.000 21.278 CI 27185 320787 EXPQ 28.818 34.029 AGE 56.806 41.249 R&D 0.317 0.465 FOREIGN 0.139 0.346 OBSTACLE1-OBSTACLE5 0.000 1.000
The variables Q/L, RDS, NEWS, QUAL, CI, EXP, and AGE are the natural numbers of the logarithms LQ/L, LRDS, LNEWS, LQUAL, LCI, LEXPQ, and LAGE respectively used in the estimates; OBSTACLE1 to OBSTACLE5 are factor values resulting from a principal component factor analysis and have a mean of 0 and a standard deviation of 1
Ta b le A 3 Correlation m atrix Q U AL CI EXPQ A G E R &D FOREIGN OBST A C LE 1 O BST A CLE2 OBST A C LE3 OBST A C LE4 OBST A C LE5 KTT R DS CI 0. 012 EXPQ 0. 170 − 0. 025 AG E − 0. 135 − 0. 005 − 0. 031 R&D 0. 141 − 0. 021 0. 446 0. 043 FOREIGN 0. 152 − 0. 012 0. 261 − 0. 074 0. 117 OBST ACLE1 0. 033 0. 014 0. 082 − 0. 046 0. 131 − 0. 027 OBST ACLE2 − 0. 098 − 0. 030 − 0. 050 − 0. 021 − 0. 113 − 0. 017 0. 000 OBST ACLE3 0. 020 − 0. 001 − 0. 011 0. 011 0. 010 − 0. 022 0. 000 0. 000 OBST ACLE4 0. 070 0. 027 0. 167 − 0. 004 0. 221 0. 056 0. 000 0. 000 0. 000 OBST ACLE5 0. 055 − 0. 034 0. 077 − 0. 027 0. 075 0. 009 0. 000 0. 000 0. 000 0. 000 KTT 0. 189 − 0. 017 0. 283 0. 104 0. 493 0. 104 0. 100 − 0. 133 − 0. 044 0. 139 0. 059 RDS 0. 113 − 0. 002 0. 128 − 0. 004 0. 205 0. 067 0. 038 − 0. 070 0. 013 0. 063 0. 029 0. 140 NEWS 0. 048 − 0. 016 0. 205 − 0. 028 0. 288 0. 068 0. 118 − 0. 053 0. 023 0. 132 0. 049 0. 175 0. 110 The v ariables Q/L, RDS, NEWS, Q U A L, CI, E XPQ, and A GE are the natural numbers of the logarithms LQ/L, L RDS, LNEWS, LQ U A L, LCI, LEXPQ, and L A G E respecti v ely used in the estimates
References
Adams, J. D., Chiang, E. P., & Jensen, J. L. (2003). The influence of federal laboratory R&D on industrial research. Review of Economics and Statistics, 85(4), 1003–1020.
Arvanitis, S. (1997). The impact of firm size on innovative activity. An empirical analysis based on Swiss firm data. Small Business Economics, 9(6), 473–490.
Arvanitis, S., & Hollenstein, H. (1996). Industrial innovation in Switzerland: A model-based analysis with survey data. In A. Kleinknecht (Ed.), Determinants of innovation. The message from new indicators (pp. 13–62). London: Macmillan.
Arvanitis, S., & Hollenstein, H. (2002). The impact of technological spillovers and knowledge heterogeneity on firm performance: Evidence from Swiss manufacturing. In A. Kleinknecht & P. Mohnen (Eds.),
Innovation and firm performance (pp. 224–252). London: Palgrave.
Arvanitis, S., Sydow, N., & Woerter, M. (2005). Is there any impact of university–industry knowledge transfer on the performance of private enterprises? – An empirical analysis based on Swiss firm data. KOF Working Paper No. 117. Zurich: KOF.
Becker, W. (2003). Evaluation of the role of universities in the innovation process. Volkswirtschaftliche Diskussionsreihe Beitrag Nr. 24. Augsburg: Institut für Volkswirtschaftslehre Universität Augsburg. Belderbos, R., Carree, M., & Lokshin, B. (2004). Cooperative R&D and firm performance. Research Policy,
33, 1477–1492.
Benfratello, L., & Sembenelli, A. (2002). Research joint ventures and firm level performance. Research
Policy, 31, 493–507.
Bönte, W. (2003). Does federally financed business R&D matter for US productivity growth? Applied
Economics, 35, 1619–1625.
Bönte, W. (2004). Spillovers from publicly financed business R&D: Some empirical evidence from Germany. Research Policy, 33, 1635–1655.
Bozeman, B. (2000). Technology transfer and public policy: A review of research and theory. Research
Policy, 29, 627–655.
Brandstetter, L., & Ogura, Y. (2005). Is academic science driving a surge in industrial innovation? Evidence from patent citations. NBER Working Paper No. 11561, Cambridge. Mass.
Donzé, L. (2001). L’imputation des données manquantes, la technique de l’imputation multiple, les con-séquences sur l’analyse des données: l’enquête 1999 KOF/ETHZ sur l’innovation’. Schweizerische Zeitschrift für Volkswirtschaft und Statistik, 137(3), 301–317.
Fritsch, M., & Franke, G. (2004). Innovation, regional knowledge spillovers and R&D co-operation.
Research Policy, 33, 245–255.
Georghiou, L., & Roessner, D. (2000). Evaluating technology programmes: Tools and methods. Research
Policy, 29, 657–678.
Guellec, D., & van Pottelsberghe de la Potterie, B. (2001). R&D and productivity growth: Panel data analysis of 16 OECD Countries. OECD STI Working Papers 2001/3. Paris: OECD.
Guellec, D., & van Pottelsberghe de la Potterie, B. (2003). The impact of public R&D expenditure on business R&D. Economics of Innovation and New Technology, 12(3), 225–243.
Hall, B. H., Link, A. N., & Scott, J. T. (2003). Universities as research partners. Review of Economics and
Statistics, 85(2), 485–491.
Hall, B., & Van Reenen, J. (2000). How effective are fiscal incentives for R&D? A review of the evidence.
Research Policy, 29, 449–469.
Halvorsen, R., & Palmquist, R. (1980). The interpretation of dummy variables in semilogarithmic equations.
American Economic Review, 70(3), 474–475.
Kaufmann, A., & Tödtling, F. (2001). Science-industry interaction in the process of innovation: The impor-tance of boundary-crossing between systems. Research Policy, 30, 791–804.
Klette, T. J., Moen, J., &. Griliches, Z. (2000). Do subsidies to commercial R&D reduce market failures? Microeconometric evaluation studies. Research Policy, 29, 471–495.
Klevorick, A. K., Levin, R. C. Nelson, R. R., & Winter, S. G. (1995). On the sources and significance of interindustry differences in technological opportunities. Research Policy, 24, 185–205.
Lööf, H., & Broström, A. (2006). Does knowledge diffusion between university and industry increase innovativeness? CESIS Electronic Working Papers Series No. 21. Stockholm: The Royal Institute of Technology.
Mamuneas, T. P. (1999). Spillovers from publicly financed R&D capital in high-tech industries.
Mansfield, E. (1991). Academic research and industrial innovation. Research Policy, 20, 1–12.
Mansfield, E. (1998). Academic research and industrial innovation: An update of empirical findings.
Research Policy, 26, 773–776.
Medda, G., Piga, C., & Siegel, D. S. (2005). University R&D and firm productivity: Evidence from Italy.
Journal of Technology Transfer, 30(1/2), 199–205.
Mohnen, P., & Hoareau, C. (2003). What type of enterprise forges close links with universities and govern-ment labs? Evidence from CIS2. Managerial Decision Economics, 24, 133–145.
Monjon, S., & Waelbroeck, P. (2003). Assessing spillovers from universities to firms: Evidence from French firm-level data. International Journal of Industrial Organization, 21, 1255–1270.
Nelson, R. R. (1986). Institutions supporting technical advance in industry. American Economic Review,
Papers & Proceedings, 76(2), 186–189.
OECD. (1999). Special Issue on “Public/Private Partnerships in STI Review No. 23. Paris: OECD. OECD. (2002). Benchmarking industry-science relationships. Paris: OECD.
OECD. (2003). Turning science into business, Patenting and Licensing at Public Research Organizations. Paris: OECD.
Rubin, D. B. (1987). Multiple imputation for non-response in surveys. New York: John Wiley.
Sorensen, A., Kongsted, H. C., & Marcusson, M. (2003). R&D, public innovation policy, and productivity: The case of danish manufacturing. Economics of Innovation and New Technology, 12(2), 163–178. Veugelers, R., & Cassiman, B. (2005). R&D cooperation between firms and universities. Some empirical
evidence from Belgian manufacturing. International Journal of Industrial Organisation, 23, 355–379. Zinkl, W., & Huber, H. (2003). Strategie für den Wissens- und Technologietransfer an den Hochschulen in der Schweiz. Mandat im Auftrag der Schweizerischen Universitätskonferenz SUK, Hauptbericht: Strategie und Politik im WTT. Basel: SUC.