Research Paper
A High Throughput Protein Formulation Platform: Case Study of Salmon
Calcitonin
Martinus A. H. Capelle,1Robert Gurny,1and Tudor Arvinte1,2
Received April 4, 2008; accepted June 10, 2008; published online July 4, 2008
Purpose. The feasibility of using high throughput spectroscopy for characterization and selection of physically stable protein formulations was studied.
Materials and Methods. A hundred aqueous formulations of salmon calcitonin (sCT) were prepared using 20 buffer compositions. The solutions had pH values between 2.5 and 10.5. The stability of the sCT formulations was analyzed over 1 week by the following assays: (1) protein concentration, (2) volume control by measuring pathlength, (3) turbidity (absorbance at 350 nm), (4) intrinsic tyrosinefluorescence, (5) 1-anilino-naphthalene-8-sulfonate (ANS)fluorescence, (6) Nile Red fluorescence. Addition of the dyes (Nile Red and ANS) was used to study protein conformational changes.
Results. After 1 day, 27 out of the 100 formulations of salmon calcitonin were stable. After 7 days, 12 stable sCT formulations remained. The best salmon calcitonin formulation was in 10 mM sodium acetate buffer with pH values between 3.5 and 5.5.
Conclusions. The findings are in accordance with the sCT formulations that were patented and used commercially. This can be considered as a proof of concept for the high throughput protein formulation platform.
KEY WORDS: high throughput screening; protein formulation; salmon calcitonin; spectroscopy; stability.
INTRODUCTION
Calcitonin is a naturally occurring polypeptide hormone involved in the regulation of calcium and bone metabolism. Calcitonin is produced in parafollicular cells of the human thyroid gland (1). In patients with osteoporosis, calcitonin is used to increase the bone density, prevent bone loss and fractures. In addition, calcitonin reduces acute pain due to osteolytic fractures, vertebral crush fractures, and osteolytic bone metastasis (2). Clinically, calcitonin is indicated for the treatment of postmen-opausal osteoporosis and Paget’s disease of the bone, either
alone or in combination with other drugs. Calcitonin is only indicated for women who are at least 5 years beyond meno-pause, or for women who cannot take alternative medication (3). Commercially, salmon calcitonin (sCT) is produced synthet-ically or by using recombinant DNA techniques. Thefirst salmon calcitonin product (Calcimar®) was approved in 1975 by the Food and Drug Administration (FDA). A human calcitonin product (Cibacalcin®) was approved by the FDA in 1986. Salmon calcitonin consists of 32 amino acids and differs from human calcitonin by 13 residues. At present, in the USA, several salmon calcitonin formulations are approved for parenteral (50–100 IU daily, preferably by subcutaneous or intramuscular injection) or nasal (200 IU daily) administration. A list of the marketed salmon calcitonin drug products, approval date, manufacturers, route of administration and excipients is given in TableI. The specific activity of sCT was defined as having 6,000 IU/mg in the Third International Standard by the World Health Organization (4). The commercial formulations contain either 200 (injection) or 2,200 IU/ml (multi-dose nasal spray), which corresponds to sCT concentrations of 0.033 and 0.37 mg/ml, respectively. sCT is formulated with an acetate buffer (sCT international standard, Calcimar®, Miacalcin®for injection, Forcaltonin®), hydrochloric acid (Miacalcin nasal spray) or citric acid (Fortical®).
By 2009, about $10 billion worth of biopharmaceuticals will have lost patent protection (5). New protein formulations that are better or bioequivalent to existing protein drugs can be marketed as‘biogenerics’ after the patent has expired. An increase in ‘biogenerics’ and improved biopharmaceutical 0724-8741/09/0100-0118/0 # 2008 Springer Science + Business Media, LLC 118
DOI: 10.1007/s11095-008-9662-8
Electronic supplementary material The online version of this article (doi:10.1007/s11095-008-9662-8) contains supplementary material, which is available to authorized users.
1Department of Pharmaceutics and Biopharmaceutics, School of Pharmaceutical Sciences, University of Geneva, University of Lausanne, Quai E-Ansermet 30, 1211, Geneva 4, Switzerland. 2To whom correspondence should be addressed. (e-mail: Tudor.
ABBREVIATIONS: ADA, N-(2-acetamido)iminodiacetic acid; ANS, 1-anilino-naphthalene-8-sulfonate; BSA, bovine serum albumin; CAPSO, 3-(cyclohexylamino)-2-hydroxy-1-propanesulfonic acid; EMEA, European Agency for the Evaluation of Medicinal Products; FDA, Food and Drug Administration; HEPES, 4-(2-hydroxyethyl) piperazine-1-ethanesulfonic acid; HTF, high throughput formulation; HTS, high throughput screening; IU, International units; MOPS, 3-morpholinopropane sulfonic acid; sCT, salmon calcitonin; TES, N-[tris (hydroxymethyl)methyl]-2-aminoethanesulfonic acid.
formulations, supergenerics (6), can be expected which would benefit from a fast drug development and formulation screening platform. In order to achieve these goals a high throughput formulation (HTF) platform was developed. The HTF platform was based on an advanced liquid handling system and a UV absorbance/fluorescence microplate reader to study the physical and chemical stability of proteins and peptides. The HTF platform can help in selecting protein stabilizing excipients for further protein formulation optimi-zation. The use of multi-well plates allows the formulation scientist to screen for a variety of parameters, excipients and conditions using a relatively small amount of protein. As a proof of concept of the HTF platform, the sCT stability in 100 buffer solutions was characterized. The buffer solutions, prepared from 20 buffer types, have pH values between 2.5 and 10.5, and were selected based on their chemical diversity.
MATERIALS AND METHODS Materials
The chemicals required for preparing the buffer solutions, and the dyes 1-anilino-naphthalene-8-sulfonate (ANS) and Nile Red, were provided by Sigma-Aldrich (Sigma-Aldrich Chemie GmbH, Buchs, Switzerland). The 20 10 mM buffer solutions (TablesIIandIII) consisted of: (1) glycine–hydrochloric acid, (2) citric acid–sodium citrate, (3) citric acid–sodium phosphate dibasic, (4) potassium phthalate–sodium hydroxide, (5) succinic acid–sodium hydroxide, (6) ammonium acetate–acetic acid, (7) histidine–hydrochloric acid, (8) sodium acetate–acetic acid, (9) β,β′-dimethyl glutaric acid–sodium hydroxide, (10) Tris (hydroxymethyl)aminomethane–maleate, (11) sodium phos-phate monobasic–sodium phosphos-phate dibasic, (12) N-(2-acet-amido)iminodiacetic acid (=ADA)–hydrochloric acid, (13) citric acid–potassium phosphate dibasic, (14) 3-(N-morpho-lino)propanesulfonic acid (=MOPS)–potassium hydroxide, (15) 4-(2-hydroxyethyl)-1-piperazine-1-ethanesulfonic acid (=HEPES)–sodium hydroxide, (16) N-[tris(hydroxymethyl) methyl]-2-aminoethanesulfonic acid (=TES)–hydrochloric acid, (17) Tris(hydroxymethyl)aminomethane–hydrochloric acid, (18) glycine–sodium hydroxide, (19) 3-(cyclohexylamino)-2-hydroxy-1-propanesulfonic acid (=CAPSO)–sodium hydrox-ide, (20) sodium carbonate–sodium bicarbonate.
The salmon calcitonin was obtained from Novartis (Novartis AG, Basel, Switzerland). UV transparent 96-well Costar® (no. 3635) Corning (Corning Inc., New York, NY, USA) microplates were supplied by Vitaris (Vitaris SA, Baar, Switzerland). UV-Vis transparent and pressure sensitive G r ei n e r V I E W s e a l s™ (Greiner Bio-One GmbH, Frickenhausen, Germany) were acquired from Huber & Co. AG (Reinach, Switzerland). Sterile and single wrapped polystyrene reservoirs with 12 channels (no. 330.12.9) from Socorex (Socorex Isba S.A., Ecublens, Switzerland) contained in total 40 ml and were supplied by Milian (Milian S.A., Geneva, Switzerland). A Millipore (Millipore Corp., Bedford, Massachusetts) filtration system, comprised of a vacuum driven disposable bottle top (Stericup™) with 0.22μm Durapore™ filter and a presterilized receiver flask (Steritop™), was used for the filtration of all non-protein solutions. T able I. The Marke ted Salmon Calcitonin Produc ts that are Appro ved in the USA and Europ e are Listed Marke ted prod ucts Route of admin istration S torage E xcipients Calcim ar ®, Sano fi -A ven tis; 1975 FDA appro ved; 2005 discon tinued So lution for injection 2– 8°C; stable 2 week s a t room tempe rature 200 IU sCT/ml; acetic acid 2.25 mg; ph enol 5.0 mg; sodiu m ace tate trihydrate 2.0 mg; sodiu m chloride 7.5 mg; water for injection qs 1.0 ml Miacalcin ®, Novart is; 1997 FDA appro ved So lution for injection 2– 8°C 200 IU sCT/ml; acetic acid 2.25 mg; ph enol 5.0 mg; sodiu m ace tate trihydrate 2.0 mg; sodiu m chloride 7.5 mg; water for injection qs 1.0 ml Forc altonin ®, U n igene; 1999 EU appro ved So lution for injection 2– 8°C; visual inspec tion fo r par ticulate matter and discoloration prior to use 100 IU sCT/ml; acetic acid, glacial, sodiu m ace tate trihyd rate, sodiu m chloride, wate r for inje ction s Miacalcin ® , Novart is; 1995 FDA appro ved Nasa l spray Multido se Before use at 2– 8°C; in use at 15 –30° C for 35 days 2,20 0 IU sC T/ml; sod ium chloride, benzalk onium chloride, hydro chloric acid and puri fi ed water 200 IU/spra y Fort ical ® , U n igene; 2005 FDA approved Nasa l spray Multido se Before use at 2– 8°C; in use at 20 –25° C for 30 days 2,20 0 IU sC T/ml; sod ium chloride, citric acid, phen yl eth yl alcoh ol, benz yl alco hol, polysorb ate 80, hyd rochloric acid or sodiu m hydro xide and puri fi ed wate r 200 IU/spra y The used sC T concen tration, excipie nts, concen tration , dosage forms and storage conditio ns are given . The data were co llected fro m the Food and Dru g Adm inistration (F DA) , Euro pean Agen cy for the Evaluation of Medic inal Produc ts (EM EA) and prescribing informat ion of drug manu factu rers.
Preparation of Protein Formulations
A stock solution of 8.0 mg/ml salmon calcitonin in purified MilliQ™ Millipore water was freshly prepared. A hundred 40 mM buffer solutions with pH values between 2.5 and 10.5 (TableII) were prepared using sterilefiltered 0.20 M buffer solutions. The stability of salmon calcitonin was tested at a concentration of 2.0 mg/ml. This concentration is higher than the 0.033 and 0.37 mg/ml sCT concentrations that are used in the marketed sCT drug products. Previous work showed that with an increase in calcitonin concentration a decrease in fibrillation time was determined (7). It was assumed that at a 2.0 mg/ml sCT concentration during a
reasonable amount of time the different aggregation proper-ties would be distinguishable.
The sCT formulations were prepared in 96-well plates with a Sciclone ALH500 liquid handling station from Caliper Life Sciences (Hopkinton, USA). The sample preparation protocol using the liquid handling station was composed of the following steps: (1) 100 or 98μl (if a dye was added) of water was dispensed using the bulk tool, (2) 50μl of buffer was pipetted using the Z-8 liquid handling device with disposable tips, (3) 50μl of sCT solution was added, similar to the dispensing of the buffer solutions, (4) 2 μl of a dye, 0.20 mM ANS or 0.10 mM Nile Red, was simultaneously added to all 96 wells using a low-volume 96-canula array. The
Table II. The Table Summarizes the Results of the Turbidity, ANS and Nile Red Fluorescence Assays After 1 Day
10mM Buffers
pH
2.5 3.0 3.5 4.0 4.5 5.0 5.5 6.0 6.5 7.0 7.5 8.0 8.5 9.0 9.5 10.0 10.5
1
Glycine – Hydrochloric acid U N UN U NA A A
2
Citric acid – Sodium citrate UN U N UN UN UN UN U NA A A A A A A
3
Citric acid – Sodium phosphate dibasic UN U N UN UN UN UN U N U N U N U NA A A A A A A A A A
4
Citric acid – Potassium phosphate dibasic UN U N UN UN UN UN U N U N U NA A A A A A A A A
5
βSodium hydroxide,β'-Dimethylglutaric acid – U N UN UN UN UN U N U N U N U NA A A A A A A A A
6
Acetic acid – Sodium acetate U N UN UN UN UNA A A A A
7
Potassium phthalate – Sodium hydroxide UN UN UN UN U NA A A A A
8
Succinic acid – Sodium hydroxide UN UN UN UN U NA A A A A
9
Acetic acid – Ammonium acetate UN UN UN U N U NA A A A A
10
Histidine – Hydrochloric acid UN U N U N U N U NA A A A A
11
Tris – Maleate UN U N U N U N U N U NA A A A A A
12
Sodium phosphate monobasic – Sodium phosphate dibasic U N U N U N U N U NA A A A A
13
ADA – Hydrochloric acid U N U N U NA A A
14
MOPS – Potassium hydroxide U N U N U NA A A
15
HEPES – Sodiumhydroxide U N U N U NA A A
16
TES – Hydrochloric acid U N U N U NA A A
17
Tris – Hydrochloric acid U N U N UN UNA A A A
18
Glycine – Sodium hydroxide UN U N U N U NA A A A
19
CAPSO – Sodium hydroxide UN U N U NA A A
20
Sodium carbonate – Sodium bicarbonate U N U N U NA A A
The pH values between pH 2.5 and 10.5, with 0.5 pH unit intervals, are highlighted for the 20 buffer solutions used. Each assay was assigned a U, A, N which represents the UV turbidity assay, ANSfluorescence emission and Nile Red fluorescence emission, respectively. The samples found stable with the respective assays have a white background and unstable a grey background.
100 test formulations were composed of 2.0 mg/ml sCT in 10 mM buffer and were prepared in three variants; with 50μM ANS, with 1 μM Nile Red and with neither. Each 96-well plate contained 20 sCT formulations (each formulation in quadruplicate), four sCT samples in water, ten buffer control solutions, one purified MilliQ water and one empty well (an example of a prepared plate is given in Fig.2A). If 2μl dye (ANS or Nile Red) was added to the microplate, 2 μl less water was used. The control solutions included all buffer types. The outer columns, 1 and 12, contained no sCT in buffer since in these columns evaporation is more likely to occur (8). For each sCT formulation three microplates were
prepared and analyzed, making a total of 15 UV transparent Corning Costar®96-well plates: sCT in buffers, sCT in buffers with ANS and sCT in buffers with Nile Red. After sample preparations, the plates were sealed with a Greiner VIEWseal™ and incubated at 25°C in the dark during 7 days. High Throughput Spectroscopic Analysis
sCT is a polypeptide hormone with a molecular weight of 3,600 Da and contains 32 amino acids, one of which is the fluorophore tyrosine. The sCT fluorescence emission and absorbance was measured with a Tecan (Tecan Group Ltd.,
Table III. The results of the tyrosinefluorescence, ANS fluorescence, Nile Red fluorescence and turbidity assays 7 days after preparation are summarized
10mM Buffers
pH
2.5 3.0 3.5 4.0 4.5 5.0 5.5 6.0 6.5 7.0 7.5 8.0 8.5 9.0 9.5 10.0 10.5
1
Glycine – Hydrochloric acid U T U T U TA N A N A N2
Citric acid – Sodium citrate U T U T U T U T U T U T U TA N A N A N A N A N A N A N3
Citric acid – Sodium phosphate dibasic U T U T U T U T U T U T U T U T U T U TA N A N A N A N A N A N A N A N A N A N4
Citric acid – Potassium phosphate dibasic U T U T U T U T U T U T U T U T U TA N A N A N A N A N A N A N A N A N5
βSodium hydroxide,β'-Dimethylglutaric acid – U T U T U T U T U T U T U T U T U TA N A N A N A N A N A N A N A N A N6
Acetic acid –Sodium acetate U T U T U T U T U TA N A N A N A N A N7
Potassium phthalate – Sodium hydroxide U T U T U T U T U TA N A N A N A N A N8
Succinic acid – Sodium hydroxide U T U T U T U T U TA N A N A N A N A N9
Acetic acid – Ammonium acetate U T U T U T U T U TA N A N A N A N A N10
Histidine – Hydrochloric acid U T U T U T U T U TA N A N A N A N A N11
Tris – Maleate U T U T U T U T U T U TA N A N A N A N A N A N12
Sodium phosphate monobasic – Sodium phosphate dibasic U T U T U T U T U TA N A N A N A N A N13
ADA – Hydrochloric acid U T U T U TA N A N A N14
MOPS – Potassium hydroxide U T U T U TA N A N A N15
HEPES – Sodium hydroxide U T U T U TA N A N A N16
TES – Hydrochloric acid U T U T U TA N A N A N17
Tris – Hydrochloric acid U T U T U T U TA N A N A N A N18
Glycine – Sodium hydroxide U T U T U T U TA N A N A N A N19
CAPSO – Sodium hydroxide U T U T U TA N A N A N20
Sodium carbonate – Sodium bicarbonate U T U T U TA N A N A NEach assay was assigned a U, A, N, T which represents the UV turbidity assay, ANS emission, Nile Red emission and tyrosine emission, respectively. The samples found stable with the respective assays have a white background and unstable a grey background. The selected stable sCT formulations complied with all four assays.
Männedorf, Switzerland) Safire™ microplate reader. The fluorescence was measured using the bottom optics. The fluorescence emission of tyrosine was determined between 295 and 400 nm. Excitation was at 274 nm using bandwidths for both excitation and emission of 7.5 nm. The sCT formulations plus ANS were excited at 378 nm and the emission was monitored between 460 and 520 nm (examples shown in Fig.3A and B). Thefluorescence emission of Nile Red in the presence of sCT was studied between 610 and 670 nm after excitation at 575 nm (examples shown in Fig.3A and B). Thefluorescence emission of ANS and Nile Red was analyzed with two different settings, a high and low detection sensitivity in order to characterize both strong and weak interactions between the dyes and sCT. The turbidity of sCT formulations was measured by studying the absorbance at 350 nm (9). The volume or pathlength was controlled by monitoring the absorbance of water at 975 nm (10). The concentration of sCT was calculated and the sample prepara-tion controlled by measuring the UV absorbance at 274 nm (11). The fluorescence and absorbance was measured at day 0, 1 and 7. The data output of the XFluor®software of the Tecan Safire™ microplate reader is in Microsoft® Excel™. Visual basic macros were developed by the authors to enable high throughput data analysis.
RESULTS Spectroscopy
The physical stability of 2.0 mg/ml sCT was studied in 100 buffer solutions. One of the selection criteria for a stable sCT formulation is to have an absorbance value below 0.075 at 350 nm. All sCT formulations had absorbance values at 350 nm between 0.04 and 0.06 directly after sample prepara-tion as well as after 1 day, which were similar to the absorbance values of the control solutions. Many sCT formulations at neutral pH values became turbid after 7 days, in contrast to sCT formulations at acidic and basic pH values. Some sCT formulations aggregated and formed different structures, such as gels with varying amount of transparency, white clumps or dots. In some cases a formulation contained protein aggregates that were attached to the sides of wells. Since the absorbance measurement is done in the center of the well, no increase in absorbance signal was detected. A visual inspection of all wells was performed to check for the presence of small aggregates.
The intrinsic tyrosine fluorescence decreased between day 0 and 1 from about 34,000 (relativefluorescence units) to about 24,000 RFU (see Supplementary Fig.1). This effect was attributed to an increase in the solution temperature between day 0 and 1. The sCT formulations were prepared with buffer solutions that were stored at 4°C. The sCT formulations at pH values above 9 showed a decrease in intrinsic fluores-cence intensities, caused by the lower absorbance energy of tyrosine due to deprotonation. The lower fluorescence intensities observed in potassium phthalate and Tris–maleate buffer are ascribed to the UV absorbance of these buffer solutions. The sCT formulations with a less than 6% increase or decrease in tyrosine fluorescence intensity between day 1 and 7 were considered stable. Changes in sCT stability were better distinguished, compared to the
intrinsic tyrosine assay, after addition of ANS or Nile Red. Only sCT in glycine–HCl pH 3.5 had a strong deviation in intrinsic fluorescence, with no increased ANS or Nile Red fluorescence.
The ANS fluorescence emission spectra were analyzed for each salmon calcitonin formulation. The maximum fluorescence emission of ANS was found between 480 and 490 nm. In contrast to the Nile Red fluorescence emission, the ANS maximumfluorescence emission did not shift when bound to the salmon calcitonin. Therefore, the average ANS emission at 485 nm was used for the sCT formulation evaluation (see electronic supplementary material). The measured ANS intensities differed with pH and buffer type, indicating different affinities of ANS towards the formed salmon calcitonin structures. The highest ANS fluorescence intensities were observed between pH 5 and 8.
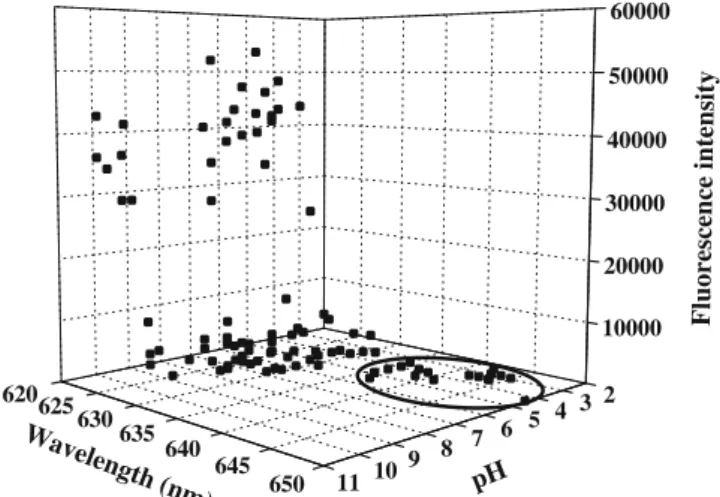
In some formulations, binding of Nile Red to salmon calcitonin resulted in a blue shift in thefluorescence emission maxima from about 645 to about 620 nm and with a respective increase in fluorescence intensity of ~150 to 55,000 RFU (Fig. 1). Nile Red emission spectra of 20 sCT formulations measured after 1 day in a 96-well plate were recorded with a high sensitivity and are shown in Fig.2B. The samples in the corresponding 96-well plate are shown in Fig. 2A. Measurements using high sensitivity settings are useful for fast screening of sCT formulations. However, they do not always offer detailed information on the maximum emission wavelength. Flattening of some of thefluorescence emission curves (Fig. 2B) was caused by saturation of the detector. The maximum emission intensities with corre-sponding wavelengths were automatically extracted from the Nile Red emission spectra recorded with low sensitivity settings. A three-dimensional representation of the emission wavelength maxima and correspondingfluorescence intensi-ties of sCT in a 100 buffer solutions, measured 7 days after preparation, is shown in Fig. 1. The sCT formulations with Nile Redfluorescence emission maxima higher than 630 nm and average intensities lower than 300 were considered stable according to the Nile Red assay. The intensity of 300
2 3 4 5 6 7 8 9 10 11 620625 630 635 640 645 650 10000 20000 30000 40000 50000 60000 Fluorescence intensity Wavelength (nm) pH
Fig. 1. The Nile Red fluorescence after 7 days in 100 sCT formulations is shown. The black values are in three-dimensional space. Binding of Nile Red to sCT resulted in a blue shift from 645 to 620 nm and a fluorescence increase of 150 to 55,000. The stable formulations are encircled.
corresponds to twice the average value of Nile Red in presence of the control solutions. Shifts in the emission maxima of Nile Red greater than 15 nm are significant. Therefore a limit of 630 nm for the emission maximum of Nile Red was used as one of the selection criteria for obtaining stable sCT formulations.
Two buffer solutions, in which the salmon calcitonin was found stable and unstable, are sodium acetate and sodium citrate. The average of the four endpoint measurements plus the ANS and Nile Red fluorescence spectra of the four replicates per formulation are shown in Fig. 3A and B. An increase in the extrinsicfluorescence intensity is an indication of protein instability, such as aggregation. After 7 days, salmon calcitonin in sodium citrate pH 3.0 and 3.5 had an increased turbidity monitored at 350 nm (Fig.3A). However, no change was observed in any of the three fluorescence assays (Fig. 3A). No change in ANS fluorescence was observed for sCT in sodium citrate pH 4.0, although an increased Nile Redfluorescence and increased absorbance at 350 nm were measured (Fig. 3A). All sodium acetate sCT
formulations with pH values of 3.5 to 5.5 were found stable according to all four assays (Fig. 3B). The Nile Red fluorescence intensity decreased in time, which was also observed for other stable sCT formulations. This decrease can be related to the adsorption of Nile Red to the walls of the 96-well plate.
A summary of the ANS and Nile Redfluorescence and absorbance at 350 nm after 1 day of sample preparation is given in TableII. After 1 day, an increased ANS and Nile
Red fluorescence was observed for most of the sCT
formulations with pH values higher than 4.5. The results after 7 days, regarding the turbidity at 350 nm, intrinsic tyrosine fluorescence, ANS fluorescence and Nile Red fluorescence assays are summarized in Table III. The absorbance spectra, tyrosinefluorescence, ANS fluorescence and Nile Redfluorescence emission spectra were analyzed for each of the sCT formulations and the average results are shown in electronically available supplementary material.
The overview Tables II and III and the following examples highlight the necessity of using several
complemen-Fig. 2. A, B 20 sCT formulations (columns 2 to 11) and the respective controls (columns 1 and 12) are given on the top, in A. Asterisk is an example of the description of the well (sCT control in water) with the correspondingfluorescence intensity. Four replicates per formulation were prepared. Nile Red emission spectra after 7 days, using high sensitivity settings, are shown on the bottom, in B. The sCT in sodium citrate and sodium citrate phosphate pH 3.0 and 3.5 and in glycine pH 2.5 to 3.5 remained stable.
tary methods for the selection of stable protein formulations. Salmon calcitonin in glycine–HCl buffer had after 7 days no increase in ANS and Nile Red fluorescence intensity. However, an increased turbidity (pH 2.5, 3.0 and 3.5) and variation in the intrinsic tyrosinefluorescence (pH 3.5) were measured. Salmon calcitonin was more stable at low pH values in potassium citrate phosphate than in sodium citrate phosphate. Analysis of the individual ANS fluorescence spectra at pH 3.0 revealed that the strong ANSfluorescence is caused by one out of four replicates. A strong variation in extrinsic fluorescence intensities was observed with sCT in potassium citrate phosphate, sodium citrate phosphate and sodium citrate solutions with pH values lower than 6. This is probably due to the still on-going aggregation of tree or branched-like structures that formed in time a protein gel. The
sCT formulations in the same buffer solutions at pH values of 6 and higher formed, in less than a week, turbid homogeneous gels. These observations were visible with the eye.
Salmon calcitonin was found to be unstable at pH values between 4.0 and 6.0 in sodium succinate, because of an increased turbidity at 350 nm. However, the ANS and Nile Redfluorescence intensities remained low for pH 4.0 and 4.5 (Table III and online available supplementary material). Salmon calcitonin formulations in ammonium acetate buffer pH 5.0 and higher had an increased ANSfluorescence, which was not observed for sCT in sodium acetate (Table III and Fig.3). The sCT aggregated in histidine solutions according to the four assays at all measured pH values. The use of sodium phosphate resulted in increased absorbance values and changes in intrinsic and extrinsicfluorescence intensities of sCT.
Sodium citrate
UV (350nm) F (Tyr) F (ANS) F (Nile Red)
2 3 4 5 6 7 8 9 10 11 0.0 0.1 0.2 0.3 0.4 0.5 0.6 0.7 z pH 2 3 4 5 6 7 8 9 10 11 0 5000 10000 15000 20000 25000 30000 35000 40000 pH 2 3 4 5 6 7 8 9 10 11 0 500 1000 1500 2000 10000 20000 30000 40000 50000 pH 2 3 4 5 6 7 8 9 10 11 0 500 1000 1500 2000 10000 20000 30000 40000 50000 pH
Day 0 Day 1 Day 7 Legend
F (ANS) 460 470 480 490 500 510 520 0 200 400 600 800 1000 1200 Wavelength (nm) 460 470 480 490 500 510 520 0 2000 4000 6000 8000 10000 Wavelength (nm) 460 470 480 490 500 510 520 0 5000 10000 15000 20000 25000 30000 35000 40000 Wavelength (nm) F (Nile Red) 610 620 630 640 650 660 670 0 200 400 600 800 1000 1200 1400 1600 1800 2000 Wavelength (nm) 610 620 630 640 650 660 670 0 2000 4000 6000 8000 10000 Wavelength (nm) 610 620 630 640 650 660 670 0 5000 10000 15000 20000 25000 30000 35000 40000 45000 50000 Wavelength (nm) pH 3.0 pH 3.5 pH 4.0 pH 4.5 pH 5.0 pH 5.5 pH 6.0
Fig. 3. A The UV absorbance at 350 nm, tyrosine intrinsicfluorescence emission at 308 nm, ANS emission intensity at 485 nm and Nile Red maximumfluorescence intensity measured after 0 (filled circles), 1 (empty circles) and 7 days (x marks) are given. The ANS and Nile Red fluorescence spectra of sCT in sodium citrate after 0, 1 and 7 days are shown of the four replicates per pH value. The fluorescence intensity axes were optimized for each day. The sCT was unstable in sodium citrate with pH between 4 and 6. B The UV absorbance at 350 nm, tyrosine intrinsicfluorescence emission at 308 nm, ANS emission intensity at 485 nm and Nile Red maximum fluorescence intensity measured after 0 (filled circles), 1 (empty circles) and 7 days (x marks) are given. The ANS and Nile Redfluorescence emission of sCT in sodium acetate after 0, 1 and 7 days remained low, indicating no binding of the dyes to the protein occurred. A decrease in Nile Redfluorescence after 1 day was observed. The sCT was found to be stable in sodium acetate with pH values between 3.5 and 5.5 during at least 1 week.
After 7 days, no suitable buffer solutions were found for sCT that had pH values of 6.0 or more. The salmon calcitonin turbidity at 350 nm in buffer solutions 13 to 20 (TableIII) was low, except for ADA pH 6.0, HEPES pH 7.0 and sodium carbonate pH 10.5, where slightly increased turbidities were measured. The ANS fluorescence increased in all these solutions, where the Nile Red fluorescence intensities remained low for the following formulations: MOPS–KOH pH 6.5, HEPES pH 7.0 and 7.5, glycine–NaOH pH 9.0. Salmon calcitonin remained stable for 1 day at pH values similar to the physiological pH in the following buffer solutions: MOPS–KOH pH 6.5 and 7.5, HEPES pH 7.5, TES pH 7.0.
DISCUSSION
The proof of concept of a high throughput protein formulation platform is presented in this paper using salmon calcitonin as a model protein. The sCT physical stability was
studied in 100 formulations with the following assays: (1) protein concentration, (2) volume control by measuring pathlength, (3) turbidity (absorbance at 350 nm), (4) intrinsic tyrosine fluorescence, (5) ANS fluorescence, (6) Nile Red fluorescence. The intrinsic tyrosine fluorescence assay led to the discarding of about 15 formulations that were turbid by eye. In the case of salmon calcitonin, intrinsicfluorescence is less sensitive to detect aggregation as extrinsic (1,8-ANS or Nile Red)fluorescence. Assays to control for the dispensed volume, possible evaporation and protein concentration of the samples were performed. In our experiments, no evapo-ration occurred during the 7 days of storage, although a reduction in pathlength was observed for sCT formulations that formed a compact and hard gel.
The described high throughput platform can be enlarged with techniques to facilitate accelerated stability testing or other complementary methods to characterize the physical (e.g. fluorescence anisotropy, fluorescence lifetime and neph-elometry) and chemical (e.g. capillary electrophoresis, liquid
Sodium acetate
UV (350nm) F (Tyr) F (ANS) F (Nile Red)
2 10 11 0.0 0.1 0.2 0.3 0.4 0.5 0.6 0.7 pH 0 5000 10000 15000 20000 25000 30000 35000 40000 pH 0 500 1000 1500 2000 10000 20000 30000 40000 50000 pH 0 500 1000 1500 2000 10000 20000 30000 40000 50000
Day 0 Day 1 Day 7 Legend
F (ANS) 460 470 480 490 500 510 520 200 300 400 500 600 700 Wavelength (nm) 460 470 480 490 500 510 520 200 300 400 500 600 700 Wavelength (nm) 460 470 480 490 500 510 520 Wavelength (nm) 200 300 400 500 600 700 F (Nile Red) 610 620 630 640 650 660 670 0 50 100 150 200 250 300 350 400 450 500 550 600 Wavelength (nm) 610 620 630 640 650 660 670 50 100 150 200 250 300 350 400 450 Wavelength (nm) 610 620 630 640 650 660 670 50 100 150 200 250 300 350 400 450 Wavelength (nm) pH 3.5 pH 4.0 pH 4.5 pH 5.0 pH 5.5 3 4 5 6 7 8 9 2 3 4 5 6 7 8 9 10 11 2 3 4 5 6 7 8 9 10 11 pH 2 3 4 5 6 7 8 9 10 11 Fig. 3. (continued)
chromatography and mass spectrometry) stability (12). The combination of high throughput turbidity measurements with accelerated stability tests, by means of mechanical stress, was shown to be useful in protein formulation (13). However, high throughput turbidity screening of protein solutions often is hindered by the requirement of high protein concentrations and the high variation in absorbance signal (14). This variation can be caused due to the relatively small diameter (Ø~0.75 mm) of the light beam, which corresponds to less than 1% of the surface of a 96 well (Ø~9.0 mm), and the irregular growth of protein aggregates. Measurement at multiple points inside a well will reduce the variation in the turbidity signal. However, a more complicated data analysis and increased measurement time can be expected.
The fibrillation lag time of calcitonin is known to decrease with an increase in concentration (7, 15, 16). Aggregated salmon calcitonin formed different structures as observed by eye, which is reflected in the different fluores-cence and absorbance intensities. The absorbance at 350 nm was not sensitive enough to detect all forms of sCT aggregates, in particular at pH values of 7.0–10.5. If the turbidity assay would have been used as a stand-alone assay, several unstable sCT formulations would have been selected. The use of complementary fluorescence assays narrowed down the selection of stable salmon calcitonin formulations.
The fluorescence of ANS is known to increase after binding to hydrophobic regions of proteins (17). ANS binds primarily through electrostatic interactions of the ANS anion to the cationic groups of the protein (18). The binding of dyes to proteins that expose hydrophobic surfaces does not always lead to increased fluorescence intensity. No fluorescence increase was observed for up to 17 ANS anions that were bound in acidic pH to lysozyme (18). BSA below pH 5.0 has as many as 100 ANS binding sites, where 95% of the protein bound ANS is non fluorescent (18). Similar effects may explain the low ANS or Nile Redfluorescence intensities of sCT in glycine–HCl buffer pH 2.5 to 3.5. Another explanation could be that at acidic pH, ANS is less charged and therefore it interacts with protein aggregates mainly through hydro-phobic interactions rather than electrostatic interactions. Another ANS binding study, together with circular dichroism and intrinsicfluorescence analysis, characterized the different conformational states of β-lactamase between pH 2.0 and 12.0 (19). The ANSfluorescence was stable in the entire pH range, except for a time-dependent increase of ANS fluores-cence at pH 2.0 (19). In our high throughput study, no ANS fluorescence intensity increase caused by pH of buffer solutions was observed. The ANS fluorescence augmented in all sCT formulations with pH 6.0 or higher. This is attributed to the binding of ANS to the hydrophobic regions formed in sCT multimers and aggregates.
Thefluorescence of Nile Red is strongly influenced by the polarity of its environment. Nile Red can interact with many proteins, is photostable and can detect the exposure or formation of hydrophobic surfaces (20, 21). The Nile Red fluorescence was shown in several studies to be unaffected at a variety of pH ranges: 4.5–8.5 (20), 6.0–10.0 (22). We measured a significant increase in Nile Red fluorescence emission in three salmon calcitonin formulations at pH 4.0 (sodium citrate, sodium citrate phosphate and potassium phthalate) and up to pH 10.5 compared to the control
solutions. These Nile Red fluorescence intensities in the salmon calcitonin formulations were significantly higher than the Nile Red in the control buffer solutions. The Nile Red fluorescence intensity in stable sCT formulations decreased after 1 day, which is caused by slight temperature differences, as was the case for the intrinsic tyrosine, or by adsorption to walls of the microplate. Nile Red adsorbed on plastic, glass, or quartz becomes non-fluorescent (20).
Spiking of protein formulations with the dye prior to analysis is preferred over the incorporation of the dye in the protein formulation (21). Dyes might alter the protein conformation, as it has been previously reported that ANS induced folding of acid unfolded cytochrome c to the molten globule state as a result of electrostatic interactions (23). The fluorescence intensity of the added dyes can be influenced by changes in protein conformation or by incubation. Spiking of the formulation with the dye prior to each analysis time point can be performed. This is in particular useful when studying the stability of protein formulations over long time periods (months to a year) or when the formulations are stored at higher temperatures. However, we do not recommend spiking samples with dyes in a high throughput screening study of up to one month if no interference of the dye with the protein stability was detected. Nile Red did not change the stability of salmon calcitonin (21) and the dye was added once at time zero.
After 1 day of measurement, 27 from a total of 100 sCT formulations (TableII) were found to be stable according to the turbidity, ANS and Nile Red fluorescence assays. After 7 days of sample preparation, based on the results of the turbidity, intrinsic tyrosine fluorescence, ANS fluorescence and Nile Redfluorescence assays, only 12 sCT formulations remained stable (Table III). The formulations, with a complete white background in Table III, are: sodium citrate phosphate pH 3.0; potassium citrate phosphate pH 3.5 and 4.0; dimethyl glutaric acid pH 3.5, pH 4.0 and 4.5; sodium acetate pH 3.5, 4.0, 4.5, 5.0 and 5.5; ammonium acetate pH 4.5. The sodium acetate was the best buffer solution for a sCT drug formulation, since the protein remained stable at all measured pH values, even at pH 5.5.
The Forcaltonin®, Miacalcin® and Calcimar® com-mercial sCT solutions for injection contain sodium acetate (Table I), which confirms with the results of our high throughput formulation study. The respective incorporation of hydrochloric acid and citric acid in Miacalcin® nasal spray and Fortical® nasal spray is another indication that sCT is stable in an acidic environment. However, salmon calcitonin is not generally stable at low pH values (e.g. glycine–HCl pH 2.5–3.5). The stabilizing effect of sodium acetate on salmon calcitonin is due both to sodium and acetate, since the use of sodium citrate and ammonium acetate at pH 5.0 and 5.5 resulted in an increased ANSfluorescence.
The selection of stable protein formulations depends on the set criteria per assay. These criteria need to be continu-ously evaluated during data analysis. Data analysis can be a time-consuming task. For example, the ANS and Nile Red emission were measured in their emission maxima over a 60 nm range and the intrinsic tyrosine over 40 nm to reduce measurement time and to facilitate data handling. With these settings and including the different absorbance assays, about 180,000 data points were acquired per day out of a total of 15
microplates. Automated determination of average values, including standard deviations and variations of endpoint measurements (absorbance or emission value at a single wavelength) gave an indication about the reproducibility and can help in finding wells with variations in e.g. the protein concentration and volume. Analysis of absorbance and emission spectra is required before excluding samples (e.g. individual wells) from the study, as is explained further. Different graphical representation of data is possible, as can be seen in Figs. 1, 2, 3 and the electronically available supplementary material. The fluorescence emission spectra can either be analyzed with or without the plotting of spectra. In-house build visual basic macros selected automatically the maximum intensity values with corresponding wavelengths. These values changed depending on the interaction of the dye with the protein. Line graphs or three-dimensional graphs, such as Fig.1, help to quickly understand the behavior of the protein (e.g. fluorescence intensity) in relation to the parameter tested, which was the case of the pH. Plotting of 96 fluorescence emission spectra per analyzed microplate in time showed the protein behavior per buffer and in relation to the position in the plate. Detection of a consequent error in sample pipetting and thus in concentration can be found, since in our HTF platform the protein samples are horizon-tally dispensed in the microplate by eight individual pipettors. Generally, evaporation starts to occur in the outer columns and rows of a well plate, which can be detected by visualizing spectra per plate.
In our high throughput study the average values of four replicates per sCT formulation were used. In several cases, one out of these four replicates could have been designated in the fluorescence assays as an outlier. However, no such statistical approach was applied and all replicates contributed to the reported data. In the ANS fluorescence emission spectra at day 0 of sCT in glycine–HCl pH 3.0, one sample showed a six times stronger fluorescence intensity than the other three replicates. After a day, this strong fluorescence decreased and became similar to the fluorescence of the replicates. Presence of air bubbles, droplets, or other technical issues could be the explanation for this increased value at day 0. Salmon calcitonin in potassium citrate phosphate buffer pH 3.0 is stable to all but the ANS emission assay. This is unexpected since sCT in potassium citrate phosphate pH 3.5 and 4.0 complied with all four assays. One out of the four replicates of sCT in potassium citrate phosphate pH 3.0 had a strong ANSfluorescence at day 0, 1 and 7. No experimental reasons could be found to eliminate this sample, which resulted in salmon calcitonin being not stable in potassium citrate phosphate buffer pH 3.0. In other formulations, one out of four sCT samples showed an increased initial fluorescence or absorbance that continued to increase in time. The remaining replicates showed, only after a prolonged time, similar spectroscopic changes caused by the irregular aggregation formation in some buffers. Automated data analysis can help pinpoint these outliers.
The assay criteria were established based on the intensities of the background values and variation in stable sCT formulations and control solutions. For each assay, the sCT formulations were awarded a score (white or grey background), either stable or not according to each assay, and presented in overview tables (see Tables II and III).
Stable protein formulations can then be selected for further optimization, analysis or immediate use. We suggest investi-gating the origin of the changes if the protein formulation is considered stable with three out of four assays.
With controlled storage conditions (e.g. humidity and temperature), high throughput analysis can be performed over more than a week. There are no limitations to the length of the high throughput screening study. The formulations can be stored also outside the microplate in for example vials or deep-well storage plates. At each stability time point, the formulations can be pipetted (with or without an extrinsic dye) in a 96-well plate for characterization. A decrease in total measurement time (e.g. decrease in protein aggregation lag time) and increase in throughput can be obtained when combining accelerated stress testing, e.g. shaking or storage at elevated temperatures, with high throughput spectroscopy (13). The screening of sCT formulations over a broad pH range resulted in several leads for further formulation optimization, one of which included the commercially used sodium acetate buffer. The HTF platform can be applied for fast developing stable formulations of other peptides and proteins. The HTF platform can be used with extrinsic dyes at low protein concentration (<50 μg/ml) and at high protein concentration (e.g. 100–300 mg/ml). The analytical methods have to be adapted to these extreme concentration con-ditions. Phenomena such as protein binding to walls at low protein concentration or high viscosity at high protein concentration have to be taken into account.
It is our opinion that, if enough protein substance is available, many parameters need to be studied to completely understand the physical and chemical properties of the drug. In this endeavor, high throughput screening platforms will provide a valuable tool to characterize protein formulations. CONCLUSION
After 1 week, 12 out of 100 salmon calcitonin formula-tions were found to be stable. The physical stability study was performed in 96-well plates and the two tested parameters were buffer type and pH value. The sodium acetate buffer at pH values of 3.5 to 5.5 was the best candidate for further sCT formulation optimization. The sCT remained stable according to the turbidity, intrinsic and extrinsicfluorescence assays. It should be noted that several commercial sCT formulations contain a sodium acetate buffer. The leads found using our novel high throughput methods have already been used or patented, which validates our approach and can be consid-ered as a proof of concept for the high throughput protein formulation platform.
The use of several complementary analytical methods permits the selection of formulations using carefully selected assay criteria. We have shown that, in some cases, an increase in turbidity was observed without an increased ANS or Nile Red fluorescence. In other formulations, an increase in fluorescence was detected without an increased turbidity. Therefore, we recommend measuring thefluorescence of at least two dyes in combination with turbidity and intrinsic fluorescence. Growth of protein aggregates at the side of wells can stay undetected if the measurement is only performed in the centre of the well. Therefore, determining turbidity at different positions in the well will result in a
reduction in the variation of the apparent absorbance. The intrinsic tyrosine fluorescence was, in the case of salmon calcitonin, not a decisive factor, and the fluorescence only changed in strongly aggregated formulations.
Taken together, high throughput spectroscopy is a fast and versatile method for initial screening of the physical stability of protein formulations. The well-plate based plat-form could be enhanced with an accelerated stress testing and methods to determine chemical stability, e.g. electrophoresis, HPLC, mass spectrometry.
REFERENCES
1. S. J. Wimalawansa. Amylin, calcitonin gene-related peptide, calcitonin, and adrenomedullin: a peptide superfamily. Crit Rev. Neurobiol. 11:167–239 (1997).
2. M. Munoz-Torres, G. Alonso, and M. P. Raya. Calcitonin therapy in osteoporosis. Treat. Endocrinol. 3:117–132 (2004)
doi:10.2165/00024677-200403020-00006.
3. North American Menopause Society. Management of osteopo-rosis in postmenopausal women: 2006 position statement of The North American Menopause Society. Menopause. 13:340–367 (2006) doi:10.1097/01.gme.0000222475.93345.b3.
4. B. Rafferty, P. Corran, and A. Bristow. Multicenter collaborative study to calibrate salmon calcitonin by bioassay and high-performance liquid chromatography: establishment of the third international standard. Bone. 29:84–89 (2001) doi:
10.1016/S8756-3282(01)00474-4.
5. C. S. Ben Maimon, and R. Garnick. Biogenerics at the cross-roads. Nat. Biotechnol. 24:268–269 (2006).
6. S. A. Charles. SuperGenerics: a better alternative for biogene-rics. Drug Discov. Today. 10:533–535 (2005) doi:
10.1016/S1359-6446(05)03410-0.
7. T. Arvinte, A. Cudd, and A. F. Drake. The structure and mechanism of formation of human calcitonin fibrils. J. Biol. Chem. 268:6415–6422 (1993).
8. M. Berg, K. Undisz, R. Thiericke, P. Zimmermann, T. Moore, and C. Posten. Evaluation of liquid handling conditions in microplates. J. Biomol. Screen. 6:47–56 (2001).
9. B. M. Eckhardt, J. Q. Oeswein, D. A. Yeung, T. D. Milby, and T. A. Bewley. A turbidimetric method to determine visual appear-ance of protein solutions. J. Pharm. Sci. Technol. 48:64–70 (1994).
10. E. L. McGown, and D. G. Hafeman. Multichannel pipettor performance verified by measuring pathlength of reagent dispensed into a microplate. Anal. Biochem. 258:155–157 (1998)
doi:10.1006/abio.1998.2621.
11. N. Ritter and J. McEntire. Determining protein concentration. BioPharm Int.April:12–22 (2002).
12. M. A. H. Capelle, R. Gurny, and T. Arvinte. High throughput screening of protein formulation stability: practical considera-tions. Eur. J. Pharm. Biopharm. 65:131–148 (2007) doi:10.1016/j.
ejpb.2006.09.009.
13. H. C. Mahler, R. Muller, W. Friebeta, A. Delille, and S. Matheus. Induction and analysis of aggregates in a liquid IgG1-antibody formulation. Eur. J. Pharm. Biopharm. 59:407–417 (2005)
doi:10.1016/j.ejpb.2004.12.004.
14. D. M. Barron, S. K. Chatterjee, R. Ravindra, R. Roof, E. Baloglu, D. G. Kingston, and S. Bane. A fluorescence-based high-throughput assay for antimicrotubule drugs. Anal. Biochem. 315:49–56 (2003) doi:10.1016/S0003-2697(02)00691-7.
15. T. Arvinte, and A. F. Drake. Comparative study of human and salmon calcitonin secondary structure in solutions with low dielectric constants. J. Biol. Chem. 268:6408–6414 (1993). 16. A. Cudd, T. Arvinte, R. E. Das, C. Chinni, and I. MacIntyre.
Enhanced potency of human calcitonin when fibrillation is avoided. J. Pharm. Sci. 84:717–719 (1995) doi:10.1002/
jps.2600840610.
17. L. Stryer. The interaction of a naphthalene dye with apomyo-globin and apohemoapomyo-globin. A fluorescent probe of non-polar binding sites. J. Mol. Biol. 13:482–495 (1965).
18. D. Matulis, and R. Lovrien. 1-Anilino-8-naphthalene sulfonate anion–protein binding depends primarily on ion pair formation. Biophys. J. 74:422–429 (1998).
19. Y. Goto, and A. L. Fink. Conformational states of beta-lactamase: molten-globule states at acidic and alkaline pH with high salt. Biochemistry. 28:945–952 (1989) doi:10.1021/
bi00429a004.
20. D. L. Sackett, and J. Wolff. Nile red as a polarity-sensitive fluorescent probe of hydrophobic protein surfaces. Anal. Bio-chem. 167:228–234 (1987) doi:10.1016/0003-2697(87)90157-6. 21. B. Demeule, R. Gurny, and T. Arvinte. Detection and
charac-terization of protein aggregates byfluorescence microscopy. Int. J. Pharm. 329:37–45 (2007) doi:10.1016/j.ijpharm.2006.08.024. 22. G. V. Kaler, and A. I. Ivanov. Monitoring structural and ligand
loading status of serum albumin with an uncharged hydrophobic fluorescent probe, Nile red. Proc. SPIE. 2678:509–518 (1996). 23. V. Ali, K. Prakash, S. Kulkarni, A. Ahmad, K. P. Madhusudan,
and V. Bhakuni. 8-anilino-1-naphthalene sulfonic acid (ANS) induces folding of acid unfolded cytochrome c to molten globule state as a result of electrostatic interactions. Biochemistry. 38:13635–13642 (1999) doi:10.1021/bi9907835.