Publisher’s version / Version de l'éditeur: Technical Report, 2013-02-06
READ THESE TERMS AND CONDITIONS CAREFULLY BEFORE USING THIS WEBSITE.
https://nrc-publications.canada.ca/eng/copyright
Vous avez des questions? Nous pouvons vous aider. Pour communiquer directement avec un auteur, consultez la
première page de la revue dans laquelle son article a été publié afin de trouver ses coordonnées. Si vous n’arrivez pas à les repérer, communiquez avec nous à PublicationsArchive-ArchivesPublications@nrc-cnrc.gc.ca.
Questions? Contact the NRC Publications Archive team at
PublicationsArchive-ArchivesPublications@nrc-cnrc.gc.ca. If you wish to email the authors directly, please see the first page of the publication for their contact information.
NRC Publications Archive
Archives des publications du CNRC
For the publisher’s version, please access the DOI link below./ Pour consulter la version de l’éditeur, utilisez le lien DOI ci-dessous.
https://doi.org/10.4224/21270173
Access and use of this website and the material on it are subject to the Terms and Conditions set forth at
Second order waves before and after the floor work in the OEB in 2010 : Part A
Zaman, Hasanat; McKay, Shane; NRC Ocean, Coastal and River Engineering
https://publications-cnrc.canada.ca/fra/droits
L’accès à ce site Web et l’utilisation de son contenu sont assujettis aux conditions présentées dans le site LISEZ CES CONDITIONS ATTENTIVEMENT AVANT D’UTILISER CE SITE WEB.
NRC Publications Record / Notice d'Archives des publications de CNRC: https://nrc-publications.canada.ca/eng/view/object/?id=4417c922-a8f5-42e4-b802-5daeff99c460 https://publications-cnrc.canada.ca/fra/voir/objet/?id=4417c922-a8f5-42e4-b802-5daeff99c460
OCRE-TR-2013-003
NATIONAL RESEARCH COUNCIL CANADA OCEAN, COASTAL AND RIVER ENGINEERING
Second order waves before and after
the floor work in the OEB in 2010:
Part A
Technical Report - UNCLASSIFIED
Hasanat Zaman Shane McKay February, 2013
REPORT NUMBER PROJECT NUMBER
DATE
SECURITY CLASSIFICATION DISTRIBUTION
TITLE
AUTHOR(S)
CORPORATE AUTHOR(S)/PERFORMING AGENCY(S) PUBLICATION (Journal or Conference name)
SPONSORING AGENCY(S)
RAW DATA STORAGE LOCATION(S)
PEER REVIEWED
MODEL # PROP
EMBARGO PERIOD
PROJECT (NPArC) GROUP (NPArC)
PROGRAM (NPArC) FACILITY (NPArC)
KEY WORDS PAGES TABLES FIGS.
SUMMARY
Report Documentation Page
OCRE - GOCF
2013
6 February
Wave quality, 2nd order waves, unwanted free waves i, 302, App 1-6 7 1
OCRE-TR-2013-003 PJ2414-26 UNCLASSIFIED UNLIMITED
Second order waves before and after the floor work in the OEB in 2010: Part A
Hasanat Zaman and Shane McKay
NRC Ocean, Coastal and River Engineering
NRC-ST. JOHN’S
--- --- Research
--- St. John's: P.O. Box 12093, Arctic Ave, St. John's, NL A1B 3T5
This is a continuation of the work reported in TR-2011-16. In summer 2010, the south-west side trenches (0.4m x 0.3m) under and in front of the wave makers in the OEB have been permanently filled-up to provide a homogeneous bottom and uniform water depth all over the basin. This work is to understand the improvement of the wave quality after the floor work. Two sets of experimental data comprised of mono- and bi-chromatic waves before and after the floor work are used to identify the impact of the development work on the generation of unwanted second order free waves in the OEB. In this report results are compared between the measured energies at different probe locations and also second order wave components before and after the floor work in the OEB. Comparisons are shown in terms of measured wave energies, primary waves, bounded waves and unwanted second order free waves elevations. In this report 0.4m, 0.5m and 0.6m of water depth is considered. In most of the cases it is observed from the results that the shallower the wave the better the wave quality after the floor work.
National Research Council Conseil national de recherches Canada Canada Ocean, Coastal and River Génie océanique, côtier et fluvial Engineering
Second order waves before and after the floor work
in the OEB in 2010: Part A
Technical Report UNCLASSIFIED OCRE-TR-2013-003 Hasanat Zaman Shane McKay February, 2013
OCRE-TR-2013-003 i
TABLE OF CONTENTS
Page NoABSTRACT ...1
1. INTRODUCTION ...1
2. DESCRIPTION OF THE TRENCHES AND FILLED-UP WORK ...1
3. EXPERIMENTAL SETUP ...1
4. EXPERIMENTS AND DATA ACQUISITIONS ...2
5. INCIDENT WAVE CONDITIONS ...3
6. DATA ANALYSES...4
6.1 COMPARISONS - 1: Monochromatic waves ...4
6.2 COMPARISONS - 2: Bichromatic waves ... 5
7. LWAVE utilization ...6
8. RESULTS ...6
9. CONCLUSIONS...7
REFERENCES ...7
Appendix-I compares energy distribution and second order wave components for mono-chromatic wave over 0.4m water depth at different probe locations. ...8
Appendix-II compares energy distribution and second order wave components for mono-chromatic wave over 0.5m water depth at different probe locations. ...89
Appendix-III compares energy distribution and second order wave components for mono-chromatic wave over 0.6m water depth at different probe locations. ...154
Appendix-IV compares energy distribution and second order wave components for bi-chromatic wave over 0.4m water depth at different probe locations. ...171
Appendix-V compares energy distribution and second order wave components for bi-chromatic wave over 0.5m water depth at different probe locations. ...220
Appendix-VI compares energy distribution and second order wave components for bi-chromatic wave over 0.6m water depth at different probe locations. ...269
OCRE-TR-2013-003 1
ABSTRACT
This is a continuation of the work reported in TR-2011-16. In summer 2010 the south-west side trenches under and in front of the wave makers in the OEB have been permanently filled-up to provide a homogeneous bottom and uniform water depth all over the basin. This work is to understand the improvement of the wave quality after the floor work. Two sets of experimental data comprised of mono- and bi-chromatic waves before and after the floor work are used to identify the impact of the development work on the generation of unwanted second order free waves in the OEB. In this report results are compared between the measured energies at different probe locations and also second order wave components before and after the floor work in the OEB. Comparisons are shown in terms of measured wave energies, primary waves, bounded waves and unwanted second order free waves elevations. In this report 0.4m, 0.5m and 0.6m of water depth is considered. In most of the cases it is observed from the results that the shallower the wave the better the wave quality after the floor work.
1. INTRODUCTION
The OEB at NRC-IOT is a world class 3D experimental wave basin. Recently the small trenches under and in front of the south and west side wave makers were filled-up to produce a uniform floor bottom. It is important to study the impact of this work on the wave quality in the basin.
In this work two sets of experimental data resulted from identical incident wave parameters are used. The first set (called before from now on) of wave data was obtained from the experimental work before the trenches were filled-up and the second set (called
after from now on) of data was obtained from the experiment after the trenches were filled up. In the experiments both mono- and bi-chromatic wave are considered for different water depths. Four different water depths were used, 0.4m, 0.5m, 0.6m and 0.8m. Comparisons of the data were done for identical wave conditions. Results for 0.8m water depth are reported in another report (Part-B).
2. DESCRIPTION OF THE TRENCHES AND FILLED-UP WORK
The south trench was about 64m long, 0.4m wide and 0.3m deep. The west trench was about 26m long, 0.4m wide and 0.3m deep. These trenches are permanently filled-up.
3. EXPERIMENTAL SETUP
The experiments were carried out in October 2009 (before), July 2010 (after) and August 2011 (after) at the Offshore Engineering Basin of National Research Council Canada, St. John’s. The top view of the basin is shown in Fig. 1. The Offshore Engineering Basin is 75 m long x 32 m wide. 56 independently controlled segmented wave generators installed on the west wall generated the waves. Each segmented wave generator is 2 m high and 0.5 m wide. Passive absorbers, made of expanded metal sheets with varying porosities and spacing, are installed on the east wall. A solid metal wall is used to cover the north side of the basin to customize it into flume mode.
2 OCRE-TR-2013-003
During the experiment, 14 wave probes are installed as shown in Fig. 1. But for 0.8m water depth only 10 wave probes are used. The dotted lines in Fig. 1 show the location of the trenches in the OEB that the basin previously had. Table-1 measured the location of the wave probes throughout the basin. All the wave probes are capacitance type. All the data was acquired using GDAC (GEDAP Data Acquisition and Control) client-server acquisition system, developed by National Research Council Canada, Institute for Ocean Technology.
Photo 1 Setup of the wave probes in the OEB
4. EXPERIMENTS AND DATA ACQUISITIONS
Experiments were carried out in three times slots: in October 2009 (PJ2298) with the presence of the trenches, in July 2010 (PJ2414) and in August 2011 (PJ2298) without trenches. P-7 P-1 P-2 P-3 P-6 P-4 P-5 P-14 P-11 P-9 P-10 P-8 P-12 P-13 13.475 Wave-makers 2m 10.744 South wall Beach West wall Trenches
OCRE-TR-2013-003 3
In July 2010 experiments are carried out for both mono- and bi-chromatic waves on water depths 0.4m, 0.5m and 0.6m and in August 2011 experiments with 0.8m water depth are carried out. In the experiment of October 2009 all above water depths are used.
Table 1 Location of the wave probes in the OEB No of the
probe
Distance from the west wall (m)
Distance from the south wall (m) 1 26.891 13.475 2 27.221 13.475 3 27.731 13.475 4 27.731 12.955 5 27.731 12.635 6 27.731 14.825 7 27.731 18.365 8 29.081 13.475 9 32.621 13.475 10 41.621 13.475 11 2.0 12.635 12 2.0 13.475 13 2.0 18.365 14 10.744 13.475
5. INCIDENT WAVE CONDITIONS
In the experiments both mono- and bi-chromatic waves of different wave periods, wave heights and water depths are used. See Zaman and Mak (2007) and Zaman et al (2010) for several cases of mono- and bi-chromatic waves before the floor work and Zaman et al. (2011) after the floor work. Table 2 to 4 show different incident wave conditions that we used in the experiments. In the tables below T1 and T2 are wave periods, H1 and H2 are the wave heights, h is the water depth, L is the wave length and
h/L is the relative water depth.
Table 2a Mono-chromatic incident wave parameters (h=0.4m) T1 (s) H1 (m) h(m) h/L M4-1 2.145 0.08 0.4 0.100 M4-2 3.116 0.06 0.4 0.067 M4-3 4.105 0.06 0.4 0.050 M4-4 3.116 0.12 0.4 0.067 M4-5 4.105 0.16 0.4 0.050
4 OCRE-TR-2013-003
Table 2b Bi-chromatic incident wave parameters (h=0.4m) T1 (s) h(m) H1 (m) T2 (s) H2 (m) h/L
B4-1 1.25 0.4 0.06 1.17 0.06 0.195 B4-2 1.55 0.4 0.06 1.45 0.06 0.146 B4-3 2.22 0.4 0.06 2.00 0.06 0.096
Table 3a Mono-chromatic incident wave parameters (h=0.5m) T1 (s) H1 (m) h(m) h/L
M5-1 1.977 0.04 0.5 0.125 M5-2 1.977 0.08 0.5 0.125 M5-3 2.829 0.06 0.5 0.083 M5-4 3.704 0.08 0.5 0.056 Table 3b Bi-chromatic incident wave parameters (h=0.5m) T1 (s) h(m) H1 (m) T2 (s) H2 (m) h/L
B5-1 1.25 0.4 0.06 1.17 0.06 0.195 B5-2 1.55 0.4 0.06 1.45 0.06 0.146 B5-3 2.22 0.4 0.06 2.00 0.06 0.096
Table 4a Mono-chromatic incident wave parameters (h=0.6m) T1 (s) H1 (m) h(m) h/L
M6-1 0.9 0.06 0.6 0.476
M6-2 1.0 0.06 0.6 0.390
Table 4b Bi-chromatic incident wave parameters (h=0.6m) T1 (s) h(m) H1 (m) T2 (s) H2 (m) h/L
B6-1 1.55 0.4 0.06 1.45 0.06 0.146 B6-2 2.22 0.4 0.06 2.00 0.06 0.096
The bottom of the basin was flat and the blanking plates were deployed to cover the north beach.
6. DATA ANALYSES
We have analyzed two sets of data, one for before the floor work and the other one is
after the floor work. Different wave conditions and water depths are considered as shown in Tables 2 to 4. All the data are compared and the results are shown in terms of measured surface elevation data, wave energies and isolated wave components including second order waves across the wave tank at probes 5-4-3-6-7 (Probe-5, Probe-4, Probe-3, Probe-6 and Probe-7) and at probes 11-12-13-14 (Probe-11, Probe-12, Probe-13 and Probe-14) and along the tank at probes 1-2-3-8-9-10 (Probe-1, Probe-2, Probe-3, Probe-8, Probe-9 and Probe-10), see Fig. 1.
OCRE-TR-2013-003 5
Table 2a, 3a and 4a respectively, show the incident wave conditions for monochromatic waves, respectively on 0.4m (M4), 0.5m (M5) and 0.6m (M6) water depths. All the above cases are run with and without trenches condition in front of the south and west wave makers of the OEB. Comparisons of the results are made between both cases, with and without trenches.
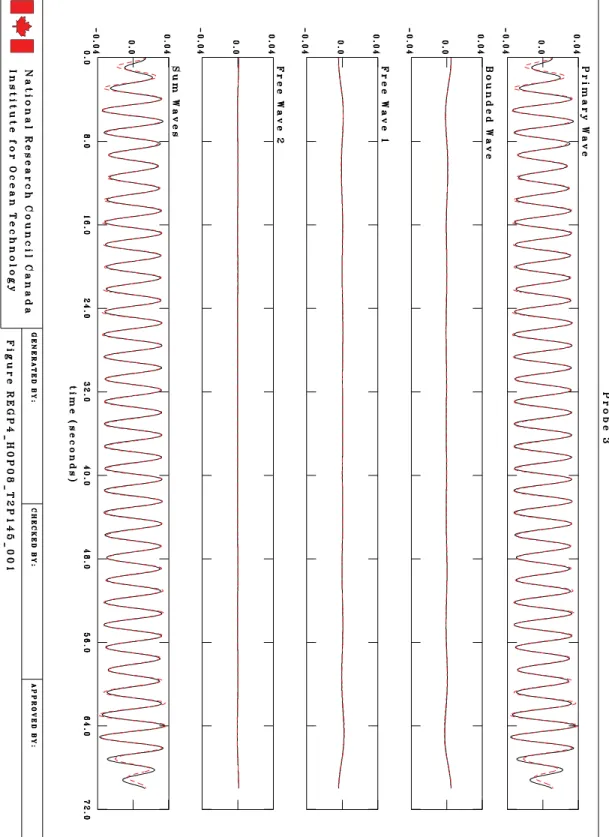
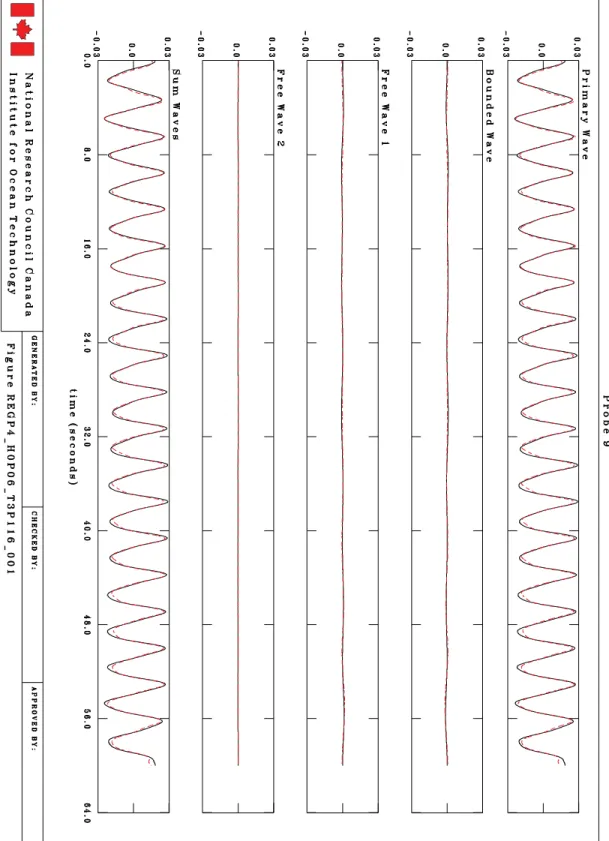
Figs. 2a to 11j show the energy distribution, measured surface elevation, isolated primary wave, bounded and second order unwanted free wave components at different probe locations in the basin for the mono-chromatic waves of 0.4m water depth mentioned in Table 2a. Measured water surface elevations, wave energies and isolated primary, bounded and unwanted free waves at across-tank probes 5-4-3-6-7 and 11-12-13-14 and at the along-tank probes 1-2-3-8-9-10 are plotted together to show the differences in the amplitudes after and before the floor work. Unwanted free waves are reproduced due to the mismatch of the boundary conditions at the wave paddle and due to the displacement of the wave paddle from its zero position.
Figs. 12a to 19j show the energy distribution, measured surface elevation, isolated primary wave, bounded and second order unwanted free wave components at different probe locations in the basin for the mono-chromatic waves of 0.5m water depth mentioned in Table 3a. Acquired water surface elevations, wave energies and isolated primary, bounded and unwanted free waves at across-tank probes 5-4-3-6-7 and 11-12-13-14 and at the along-tank probes 1-2-3-8-9-10 are plotted together to show the differences in the component amplitudes after and before the floor work.
Figs. 20a to 21j show the energy distribution, measured surface elevation, isolated primary wave, bounded and second order unwanted free wave components at different probe locations in the basin for the mono-chromatic waves of 0.6m water depth mentioned in Table 4a. Obtained water surface elevations, wave energies and isolated primary, bounded and unwanted free waves at across-tank probes 5-4-3-6-7 and 11-12-13-14 and at the along-tank probes 1-2-3-8-9-10 are plotted together to show the differences in the component amplitudes after and before the floor work.
It is observed from the results that the smaller the relative water depth h L (i.e. shallower the wave) the better the wave quality after the floor work. For shallower wave it is also noted that the shallower the wave the better the wave energy distributions across the tank for measured, primary, bounded and free waves for after cases. It is perceived that the second order wave components are reduced for shallow waves after the floor work.
6.2 COMPARISONS - 2: Bichromatic waves
Table 2b, 3b and 4b respectively, show the incident wave conditions for Bi-chromatic waves on 0.4m (B4), 0.5m (B5) and 0.6m (B6) water depths. Here also the above cases are run for: with and without trenches conditions in front of the south and west wave makers of the OEB. Results are again compared between both cases, with and without
6 OCRE-TR-2013-003
energies and isolated wave components including second order waves across the wave tank at probes 5-4-3-6-7 (Probe-5, Probe-4, Probe-3, Probe-6 and Probe-7) and at probes 11-12-13-14 (Probe-11, Probe-12, Probe-13 and Probe-14) and along the tank at probes 1-2-3-8-9-10 (Probe-1, Probe-2, Probe-3, Probe-8, Probe-9 and Probe-10), see Fig. 1. Figs. 22a to 27j show the energy distribution, measured surface elevation, isolated primary wave, bounded and second order unwanted free wave components at different probe locations in the basin for the bi-chromatic waves of 0.4m water depth. The incident wave parameters are mentioned in Table 2b. Obtained water surface elevations, wave energies and isolated primary, bounded and unwanted free waves at across-tank probes 5-4-3-6-7 and 11-12-13-14 and at the along-tank probes 1-2-3-8-9-10 are plotted together to show the differences in the component amplitudes after and before the floor work.
Figs. 28a to 32j show surface elevations for the bi-chromatic waves for 0.5m water depth. The incident wave parameters are mentioned in Table 3b. Acquired water surface elevations, wave energies and isolated primary, bounded and unwanted free waves at across-tank probes 5-4-3-6-7 and 11-12-13-14 and at the along-tank probes 1-2-3-8-9-10 are plotted together to show the differences in the component amplitudes after and before the floor work.
Figs. 33a to 36j show surface elevations for the bi-chromatic waves for 0.6m water depth. The incident wave parameters are mentioned in Table 4b. Measured water surface elevations, wave energies and isolated primary, bounded and unwanted free waves at across-tank probes 5-4-3-6-7 and 11-12-13-14 and at the along-tank probes 1-2-3-8-9-10 are plotted together to show the differences in the component amplitudes after and before the floor work.
7. LWAVE utilization
A NRC-IOT computer code LWAVE that can split a measured surface elevation data set into its component waves is used for the analysis. This code is utilized to isolate the primary waves, bounded second order waves and unwanted free waves from the raw measured data at every probe location.
8. RESULTS
In this report 3 different water depths (h= 0.4m, 0.5m and 0.6m) were used. The incident wave parameters are shown in Table 2 to Table 4 for mono- and bi-chromatic waves. Results are compared between the measured wave data, before and after the floor work in the OEB.
Appendix-I compares energy distribution and second order wave components for mono-chromatic wave over 0.4m water depth at different probe locations.
Appendix-II compares energy distribution and second order wave components for mono-chromatic wave over 0.5m water depth at different probe locations.
OCRE-TR-2013-003 7
Appendix-III compares energy distribution and second order wave components for mono-chromatic wave over 0.6m water depth at different probe locations.
Appendix-IV compares energy distribution and second order wave components for bi-chromatic wave over 0.4m water depth at different probe locations.
Appendix-V compares energy distribution and second order wave components for bi-chromatic wave over 0.5m water depth at different probe locations.
Appendix-VI compares energy distribution and second order wave components for bi-chromatic wave over 0.6m water depth at different probe locations.
9. CONCLUSIONS
Comparisons of the results for surface elevations and energy propagations between the measured data before and after the floor work are shown. Deep water wave (h Lt0.5) will not be affected by the floor and the wave starts to be influenced by the bottom when the relative water depth (h L) is less than 0.5. So the smaller the value of h Lmeans greater the effects of the bottom on the propagating waves. It is observed from the results that the shallower the wave the better the wave quality after the floor work. It is also perceived that the shallower the wave the better the wave energies distributions across the tank for primary, bounded and unwanted free waves for after cases. It is also found that the second order wave components are reduced for shallower waves after the floor work conditions. In the presence of the trenches the water depth used to be 0.3m more over this area compare to the other part of the basin. So the waves over this area were faster. Some transverse waves used to propagate across the tank due to the interaction of these faster waves with the south wall wave-makers. This transverse waves reduced after the trenches are filled.
10. REFERENCES
Zaman, M. H., Baddour, E. and McKay, S. (2011): Wave propagation before and after the floor work in the OEB in 2010, TR-2011-16, March, National Research Council Canada, Institute for Ocean Technology.
Zaman, M. H., Peng, H., Baddour, E., Spencer, D. and McKay, S. (2010): Identifications of spurious waves in the wave tank with shallow water, 29th Int. Conf. on offshore Mech. and Arctic Eng. (OMAE-2010), ASME, Shanghai, China, on CD-ROM.
Zaman, M. H. and L. Mak (2007): Second order wave generation technique in the laboratory, 26th Int. Conf. on offshore Mech. and Arctic Eng. (OMAE-2007), ASME, San Diego, USA, on CD-ROM.
8 OCRE-TR-2013-003
Appendix – I
Compares energy distribution and second order wave components for mono-chromatic wave over 0.4m water depth at different probe locations.
Probes array: Probes: 1-2-3-8-9-10
Probes: 5-4-3-6-7 Probes 11-12-13-14
OCRE-TR-2013-003 9
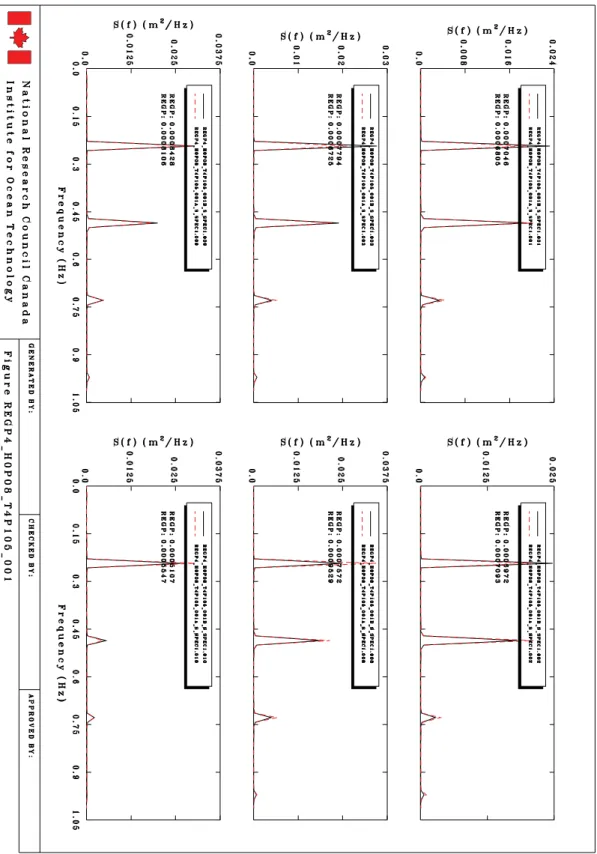
Fig. 2a: Comparisons between primary and low frequency wave energy Probes: 1-2-3-8-9-10
10 OCRE-TR-2013-003
Fig. 2b: Comparisons between high frequency wave energy Probes: 1-2-3-8-9-10
OCRE-TR-2013-003 11
Fig. 2c: Comparisons between primary and low frequency wave energy Probes: 5-4-3-6-7
12 OCRE-TR-2013-003
Fig. 2d: Comparisons between high frequency wave energy Probes: 5-4-3-6-7
OCRE-TR-2013-003 13
Fig. 2e: Comparisons between primary and low frequency wave energy Probes: 11-12-13-14
14 OCRE-TR-2013-003
Fig. 2f: Comparisons between high frequency wave energy Probes: 11-12-13-14
OCRE-TR-2013-003 15
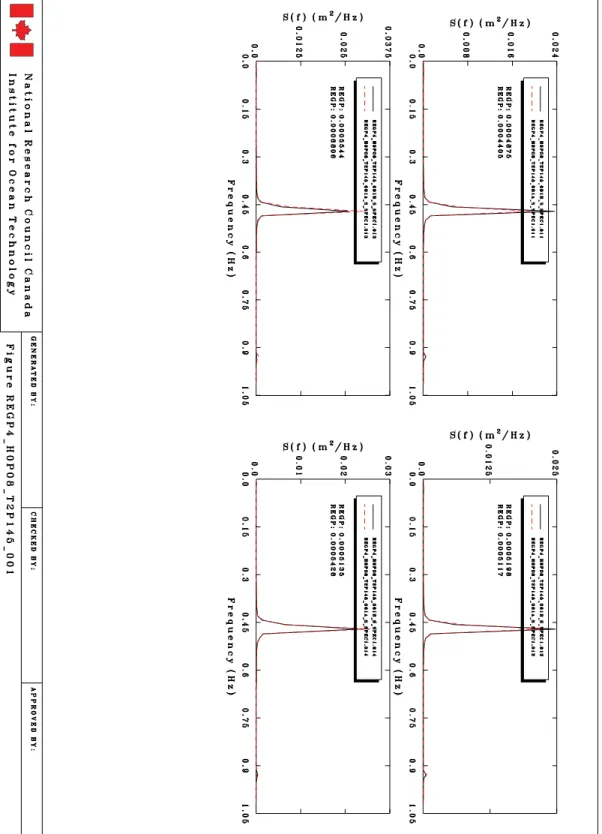
Fig. 3a: Isolated wave components from measured wave data at Probe-1 M4-1 : REGP4_H0P08_T2P145
16 OCRE-TR-2013-003
Fig. 3b: Isolated wave components from measured wave data at Probe-2 M4-1 : REGP4_H0P08_T2P145
OCRE-TR-2013-003 17
Fig. 3c: Isolated wave components from measured wave data at Probe-3 M4-1 : REGP4_H0P08_T2P145
18 OCRE-TR-2013-003
Fig. 3d: Isolated wave components from measured wave data at Probe-4 M4-1 : REGP4_H0P08_T2P145
OCRE-TR-2013-003 19
Fig. 3e: Isolated wave components from measured wave data at Probe-5 M4-1 : REGP4_H0P08_T2P145
20 OCRE-TR-2013-003
Fig. 3f: Isolated wave components from measured wave data at Probe-6 M4-1 : REGP4_H0P08_T2P145
OCRE-TR-2013-003 21
Fig. 3g: Isolated wave components from measured wave data at Probe-7 M4-1 : REGP4_H0P08_T2P145
22 OCRE-TR-2013-003
Fig. 3h: Isolated wave components from measured wave data at Probe-8 M4-1 : REGP4_H0P08_T2P145
OCRE-TR-2013-003 23
Fig. 3i: Isolated wave components from measured wave data at Probe-9 M4-1 : REGP4_H0P08_T2P145
24 OCRE-TR-2013-003
Fig. 3j: Isolated wave components from measured wave data at Probe-10 M4-1 : REGP4_H0P08_T2P145
OCRE-TR-2013-003 25
Fig. 4a: Comparisons between primary and low frequency wave energy Probes: 1-2-3-8-9-10
26 OCRE-TR-2013-003
Fig. 4b: Comparisons between high frequency wave energy Probes: 1-2-3-8-9-10
OCRE-TR-2013-003 27
Fig. 4c: Comparisons between primary and low frequency wave energy Probes: 5-4-3-6-7
28 OCRE-TR-2013-003
Fig. 4d: Comparisons between high frequency wave energy Probes: 5-4-3-6-7
OCRE-TR-2013-003 29
Fig. 4e: Comparisons between primary and low frequency wave energy Probes: 11-12-13-14
30 OCRE-TR-2013-003
Fig. 4f: Comparisons between high frequency wave energy Probes: 11-12-13-14
OCRE-TR-2013-003 31
Fig. 5a: Isolated wave components from measured wave data at Probe-1 M4-2 : REGP4_H0P06_T3P116
32 OCRE-TR-2013-003
Fig. 5b: Isolated wave components from measured wave data at Probe-2 M4-2 : REGP4_H0P06_T3P116
OCRE-TR-2013-003 33
Fig. 5c: Isolated wave components from measured wave data at Probe-3 M4-2 : REGP4_H0P06_T3P116
34 OCRE-TR-2013-003
Fig. 5d: Isolated wave components from measured wave data at Probe-4 M4-2 : REGP4_H0P06_T3P116
OCRE-TR-2013-003 35
Fig. 5e: Isolated wave components from measured wave data at Probe-5 M4-2 : REGP4_H0P06_T3P116
36 OCRE-TR-2013-003
Fig. 5f: Isolated wave components from measured wave data at Probe-6 M4-2 : REGP4_H0P06_T3P116
OCRE-TR-2013-003 37
Fig. 5g: Isolated wave components from measured wave data at Probe-7 M4-2 : REGP4_H0P06_T3P116
38 OCRE-TR-2013-003
Fig. 5h: Isolated wave components from measured wave data at Probe-8 M4-2 : REGP4_H0P06_T3P116
OCRE-TR-2013-003 39
Fig. 5i: Isolated wave components from measured wave data at Probe-9 M4-2 : REGP4_H0P06_T3P116
40 OCRE-TR-2013-003
Fig. 5j: Isolated wave components from measured wave data at Probe-10 M4-2 : REGP4_H0P06_T3P116
OCRE-TR-2013-003 41
Fig. 6a: Comparisons between primary and low frequency wave energy Probes: 1-2-3-8-9-10
42 OCRE-TR-2013-003
Fig. 6b: Comparisons between high frequency wave energy Probes: 1-2-3-8-9-10
OCRE-TR-2013-003 43
Fig. 6c: Comparisons between primary and low frequency wave energy Probes: 5-4-3-6-7
44 OCRE-TR-2013-003
Fig. 6d: Comparisons between high frequency wave energy Probes: 5-4-3-6-7
OCRE-TR-2013-003 45
Fig. 6e: Comparisons between primary and low frequency wave energy Probes: 11-12-13-14
46 OCRE-TR-2013-003
Fig. 6f: Comparisons between high frequency wave energy Probes: 11-12-13-14
OCRE-TR-2013-003 47
Fig. 7a: Isolated wave components from measured wave data at Probe-1 M4-3 : REGP4_H0P12_T3P116
48 OCRE-TR-2013-003
Fig. 7b: Isolated wave components from measured wave data at Probe-2 M4-3 : REGP4_H0P12_T3P116
OCRE-TR-2013-003 49
Fig. 7c: Isolated wave components from measured wave data at Probe-3 M4-3 : REGP4_H0P12_T3P116
50 OCRE-TR-2013-003
Fig. 7d: Isolated wave components from measured wave data at Probe-4 M4-3 : REGP4_H0P12_T3P116
OCRE-TR-2013-003 51
Fig. 7e: Isolated wave components from measured wave data at Probe-5 M4-3 : REGP4_H0P12_T3P116
52 OCRE-TR-2013-003
Fig. 7f: Isolated wave components from measured wave data at Probe-6 M4-3 : REGP4_H0P12_T3P116
OCRE-TR-2013-003 53
Fig. 7g: Isolated wave components from measured wave data at Probe-7 M4-3 : REGP4_H0P12_T3P116
54 OCRE-TR-2013-003
Fig. 7h: Isolated wave components from measured wave data at Probe-8 M4-3 : REGP4_H0P12_T3P116
OCRE-TR-2013-003 55
Fig. 7i: Isolated wave components from measured wave data at Probe-9 M4-3 : REGP4_H0P12_T3P116
56 OCRE-TR-2013-003
Fig. 7j: Isolated wave components from measured wave data at Probe-10 M4-3 : REGP4_H0P12_T3P116
OCRE-TR-2013-003 57
Fig. 8a: Comparisons between primary and low frequency wave energy Probes: 1-2-3-8-9-10
58 OCRE-TR-2013-003
Fig. 8b: Comparisons between high frequency wave energy Probes: 1-2-3-8-9-10
OCRE-TR-2013-003 59
Fig. 8c: Comparisons between primary and low frequency wave energy Probes: 5-4-3-6-7
60 OCRE-TR-2013-003
Fig. 8d: Comparisons between high frequency wave energy Probes: 5-4-3-6-7
OCRE-TR-2013-003 61
Fig. 8e: Comparisons between primary and low frequency wave energy Probes: 11-12-13-14
62 OCRE-TR-2013-003
Fig. 8f: Comparisons between high frequency wave energy Probes: 11-12-13-14
OCRE-TR-2013-003 63
Fig. 9a: Isolated wave components from measured wave data at Probe-1 M4-4 : REGP4_H0P08_T4P105
64 OCRE-TR-2013-003
Fig. 9b: Isolated wave components from measured wave data at Probe-2 M4-4 : REGP4_H0P08_T4P105
OCRE-TR-2013-003 65
Fig. 9c: Isolated wave components from measured wave data at Probe-3 M4-4 : REGP4_H0P08_T4P105
66 OCRE-TR-2013-003
Fig. 9d: Isolated wave components from measured wave data at Probe-4 M4-4 : REGP4_H0P08_T4P105
OCRE-TR-2013-003 67
Fig. 9e: Isolated wave components from measured wave data at Probe-5 M4-4 : REGP4_H0P08_T4P105
68 OCRE-TR-2013-003
Fig. 9f: Isolated wave components from measured wave data at Probe-6 M4-4 : REGP4_H0P08_T4P105
OCRE-TR-2013-003 69
Fig. 9g: Isolated wave components from measured wave data at Probe-7 M4-4 : REGP4_H0P08_T4P105
70 OCRE-TR-2013-003
Fig. 9h: Isolated wave components from measured wave data at Probe-8 M4-4 : REGP4_H0P08_T4P105
OCRE-TR-2013-003 71
Fig. 9i: Isolated wave components from measured wave data at Probe-9 M4-4 : REGP4_H0P08_T4P105
72 OCRE-TR-2013-003
Fig. 9j: Isolated wave components from measured wave data at Probe-10 M4-4 : REGP4_H0P08_T4P105
OCRE-TR-2013-003 73
Fig. 10a: Comparisons between primary and low frequency wave energy Probes: 1-2-3-8-9-10
74 OCRE-TR-2013-003
Fig. 10b: Comparisons between high frequency wave energy Probes: 1-2-3-8-9-10
OCRE-TR-2013-003 75
Fig. 10c: Comparisons between primary and low frequency wave energy Probes: 5-4-3-6-7
76 OCRE-TR-2013-003
Fig. 10d: Comparisons between high frequency wave energy Probes: 5-4-3-6-7
OCRE-TR-2013-003 77
Fig. 10e: Comparisons between primary and low frequency wave energy Probes: 11-12-13-14
78 OCRE-TR-2013-003
Fig. 10f: Comparisons between high frequency wave energy Probes: 11-12-13-14
OCRE-TR-2013-003 79
Fig. 11a: Isolated wave components from measured wave data at Probe-1 M4-5 : REGP4_H0P16_T4P105
80 OCRE-TR-2013-003
Fig. 11b: Isolated wave components from measured wave data at Probe-2 M4-5 : REGP4_H0P16_T4P105
OCRE-TR-2013-003 81
Fig. 11c: Isolated wave components from measured wave data at Probe-3 M4-5 : REGP4_H0P16_T4P105
82 OCRE-TR-2013-003
Fig. 11d: Isolated wave components from measured wave data at Probe-4 M4-5 : REGP4_H0P16_T4P105
OCRE-TR-2013-003 83
Fig. 11e: Isolated wave components from measured wave data at Probe-5 M4-5 : REGP4_H0P16_T4P105
84 OCRE-TR-2013-003
Fig. 11f: Isolated wave components from measured wave data at Probe-6 M4-2 : REGP4_H0P06_T3P116
OCRE-TR-2013-003 85
Fig. 11g: Isolated wave components from measured wave data at Probe-7 M4-5 : REGP4_H0P16_T4P105
86 OCRE-TR-2013-003
Fig. 11h: Isolated wave components from measured wave data at Probe-8 M4-5 : REGP4_H0P16_T4P105
OCRE-TR-2013-003 87
Fig. 11i: Isolated wave components from measured wave data at Probe-9 M4-5 : REGP4_H0P16_T4P105
88 OCRE-TR-2013-003
Fig. 11j: Isolated wave components from measured wave data at Probe-10 M4-5 : REGP4_H0P16_T4P105
OCRE-TR-2013-003 89
Appendix – II
Compares energy distribution and second order wave components for mono-chromatic wave over 0.5m water depth at different probe locations.
Probes array: Probes: 1-2-3-8-9-10
Probes: 5-4-3-6-7 Probes 11-12-13-14
90 OCRE-TR-2013-003
Fig. 12a: Comparisons between primary and low frequency wave energy Probes: 1-2-3-8-9-10
OCRE-TR-2013-003 91
Fig. 12b: Comparisons between high frequency wave energy Probes: 1-2-3-8-9-10
92 OCRE-TR-2013-003
Fig. 12c: Comparisons between primary and low frequency wave energy Probes: 5-4-3-6-7
OCRE-TR-2013-003 93
Fig. 12d: Comparisons between high frequency wave energy Probes: 5-4-3-6-7
94 OCRE-TR-2013-003
Fig. 12e: Comparisons between primary and low frequency wave energy Probes: 11-12-13-14
OCRE-TR-2013-003 95
Fig. 12f: Comparisons between high frequency wave energy Probes: 11-12-13-14
96 OCRE-TR-2013-003
Fig. 13a: Isolated wave components from measured wave data at Probe-1 M5-1 : REGP5_H0P04_T1P977
OCRE-TR-2013-003 97
Fig. 13b: Isolated wave components from measured wave data at Probe-2 M5-1 : REGP5_H0P04_T1P977
98 OCRE-TR-2013-003
Fig. 13c: Isolated wave components from measured wave data at Probe-3 M5-1 : REGP5_H0P04_T1P977
OCRE-TR-2013-003 99
Fig. 3d: Isolated wave components from measured wave data at Probe-4 M5-1 : REGP5_H0P04_T1P977
100 OCRE-TR-2013-003
Fig. 13e: Isolated wave components from measured wave data at Probe-5 M5-1 : REGP5_H0P04_T1P977
OCRE-TR-2013-003 101
Fig. 13f: Isolated wave components from measured wave data at Probe-6 M5-1 : REGP5_H0P04_T1P977
102 OCRE-TR-2013-003
Fig. 13g: Isolated wave components from measured wave data at Probe-7 M5-1 : REGP5_H0P04_T1P977
OCRE-TR-2013-003 103
Fig. 13h: Isolated wave components from measured wave data at Probe-8 M5-1 : REGP5_H0P04_T1P977
104 OCRE-TR-2013-003
Fig. 13i: Isolated wave components from measured wave data at Probe-9 M5-1 : REGP5_H0P04_T1P977
OCRE-TR-2013-003 105
Fig. 13j: Isolated wave components from measured wave data at Probe-10 M5-1 : REGP5_H0P04_T1P977
106 OCRE-TR-2013-003
Fig. 14a: Comparisons between primary and low frequency wave energy Probes: 1-2-3-8-9-10
OCRE-TR-2013-003 107
Fig. 14b: Comparisons between high frequency wave energy Probes: 1-2-3-8-9-10
108 OCRE-TR-2013-003
Fig. 14c: Comparisons between primary and low frequency wave energy Probes: 5-4-3-6-7
OCRE-TR-2013-003 109
Fig. 14d: Comparisons between high frequency wave energy Probes: 5-4-3-6-7
110 OCRE-TR-2013-003
Fig. 14e: Comparisons between primary and low frequency wave energy Probes: 11-12-13-14
OCRE-TR-2013-003 111
Fig. 14f: Comparisons between high frequency wave energy Probes: 11-12-13-14
112 OCRE-TR-2013-003
Fig. 15a: Isolated wave components from measured wave data at Probe-1 M5-2 : REGP5_H0P08_T1P977
OCRE-TR-2013-003 113
Fig. 15b: Isolated wave components from measured wave data at Probe-2 M5-2 : REGP5_H0P08_T1P977
114 OCRE-TR-2013-003
Fig. 15c: Isolated wave components from measured wave data at Probe-3 M5-2 : REGP5_H0P08_T1P977
OCRE-TR-2013-003 115
Fig. 15d: Isolated wave components from measured wave data at Probe-4 M5-2 : REGP5_H0P08_T1P977
116 OCRE-TR-2013-003
Fig. 15e: Isolated wave components from measured wave data at Probe-5 M5-2 : REGP5_H0P08_T1P977
OCRE-TR-2013-003 117
Fig. 15f: Isolated wave components from measured wave data at Probe-6 M5-2 : REGP5_H0P08_T1P977
118 OCRE-TR-2013-003
Fig. 15g: Isolated wave components from measured wave data at Probe-7 M5-2 : REGP5_H0P08_T1P977
OCRE-TR-2013-003 119
Fig. 15h: Isolated wave components from measured wave data at Probe-8 M5-2 : REGP5_H0P08_T1P977
120 OCRE-TR-2013-003
Fig. 15i: Isolated wave components from measured wave data at Probe-9 M5-2 : REGP5_H0P08_T1P977
OCRE-TR-2013-003 121
Fig. 15j: Isolated wave components from measured wave data at Probe-10 M5-2 : REGP5_H0P08_T1P977
122 OCRE-TR-2013-003
Fig. 16a: Comparisons between primary and low frequency wave energy Probes: 1-2-3-8-9-10
OCRE-TR-2013-003 123
Fig. 16b: Comparisons between high frequency wave energy Probes: 1-2-3-8-9-10
124 OCRE-TR-2013-003
Fig. 16c: Comparisons between primary and low frequency wave energy Probes: 5-4-3-6-7
OCRE-TR-2013-003 125
Fig. 16d: Comparisons between high frequency wave energy Probes: 5-4-3-6-7
126 OCRE-TR-2013-003
Fig. 16e: Comparisons between primary and low frequency wave energy Probes: 11-12-13-14
OCRE-TR-2013-003 127
Fig. 16f: Comparisons between high frequency wave energy Probes: 11-12-13-14
128 OCRE-TR-2013-003
Fig. 17a: Isolated wave components from measured wave data at Probe-1 M5-3 : REGP5_H0P06_T2P829
OCRE-TR-2013-003 129
Fig. 17b: Isolated wave components from measured wave data at Probe-2 M5-3 : REGP5_H0P06_T2P829
130 OCRE-TR-2013-003
Fig. 17c: Isolated wave components from measured wave data at Probe-3 M5-3 : REGP5_H0P06_T2P829
OCRE-TR-2013-003 131
Fig. 17d: Isolated wave components from measured wave data at Probe-4 M5-3 : REGP5_H0P06_T2P829
132 OCRE-TR-2013-003
Fig. 17e: Isolated wave components from measured wave data at Probe-5 M5-3 : REGP5_H0P06_T2P829
OCRE-TR-2013-003 133
Fig. 17f: Isolated wave components from measured wave data at Probe-6 M5-3 : REGP5_H0P06_T2P829
134 OCRE-TR-2013-003
Fig. 17g: Isolated wave components from measured wave data at Probe-7 M5-3 : REGP5_H0P06_T2P829
OCRE-TR-2013-003 135
Fig. 17h: Isolated wave components from measured wave data at Probe-8 M5-3 : REGP5_H0P06_T2P829
136 OCRE-TR-2013-003
Fig. 17i: Isolated wave components from measured wave data at Probe-9 M5-3 : REGP5_H0P06_T2P829
OCRE-TR-2013-003 137
Fig. 17j: Isolated wave components from measured wave data at Probe-10 M5-3 : REGP5_H0P06_T2P829
138 OCRE-TR-2013-003
Fig. 18a: Comparisons between primary and low frequency wave energy Probes: 1-2-3-8-9-10
OCRE-TR-2013-003 139
Fig. 18b: Comparisons between high frequency wave energy Probes: 1-2-3-8-9-10
140 OCRE-TR-2013-003
Fig. 18c: Comparisons between primary and low frequency wave energy Probes: 5-4-3-6-7
OCRE-TR-2013-003 141
Fig. 18d: Comparisons between high frequency wave energy Probes: 5-4-3-6-7
142 OCRE-TR-2013-003
Fig. 18e: Comparisons between primary and low frequency wave energy Probes: 11-12-13-14
OCRE-TR-2013-003 143
Fig. 18f: Comparisons between high frequency wave energy Probes: 11-12-13-14
144 OCRE-TR-2013-003
Fig. 19a: Isolated wave components from measured wave data at Probe-1 M5-4 : REGP5_H0P08_T3P704
OCRE-TR-2013-003 145
Fig. 19b: Isolated wave components from measured wave data at Probe-2 M5-4 : REGP5_H0P08_T3P704
146 OCRE-TR-2013-003
Fig. 19c: Isolated wave components from measured wave data at Probe-3 M5-4 : REGP5_H0P08_T3P704
OCRE-TR-2013-003 147
Fig. 19d: Isolated wave components from measured wave data at Probe-4 M5-4 : REGP5_H0P08_T3P704
148 OCRE-TR-2013-003
Fig. 19e: Isolated wave components from measured wave data at Probe-5 M5-4 : REGP5_H0P08_T3P704
OCRE-TR-2013-003 149
Fig. 19f: Isolated wave components from measured wave data at Probe-6 M5-4 : REGP5_H0P08_T3P704
150 OCRE-TR-2013-003
Fig. 19g: Isolated wave components from measured wave data at Probe-7 M5-4 : REGP5_H0P08_T3P704
OCRE-TR-2013-003 151
Fig. 19h: Isolated wave components from measured wave data at Probe-8 M5-4 : REGP5_H0P08_T3P704
152 OCRE-TR-2013-003
Fig. 19i: Isolated wave components from measured wave data at Probe-9 M5-4 : REGP5_H0P08_T3P704
OCRE-TR-2013-003 153
Fig. 19j: Isolated wave components from measured wave data at Probe-10 M5-4 : REGP5_H0P08_T3P704
154 OCRE-TR-2013-003
Appendix – III
Compares energy distribution and second order wave components for mono-chromatic wave over 0.6m water depth at different probe locations.
Probes array: Probes: 1-2-3-8-9-10
Probes: 5-4-3-6-7 Probes 11-12-13-14
OCRE-TR-2013-003 155
Fig. 20a: Comparisons between primary and low frequency wave energy Probes: 1-2-3-8-9-10
156 OCRE-TR-2013-003
Fig. 20b: Comparisons between high frequency wave energy Probes: 1-2-3-8-9-10
OCRE-TR-2013-003 157
Fig. 20c: Comparisons between primary and low frequency wave energy Probes: 5-4-3-6-7
158 OCRE-TR-2013-003
Fig. 20d: Comparisons between high frequency wave energy Probes: 5-4-3-6-7
OCRE-TR-2013-003 159
Fig. 20e: Comparisons between primary and low frequency wave energy Probes: 11-12-13-14
M6-1 : REGP6_H0P06_T0P9 before after
160 OCRE-TR-2013-003
Fig. 20f: Comparisons between high frequency wave energy Probes: 11-12-13-14
OCRE-TR-2013-003 161
Fig. 21a: Isolated wave components from measured wave data at Probe-1 M6-1 : REGP6_H0P06_T0P9
162 OCRE-TR-2013-003
Fig. 21b: Isolated wave components from measured wave data at Probe-2 M6-1 : REGP6_H0P06_T0P9
OCRE-TR-2013-003 163
Fig. 21c: Isolated wave components from measured wave data at Probe-3 M6-1 : REGP6_H0P06_T0P9
164 OCRE-TR-2013-003
Fig. 21d: Isolated wave components from measured wave data at Probe-4 M6-1 : REGP6_H0P06_T0P9
OCRE-TR-2013-003 165
Fig. 21e: Isolated wave components from measured wave data at Probe-5 M6-1 : REGP6_H0P06_T0P9
166 OCRE-TR-2013-003
Fig. 21f: Isolated wave components from measured wave data at Probe-6 M6-1 : REGP6_H0P06_T0P9
OCRE-TR-2013-003 167
Fig. 21g: Isolated wave components from measured wave data at Probe-7 M6-1 : REGP6_H0P06_T0P9
168 OCRE-TR-2013-003
Fig. 21h: Isolated wave components from measured wave data at Probe-8 M6-1 : REGP6_H0P06_T0P9
OCRE-TR-2013-003 169
Fig. 21i: Isolated wave components from measured wave data at Probe-9 M6-1 : REGP6_H0P06_T0P9
170 OCRE-TR-2013-003
Fig. 21j: Isolated wave components from measured wave data at Probe-10 M6-1 : REGP6_H0P06_T0P9
OCRE-TR-2013-003 171
Appendix – IV
Compares energy distribution and second order wave components for bi-chromatic wave over 0.4m water depth at different probe locations.
Probes array: Probes: 1-2-3-8-9-10
Probes: 5-4-3-6-7 Probes 11-12-13-14
172 OCRE-TR-2013-003
Fig. 22a: Comparisons between primary and low frequency wave energy Probes: 1-2-3-8-9-10
OCRE-TR-2013-003 173
Fig. 22b: Comparisons between high frequency wave energy Probes: 1-2-3-8-9-10
174 OCRE-TR-2013-003
Fig. 22c: Comparisons between primary and low frequency wave energy Probes: 5-4-3-6-7
OCRE-TR-2013-003 175
Fig. 22d: Comparisons between high frequency wave energy Probes: 5-4-3-6-7
176 OCRE-TR-2013-003
Fig. 22e: Comparisons between primary and low frequency wave energy Probes: 11-12-13-14
OCRE-TR-2013-003 177
Fig. 22f: Comparisons between high frequency wave energy Probes: 11-12-13-14
178 OCRE-TR-2013-003
Fig. 23a: Isolated wave components from measured wave data at Probe-1 B4-1 : BIP4_H0P06_T1P25_T1P17
OCRE-TR-2013-003 179
Fig. 23b: Isolated wave components from measured wave data at Probe-2 B4-1 : BIP4_H0P06_T1P25_T1P17
180 OCRE-TR-2013-003
Fig. 23c: Isolated wave components from measured wave data at Probe-3 B4-1 : BIP4_H0P06_T1P25_T1P17
OCRE-TR-2013-003 181
Fig. 23d: Isolated wave components from measured wave data at Probe-4 B4-1 : BIP4_H0P06_T1P25_T1P17
182 OCRE-TR-2013-003
Fig. 23e: Isolated wave components from measured wave data at Probe-5 B4-1 : BIP4_H0P06_T1P25_T1P17
OCRE-TR-2013-003 183
Fig. 23f: Isolated wave components from measured wave data at Probe-6 B4-1 : BIP4_H0P06_T1P25_T1P17
184 OCRE-TR-2013-003
Fig. 23g: Isolated wave components from measured wave data at Probe-7 B4-1 : BIP4_H0P06_T1P25_T1P17
OCRE-TR-2013-003 185
Fig. 23h: Isolated wave components from measured wave data at Probe-8 B4-1 : BIP4_H0P06_T1P25_T1P17
186 OCRE-TR-2013-003
Fig. 23i: Isolated wave components from measured wave data at Probe-9 B4-1 : BIP4_H0P06_T1P25_T1P17
OCRE-TR-2013-003 187
Fig. 23j: Isolated wave components from measured wave data at Probe-10 B4-1 : BIP4_H0P06_T1P25_T1P17
188 OCRE-TR-2013-003
Fig. 24a: Comparisons between primary and low frequency wave energy Probes: 1-2-3-8-9-10
OCRE-TR-2013-003 189
Fig. 24b: Comparisons between high frequency wave energy Probes: 1-2-3-8-9-10
190 OCRE-TR-2013-003
Fig. 24c: Comparisons between primary and low frequency wave energy Probes: 5-4-3-6-7
OCRE-TR-2013-003 191
Fig. 24d: Comparisons between high frequency wave energy Probes: 5-4-3-6-7
192 OCRE-TR-2013-003
Fig. 24e: Comparisons between primary and low frequency wave energy Probes: 11-12-13-14
OCRE-TR-2013-003 193
Fig. 24f: Comparisons between high frequency wave energy Probes: 11-12-13-14
194 OCRE-TR-2013-003
Fig. 25a: Isolated wave components from measured wave data at Probe-1 B4-2 : BIP4_H0P06_T1P55_T1P45
OCRE-TR-2013-003 195
Fig. 25b: Isolated wave components from measured wave data at Probe-2 B4-2 : BIP4_H0P06_T1P55_T1P45