Publisher’s version / Version de l'éditeur:
Questions? Contact the NRC Publications Archive team at
[email protected]. If you wish to email the authors directly, please see the first page of the publication for their contact information.
https://publications-cnrc.canada.ca/fra/droits
L’accès à ce site Web et l’utilisation de son contenu sont assujettis aux conditions présentées dans le site LISEZ CES CONDITIONS ATTENTIVEMENT AVANT D’UTILISER CE SITE WEB.
Proceedings of the NATO Advanced Research Workshop on Water Reuse - Risk Assessment, Decision-Making and Environmental Security, pp. 241-252, 2007-05-01
READ THESE TERMS AND CONDITIONS CAREFULLY BEFORE USING THIS WEBSITE. https://nrc-publications.canada.ca/eng/copyright
NRC Publications Archive Record / Notice des Archives des publications du CNRC :
https://nrc-publications.canada.ca/eng/view/object/?id=09652068-a3c5-4d55-b02f-ea7fd94ce4f2 https://publications-cnrc.canada.ca/fra/voir/objet/?id=09652068-a3c5-4d55-b02f-ea7fd94ce4f2
NRC Publications Archive
Archives des publications du CNRC
Access and use of this website and the material on it are subject to the Terms and Conditions set forth at
Sewerage infrastructure: fuzzy techniques to model deterioration and manage failure risk
http://irc.nrc-cnrc.gc.ca
S e w e r a g e i n f r a s t r u c t u r e : f u z z y t e c h n i q u e s t o
m a n a g e f a i l u r e s
N R C C - 4 9 5 0 1
K l e i n e r , Y . ; R a j a n i , B . ; S a d i q , R .
A version of this document is published in / Une version de ce document se trouve dans: Wastewater Reuse – Risk Assessment, Decision-Making and Environmental Security: NATO Security through Science Series, May 2007, pp. 241-252
The material in this document is covered by the provisions of the Copyright Act, by Canadian laws, policies, regulations and international agreements. Such provisions serve to identify the information source and, in specific instances, to prohibit reproduction of materials without written permission. For more information visit http://laws.justice.gc.ca/en/showtdm/cs/C-42
Les renseignements dans ce document sont protégés par la Loi sur le droit d'auteur, par les lois, les politiques et les règlements du Canada et des accords internationaux. Ces dispositions permettent d'identifier la source de l'information et, dans certains cas, d'interdire la copie de documents sans permission écrite. Pour obtenir de plus amples renseignements : http://lois.justice.gc.ca/fr/showtdm/cs/C-42
Sewerage Infrastructure: Fuzzy techniques to Model
Deterioration and Manage Failure Risk
Yehuda Kleiner, Balvant Rajani, Rehan Sadiq
Urban Infrastructure Program, Institute for Research in Construction National Research Council, Ottawa, Ontario, Canada K1A 0R6
Abstract: An approach is presented to model the deterioration of
buried, infrequently inspected infrastructure, using scarce data. The robustness of the Markov process is combined with the flexibility of fuzzy mathematics to arrive at a decision framework that is tractable and realistic. In applying this approach to sewerage infrastructure we convert the scoring schemes used by current guidelines into fuzzy condition ratings. A rule-based fuzzy Markov model is used to replicate and predict the possibility of failure. The possibility of failure is combined with fuzzy failure consequences to obtain the fuzzy risk of failure throughout the life of the asset. The model can be used to plan the renewal of the asset subject to maximum risk tolerance. The concepts are demonstrated using data obtained from Canadian municipalities.
Keywords: Sewerage infrastructure, deterioration modelling, fuzzy sets, failure risk management, inspection.
1. Introduction
As buried pipes age and deteriorate, this deterioration manifests itself in visible or detectable or measurable phenomena, such as cracks, holes, deformations, etc. These phenomena are referred to as “distress
indicators” or “defects” (used interchangeably in this paper). Sometimes defects are initiated as a result of faulty installation rather than deterioration, but in those cases these initial defects will be exasperated by the ageing and deterioration of the pipe.
Several protocols are available in the literature to record distress indicators and then translate them into condition rating. In this paper we mention two, those proposed by the Water Research Centre (WRc) in the UK and the National Research Council of Canada (NRC). The WRc is perhaps the most widely used protocol today. It was initiated in 1978 as a 5-year research project to investigate failures of sewer mains. Based on this research Sewerage Rehabilitation Manual (SRM) was developed [1]
- [4]. The manual has gone through several revisions and the latest is the 4th edition which includes a computerized grading system compatible with European defect coding systems, and new design methods for renovation techniques [4]. The NRC’s protocol is known as Guidelines
for Condition Assessment and Rehabilitation of Large Sewers [5]. These guidelines were developed in partnership with several Canadian municipalities and consulting engineers, and are intended for large-diameter sewers (>900 mm) only.
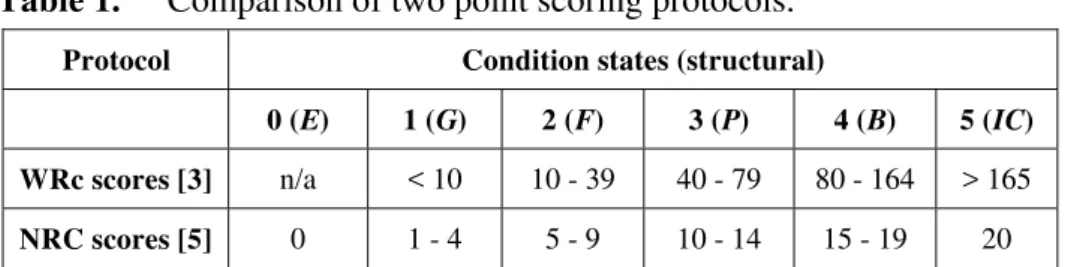
Both The WRc and the NRC protocols largely use a point scoring approach, whereby each type of defect is assigned a score (aka “deduct value”). After a score is assigned to each observed defect, they are tallied and the totals are used to rate the condition of the pipe. While WRc uses a scale of 165 deduct values for condition rating, NRC uses a 20-point scale. Table 1 illustrates point score schemes of both protocols. Note that both protocols contain separate scoring schemes for structural and operational observed defects. In this paper we deal only with the structural aspects of pipe deterioration. It is clear that while WRc uses a 5-grade rating, NRC uses six, from zero to five where 0 = excellent, 1 =
good (G), 2 = fair (F), 3 = poor (P), 4 = bad (B) and 5 = imminent
collapse (IC). Table 2 provides a summary of structural distress indicators (defects) and their associated point scores (deduct values) in the two protocols.
Table 1. Comparison of two point scoring protocols.
Protocol Condition states (structural)
0 (E) 1 (G) 2 (F) 3 (P) 4 (B) 5 (IC)
WRc scores [3] n/a < 10 10 - 39 40 - 79 80 - 164 > 165
NRC scores [5] 0 1 - 4 5 - 9 10 - 14 15 - 19 20
The process of applying the protocol to real situations is inherently imprecise and subjective. Often, two different evaluators will provide different scores to the same observed defects. Moreover, on observing Table 1, one cannot help wonder whether a deduct value of 80 (WRc protocol) is in fact equivalent to 164, when both scores would translate to a condition state of 4. Additionally, the current framework does not lend itself easily to the consideration of the time dimension in order to
obtain rate of deterioration. Evaluating the rate of deterioration is important in order to facilitate educated decisions on scheduling pipe renewal or alternatively, scheduling the next inspection.
Table 2. Distress indicators and their assigned scores (deduct values). Scores Distress indicator
(defect)1 Distress Level2 Unit
NRC WRc
• Light (up to 3 cracks, no leakage) metre 3 10
Longitudinal
crack • Moderate (> 3 cracks, leakage) metre 5 40
• Light (up to 3 cracks, no leakage) metre 3 10
Circumferential
crack • Moderate (> 3 cracks, leakage) metre 5 40
• Light (up to 3 cracks, no leakage) metre 3 n/a
• Moderate (> 3 cracks, leakage) metre 5 n/a
Diagonal crack
• Severe (multiple cracks, leakage) metre 10 40
• Light (< 10 mm) metre 5 40
• Moderate (10 – 25 mm or more than one) metre 10 80
Longitudinal fracture
• Severe (> 25 mm) metre 15 n/a
• Light (< 10 mm) metre 5 40
• Moderate (10 – 25 mm or more than one) metre 10 80
Circumferential fracture
• Severe (> 25 mm) metre 15 n/a
• Light (< 10 mm) metre 5 40
• Moderate (10 – 25 mm or multiple) metre 10 80
Diagonal fracture
• Severe (> 25 mm) metre 15 n/a
• Light (< 5% change in diameter) metre 5 20
• Moderate (5% – 10% change in
diameter) metre 10 80
Deformation
• Severe (11% – 25% change in diameter) metre 15 165
• Light metre 3 5
• Moderate metre 10 20
Surface damage (spalling)
• Severe metre 15 120
• Light (< ¼ pipe wall thickness) each 3 n/a
Joint
displacement • Moderate (¼ – ½ pipe wall thickness) each 10 1
• Severe (> ½ pipe wall thickness) each 15 2
Broken pipe each 15 60
Collapse each 20 165
1 This non-exhaustive list is based on [3], [5].
In this paper a framework is proposed, whereby the scores obtained from conventional scoring protocols are transformed into a fuzzy-based condition ratings. Subsequently this fuzzy condition rating is used in conjunction with a fuzzy Markov-based deterioration model (developed elsewhere). The model is used to predict pipe future condition and make some risk-based decisions on whether to renew the pipe or schedule the next inspection. This framework is presented with the help of a case study, using real data on sewers obtained from a Canadian municipality.
The rest of this paper is structured as follows. In the next section a simple method to transform point scores to fuzzy condition rating is presented. Section 3 provides a brief description of the rule-based fuzzy Markov deterioration model, which has been developed elsewhere. Section 4 demonstrates the fuzzy risk concept and Section 5 discusses decision-making. Section 6 summarise the paper and provides ideas on future research directions.
2. Fuzzy condition rating
The Markovian deterioration process requires that the condition of the deteriorating asset be encoded as an ordinal condition state (e.g., State 1,
State 2, or Excellent, Good, Fair, etc.). The condition assessment of buried pipes comprises two steps. The first step involves the inspection of the asset using direct observation (visual, video) and/or NDE techniques (radar, sonar, ultrasound, sound emissions, etc.), which reveal distress indicators. The second step involves the translation of these distress indicators to determine the condition rating of the asset. As described earlier, there are already well accepted protocols to define the nature and weight of various distress indicators in sewers, therefore we shall use them as the basis from which to transform into a fuzzy-based rating method. For lack of space, it is assumed that the reader has basic notions of fuzzy sets, however for the uninitiated, reference [6] provides a brief description with an emphasis on the application of fuzzy sets to condition rating of assets.
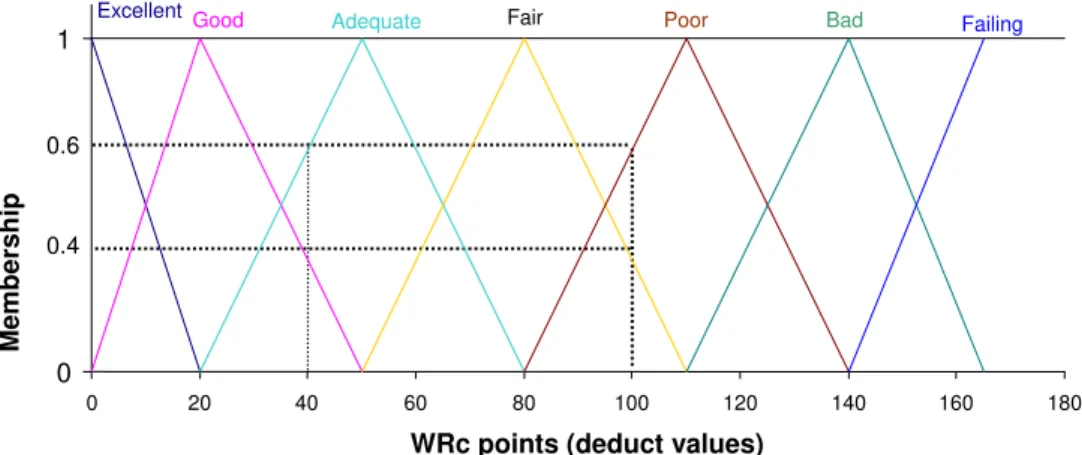
We define a seven-grade condition scale: Excellent, Good, Adequate,
Fair, Poor, Bad and Failing. Each grade (or state) is represented by a triangular fuzzy set. The WRc protocol has a range of scores from zero to 165. This range will be mapped on the proposed seven-grade condition scale as described in Table 3 and illustrated in Figure 1. For example, an aggregate score of 100 (WRc protocol) will yield 40% membership to the Fair state and 60% membership to the Poor state or symbolically its condition rating will be (0, 0, 0, 0.4, 0.6, 0, 0).
Table 3. Seven-grade fuzzy scale for condition rating.
Order Descriptor Triangular fuzzy number (TFN)
representation 1 Excellent (q1,1, q1,2, q1,3) = (0, 0, 20) 2 Good (q2,1, q2,2, q2,3) = (0, 20, 50) 3 Adequate (q3,1, q3,2, q3,3) = (20, 50, 80) 4 Fair (q4,1, q4,2, q4,3) = (50, 80, 110) 5 Poor (q5,1, q5,2, q5,3) = (80, 110, 140) 6 Bad (q6,1, q6,2, q6,3) = (110, 140, 165) 7 Failing (q7,1, q7,2, q7,3) = (140, 165, 165) 2.1. Example of fuzzy condition rating
Data suitable for the long-term deterioration modelling, should be with sufficient historical depth, yet at the same time consistent in definitions and interpretations. Unfortunately such data are hard to come by. In this paper, we used data on sewers from the Regional Municipality of Halton, Ontario, Canada, to illustrate the application of the framework to manage failure risks.
0.6 0.4 Memb er sh ip
ExcellentGood Adequate Fair Poor Bad
Failing
0 1
0 20 40 60 80 100 120 140 160 180
WRc points (deduct values)
Figure 1. Seven grade fuzzy scale for pipe condition rating
The first example is a 76 m long (manhole to manhole), 525 mm diameter vitrified clay (VC) pipe that was installed in 1962. The second is a 111 m long (manhole to manhole) 900 mm diameter concrete pipe installed in 1971. The observed distress indicators and their associated
WRc scores (deduct values) are shown in Table 4. These distress indicators are assumed to have been observed on a single pipe segment (typically 2-4 m long). The scores translate to a fuzzy rating of (0, 0.4, 0.6, 0, 0, 0, 0) and (0, 0, 0, 0.4, 0.6, 0, 0), for examples 1 and 2, respectively (Figure 1). Both pipes were assumed to be mainly in excellent condition (0.9, 0.10, 0, 0, 0, 0, 0) upon installation. Unfortunately, we could not obtain information on whether these pipes have been inspected again since year 2000.
Table 4. Distress indicators observed in examples 1 and 2.
Examp le Inspection year Description WRc score
1 2000 Longitudinal crack (assumed 40
2 2000 Longitudinal fracture 100
3. Rule-based fuzzy Markovian deterioration model
Markov process has frequently been used to modelling infrastructure asset deterioration [7] [8] [9] [10]. Kleiner et al. [6], [11] introduced a new approach to model the deterioration of buried infrastructure, using a fuzzy rule-based, non-homogeneous Markov process. This approach took advantage of the robustness of the Markov process and the flexibility of the fuzzy-based techniques, which seem to be particularly suited to model the condition rating as well as the deterioration of infrastructure assets, for which data are scarce and cause-effect knowledge is imprecise or vague.
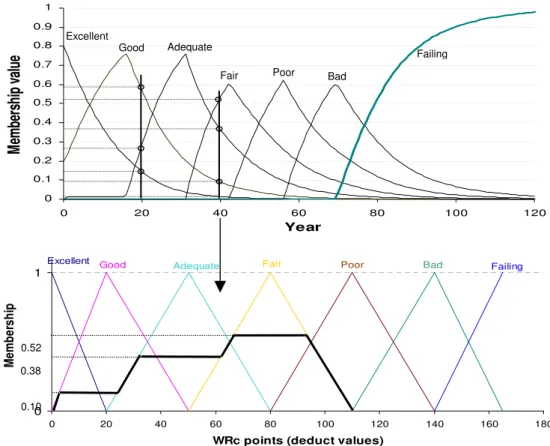
Full technical details of the proposed model can be found in [6] and [11]. The model yields a family of curves (Figure 2) that represent the deterioration processes. As the pipe ages (say from year 20 to year 40 - Figure 2), its memberships to good condition states diminish and memberships to worse condition states increase (the bottom of Figure 2 is a graphical representation of the condition rating in year 40). Using the threshold values concept [6], the model is formulated to mimic a reality in which a given asset at a given time cannot have significant membership values to more than two or three contiguous condition states. The deterioration model is calibrated (or trained) on observed condition ratings obtained from historical inspections and condition
assessments. Once the deterioration model has been trained, it can be used to predict the future condition of the pipe.
0 0.1 0.2 0.3 0.4 0.5 0.6 0.7 0.8 0.9 1 0 20 40 60 80 100 12 Year M emb er sh ip val ue Excellent Good 0 Adequate
Fair Poor Bad
Failing
Excellent Good Adequate Fair Poor Bad Failing
0 1
0 20 40 60 80 100 120 140 160 180
WRc points (deduct values)
M em b er shi p 0.38 0.10 0.52
Figure 2. Rule-based fuzzy Markov deterioration model
Membership to the Failing state can be transformed to a possibility mass function (as opposed to probability) of failure at every point along the life of the asset [11]. The possibility of failure can then coupled with failure consequence to obtain failure risk as a function of age, as is described later.
3.1. Example: training the deterioration model
We continue with the examples. Results of the training sessions on the Halton pipe data are illustrated in Figure 3. Note that example 1, which is an older pipe (installed in 1962) has a better condition rating than example 2 (installed in 1971), is anticipated to endure much longer. As mentioned earlier, data on subsequent inspections were not available;
therefore we could not validate the forecasted condition ratings. However, even if data were available, they would correspond to inspection that would have taken place at most 5-6 years later than the previous inspection. This short gap is often insufficient to provide credible validation results, as deterioration processes are typically quite slow for this type of infrastructure assets.
Figure 3. Examples: deterioration model training
3.2. Post-renewal condition improvement and subsequent deterioration
Renewal is defined as an action that improves the condition of the pipe and possibly impacts its deterioration rate as well. Typically, several pipe renewal technologies are available, each of which is assumed to have three specific attributes [6]. The first is a condition improvement matrix, which determines how much the condition of the pipe will improve immediately after renewal. The second is a
post-Example 1 Example 2 Inspection 1 0 1 2 3 4 5 6 7 8 9 1 0 20 40 60 80 100 120 140 M em b er sh ip to s ta te 0. 0. 0. 0. 0. 0. 0. 0. 0. Excellent Good Adequate Fair Poor bad Failing Inspection 0.1 0.2 0.3 0.4 0.5 0.6 0.7 0.8 0.9 0 10 20 30 40 50
Pipe Age (years)
M em b er sh ip t o stat e 0 1 Excellent Good Adequate Fair Poor bad Failing Example 1 Example 2
renewal deterioration rate matrix, which determines how fast the pipe will continue to deteriorate after renewal. The third is the cost associated with the renewal alternative.
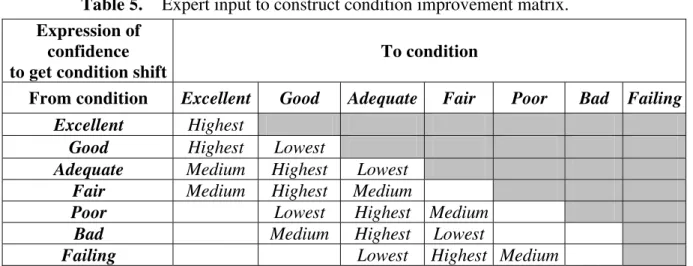
The condition improvement matrix can be populated based on hard field data. However until these types of data become available, this matrix would be established from expert opinion, as illustrated in Table 5. Similarly, the post-renewal deterioration rate matrix is also estimated from experience and expert opinion, as illustrated in Table 6. Renewal costs can usually be obtained from manufacturers/contractors.
Table 5. Expert input to construct condition improvement matrix.
Expression of confidence to get condition shift
To condition
From condition Excellent Good Adequate Fair Poor Bad Failing
Excellent Highest
Good Highest Lowest
Adequate Medium Highest Lowest
Fair Medium Highest Medium
Poor Lowest Highest Medium
Bad Medium Highest Lowest
Failing Lowest Highest Medium
Once the condition improvement and the post-renewal deterioration rate matrices are established, a new fuzzy Markov-based deterioration process can be modelled, where the pipe continues to deteriorate from its post-renewal condition. Figure 4 illustrates post-renewal deterioration for the pipe in example 1. If, after renewal it takes 29 years for the pipe to deteriorate to a condition rating similar to its pre-renewal condition, it can be said that the renewal action ‘bought’ 29 years of additional life.
Table 6. Expert input for evaluating the post-renewal deterioration rate.
Expression of confidence about the post-intervention deterioration rate relative to the current (observed) deterioration rate
Much
lower Lower Same Higher
Much higher
4. Fuzzy Risk of Failure
4.1. Likelihood, consequences and risk of failure
The risk of failure is determined jointly by the likelihood (possibility) and the consequences of a failure. Both WRc and NRC protocols do not explicitly address consequences of failure. However, both consider criticality of sewers in making decisions about prioritization for renewal and future inspections. This criticality is said to depend on location, importance, collateral damage and replacement cost. Consequently it can be safely concluded that criticality and failure
consequences are largely one and the same.
Accurate data on failure consequences including direct, indirect and social costs are difficult to come by. The fuzzy approach is therefore well suited to exploit the qualitative understanding many practitioners have about the conditions that affect these costs. The encoding process of failure consequences into fuzzy sets was beyond the scope of the underlying research, it was therefore assumed that these consequences could be described as a 9-grade (Extremely low, Very low, Quite low,
Moderately low, Medium, Moderately severe, Quite severe, Very severe, Extremely severe) possibility mass function. It was further assumed that this mass function is largely stationary over the periods of time (planning horizons).
Using a set of fuzzy rules, the fuzzy consequence mass function is coupled with the mass function that defines the possibility of failure to obtain another mass function that describes the risk of failure as a 9-grade (Extremely low, Very low, Quite low, Moderately low, Medium,
Moderately high, Quite high, Very high, Extremely high) fuzzy set [11]. The risk mass function (which is a fuzzy number) is calculated for each time to obtain the fuzzy risk of failure throughout the life of the pipe. The result is a fuzzy risk curve as illustrated in Figure 5. The grey levels represent membership values to risk levels (darker grey for a higher membership).
Pre-intervention "failing" Post-intervention "failing" 42 Current renew al 71 Next renew al Time bought 0.0 0.1 0.2 0.3 0.4 0.5 0.6 0.7 0.8 0.9 1.0 0 20 40 60 80 100 120 140 160 180 200
Pipe age (years)
M e m b e rsh ip va lu e E G Renewal Next Renewal Time bought
Figure 4. Deterioration curves before and after renewal (E=Excellent,
G=Good, A=Adequate, F=Fair, P=Poor, B=Bad)
Figure 5. Life-time fuzzy risk (dark line represents defuzzified values).
A F a f p b E, G,….,B - Pre-intervention e, g,….,b - Post-intervention 0 20 40 60 80 100 120 140 Age Pipe age (years) Extremely low Extremely high Very high Very low Quite low Quite high ris k Moderately high Moderatel Medium y Fuzz y low
5. Making Decisions
5.1. Maximum risk tolerance as a decision criterion
The owners of the sewer can, through a consensus-building process like Delphi, define their maximum risk tolerance (MRT), while considering both the possibility of failure and the failure consequences. Further, it can be assumed that any decision to renew or rehabilitate a pipe segment or section will always be preceded by an inspection and condition assessment. Thus, if the deterioration model predicts that MRT is going to be reached at a given time, it follows that an inspection/condition assessment will be scheduled around that time [11]. This inspection/condition assessment can have one of two outcomes: • The observed condition of the pipe is better than predicted (the
model overestimated the deterioration rate) and MRT has not yet been reached. In this case the deterioration model is re-calibrated to include the newly acquired data, then re-applied and the next inspection/condition assessment is scheduled for the next time at which MRT is predicted to be reached.
• The observed condition of the pipe is the same or worse than the model predicted and current risk is equal to or exceeds MRT. In this case renewal work has to be planned immediately and implemented as soon as possible.
Several alternative renewal technologies available in the market place need to be evaluated to select the most appropriate one when pipe renewal is required. In the selection, the owner has to consider both the improvement that the renewal action will affect and the post renewal deterioration rate. The owner may resort to the time ‘bought’ concept explained earlier to make this selection. If, for example, a renewal technology that costs $100,000 buys 20 years of additional life (i.e., postpones subsequent renewal by 20 years until the time at which MRT is reached again), the normalized cost of this technology can be thought of as $5,000 per year of extra life. The owner will usually select the technology with the lowest cost per year of extra life. It is noted that two assumptions are implicit in this decision approach: (a) cost of asset renewal is independent of the condition of the renewed asset, and (b) asset owner will always try to reach MRT and will not consider any risk-cost trade-off, i.e., lowering risk exposure at a higher risk-cost. An alternative approach to decision making was outlined [12], where these two implicit assumptions are relaxed and the trade-off between cost and risk exposure is explicitly considered, but this is beyond the scope of this paper.
5.2. Example: fuzzy risk of failure
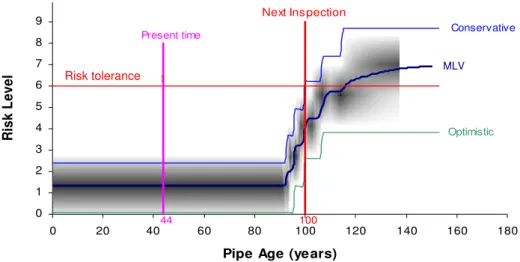
Continuing with the pipe in example 1, we assume the following: fuzzy consequence of failure is given by (0, 0, 0.5, 0.5, 0, 0, 0, 0, 0), i.e., 0.5 memberships to Quite low and Moderately low consequence grade; MRT = Moderately high; analysis year is 2006 (pipe is 44 years old). As illustrated in Figure 6, next inspection should be scheduled about 56 years into the future if a conservative approach is taken.
Risk tolerance 100 Next Inspection MLV Conservative Optimistic Present time 44 0 1 2 3 4 5 6 7 8 9 0 20 40 60 80 100 120 140 160 180
Pipe Age (years)
R
isk L
evel
Risk tolerance MLV
Figure 6. Example: decision (MLV = most likely value)
6. Summary and Conclusions
Fuzzy-based techniques are particularly suited to model the deterioration of buried sewer mains, for which data are scarce, cause-effect knowledge is imprecise and observations and criteria are often expressed in vague terms. Although there are several accepted protocols for recording distress indicators (defects) and interpreting those into condition grades, these interpretations are too broad and do not lend themselves to deterioration modelling. Consequently, renewal decisions are rather prescriptive and general. An approach was developed, to use parts of existing protocols and extend them into a more quantitative and specific decision framework. This approach can be summarized in these clearly defined steps:
1. Use existing protocols (WRc, NRC, etc.) to inspect the sewer, record distress indicators and assign scores (deduct values).
2. Fuzzify these scores by remapping them on a fuzzy condition scale to obtain. a fuzzy condition rating for the sewer.
3. Use the condition rating to train a fuzzy Markov-based deterioration model and generate risk projection for the sewer service life.
4. Use expert opinion to generate post-renewal condition improvement as well as post-renewal deterioration rate for selected renewal alternatives.
5. Evaluate renewal strategies, by comparing their associated “cost per year bought” values.
6. If the deterioration model was trained using condition assessment data that are old, it is prudent to perform an inspection/condition assessment before the actual renewal is carried out. The new data will be used either to confirm the decision or to re-train the model for future analysis.
Sewers have been known to function for decades, sometimes many decades. It is difficult to ensure that inspections and condition assessments carried out many years apart are carried out in a consistent manner. This is a limitation inherent in this type of activity and it requires the application of engineering judgement, perhaps to use variable weights for inspections that are deemed to be less reliable.
Acknowledgement
This paper is largely based on research co-funded by the American Water Works Association Research Foundation (AwwaRF) and the Institute for Research in Construction of the National Research Council of Canada (IRC/NRC), with Special thanks to my colleague Dr. Dana Vanier who helped to obtain and process data and provided useful comments.
We wish also to acknowledge NATO for providing the stage and financial support for presenting this research.
References
1. WRc (1986). Sewer Rehabilitation Manual, Second Edition, Water Research Centre plc, UK.
2. WRc (1993). Manual of Sewer Condition Classification, Third Edition, Water Research Centre plc, UK.
3. WRc (1994). Sewerage Rehabilitation Manual, Third Edition, Water Research Center plc, UK
4. WRc (2001). Sewerage Rehabilitation Manual, Fourth Edition, Water Research Centre plc, UK.
5. Zhao, J.Q., McDonald, S.E., and Kleiner, Y. (2001). Guidelines for
Condition Assessment and Rehabilitation of Large Sewers. Institute for Research in Construction, National Research Council of Canada, Ottawa.
6. Kleiner, Y., Sadiq, R. and Rajani, B. (2006). Modelling the deterioration of buried infrastructure as a fuzzy Markov process,
Journal of Water Supply Research and Technology: Aqua, 55(2): 67-80.
7. Madanat, S.M., Karlaftis, M.G., and McCarthy, P.S. (1997). Probabilistic infrastructure deterioration models with panel data,
Journal of Infrastructure Systems, ASCE, 3(1): 4-9.
8. Wirahadikusumah, R., Abraham, D., and Isely, T. (2001). Challenging issues in modelling deterioration of combined sewers,
Journal of Infrastructure Systems, ASCE, 7(2): 77-84.
9. Mishalani, R.G., and Madanat, S.M. (2002). Computation of infrastructure transition probabilities using stochastic duration models, Journal of Infrastructure Systems, ASCE, 8(4): 139-148.
10. Kleiner, Y. (2001). Scheduling inspection and renewal of large infrastructure assets, Journal of Infrastructure Systems, ASCE, 7(4): 136-143.
11. Kleiner, Y., Rajani, B.B. and Sadiq, R. (2006). Failure risk
management of buried infrastructure using fuzzy-based techniques,
Journal of Water Supply Research and Technology: Aqua, 55 (2): 81-94.
12. Kleiner, Y. (2005). Risk approach to examine strategies for extending the residual life of large pipes, Middle East Water 2005, Proceedings
of the 3rd International Exhibition and Conference for Water Technology, Manama, Bahrain, November.