An Analysis of the Next Generation DNA Sequencing
Technology Market
by Joseph Graham
Submitted to the System Design & Management Program In Partial Fulfillment of the Requirements for the Degree of
Master of Science in Engineering and Management
at the
MASSACHUSETTS INSTITUTE OF TECHNOLOGY January 2007
D 2007 Joseph Graham All Rights Reserved
The author hereby grants to MIT permission to reproduce and to distribute publicly paper and electronic copies of this thesis document in whole or part.
Signature of Author
Joseph Graham System Design and Management Program January 2007
Certified By
nsor
Assistant Professor, Management of Technology Innovation & Entrepreneurshiv Certified By
No ~aAfeyan
V
~frsAper or Senior Leea j~..37teteulshi C e~r1~Certified By MASWCHUSETS WNSTM OF TEOHNOLOGY
FEB
0 5
2008
hi ale Director System Design and Management ProgramBARKER
An Analysis of the Next Generation DNA Sequencing Technology Market by
Joseph Graham
Submitted to the System Design & Management Program on January 19, 2007 in Partial Fulfillment of the Requirements for the
Degree of Master of Science in Engineering and Management
Abstract
While there is no shortage of successful and failed biotechnology ventures, it is still very difficult to gage, a priori, how a new company will fare in this industry. In many cases
new biotechnology ventures are driven by rapidly evolving technology and emergent customer needs, both unpredictable by nature. Also, the Biotech Industry faces increased public and federal scrutiny as companies attempt to navigate murky ethical and legal waters. This thesis will explore the ongoing development of the next generation DNA sequencing market in an effort to predict exactly which factors will play a role in
determining who will ultimately succeed. This will be accomplished through an analysis incorporating a combination of historical precedents in this industry and traditional market theories. The goal is to produce a set of dimensions along which to judge the current and future participants in this market in order to determine which are most likely to succeed.
Thesis Supervisor: Fiona Murray
Assistant Professor, Management of Technology Innovation & Entrepreneurship Thesis Supervisor: Noubar Afeyan
Table of Contents
Table of Figures... . 7
Introduction... 9
Chapter 1: Background on D N A Sequencing ... 11
1.1 H um an G enom e Project ... 12
1.2 H istory of the Technology ... 12
1.3 M arket Leader ... 15
1.4 Technology A ssessm ent ... 17
1.4.1 Q uality... 18
1.4.2 C om plexity of Sam ple Preparation ... 19
1.4.3 R ead Length ... 20
1.4.4 Throughput... 22
1.4.5 The N ature of the D ata ... 24
1.5 N ew Entrant O pportunity ... 24
1.6 N ew A pplications ... 25
1.6.1 G ene Expression... 25
1.6.2 G enom ic V ariation... 26
1.7 Examples of Next Generation Sequencing Technology (NGST) Companies .. 28
1.7.1 454 Life Sciences ... 28
1.7.2 Solexa Inc... 29
1.7.3 A gencourt Personal G enom ics... 29
1.7.4 H elicos Biosciences C orp... 29
Chapter 2: Conceptual Perspectives on Market Evolution... 33
2.1 Technology Push vs. M arket Pull... 33
2.2 Level of D isruption ... 33 2.3 D om inant D esign... 35 2.4 Intellectual Property... 36 2.5 Synthesis... 37 C hapter 3: Survey... 41 3.1 Survey M ethodology ... 41 3.2 Survey D esign ... 41 3.3 D ata A nalysis... 43 3.3.1 M arket O verview ... 44 3.3.2 Technology... 47 3.3.3 Intellectual Property ... 48 C hapter 4: C onclusions ... 53 R eferences... 57
A ppendix A : Four C olor Sanger Sequencing... 61
Appendix B: NIH Next Generation Sequencing Grant Awardees ... 65
O verview ... 66
R ound 1 - A w arded O ctober 14, 2004 ... 67
R ound 2 - A w arded A ugust 8, 2005... 70
R ound 3 - Aw arded O ctober 4, 2006... 72
Appendix C: Next Generation Sequencing Company Overview... 75
S olex a In c... 7 8
Sequencing by Ligation - Church Group and Agencourt Personal Genomics... 83
Helicos Biosciences... 85
Appendix D: Next Generation Sequencing Survey... 91
Part 1 - Background... 92
Part 2 - M arket Overview... 93
Part 3 - Technology ... 94
Part 4 - Intellectual Property ... 95
Part 5 - Funding ... 96
Table of Figures
Figure 1 -D N A O verview ... 11
Figure 2 -NCBI Trace Submissions March 2001 to November 2006 ... 14
Figure 3 -Cost to Sequence 1000 Base pairs at the Broad Institute vs. Moore's Law... 15
Figure 4 -ABI's Revenue from Sequencing Products 2001-2006... 16
Figure 5 - ABI Revenue from All DNA Products 2001-2006... 17
Figure 6 -Average Error Rates of Thermostable DNA Polymerase During PCR ... 19
Figure 7 - Unique Sequence for Varying Read Length in the Human Genome ... 21
Figure 8 - Unique Sequence for Varying Read Length in X-phage and E.Coli K12... 21
Figure 9 - Typical Sequencing Process... 23
Figure 10 - Illumina and Affymetrix Revenue 2001-2005... 26
Figure 11 - Methods for Detecting Structural Variants in the Human Genome... 27
Figure 12 - Next Generation Sequencing Company Timeline... 31
Figure 13 - Christensen's View on Disruptive Technology ... 34
Figure 14 - Utterback's Phase Diagram for New Companies ... 35
Figure 15 - N ew M arket Evolution... 39
Figure 16 - Ranking of the Factors Motivating Entry into the Sequencing Technology M ark et... 4 4 Figure 17 -Ranking of the Attractiveness of Potential Markets for DNA Sequencing T ech n o lo gy ... 4 5 Figure 18 -Expected Customer Base for New Sequencing Technologies... 46
Figure 19 -Expected Relationship to Existing Technologies... 47
Figure 20 -Ranking of Effort Allocation to Develop the Different Technology C o m p o n en ts ... 4 8 Figure 21 -Perceived IP B enefit... 49
Figure 22 -Influence of IP Constraints on Technology Design ... 50
Figure 23 -Potential IP A ssim ilation... 50
Introduction
The promise of the $1000 genome is a future of personalized medicine where genetically-linked diseases are targeted at their source and eradicated. Progress towards this goal has been slow going and the basic science behind the leading technology has remained unchanged for over ten years. Recently, however, the quest for rapid, inexpensive DNA sequencing technology has been reinvigorated with the emergence of a handful of legitimate new technology companies as well as a host of academic efforts.
The last major round of innovation in DNA sequencing technology occurred in the late 90's and resulted in the emergence of a sole technology provider (Applied Biosystems) which has continued to dominate the market. This begs the question: will history repeat
itself; will the latest crop of technology developers be filtered down to one dominant sequencing technology provider that will dominate this market for the next ten years? This question is a complicated one that infers the ability to accurately predict how
companies respond in a new market setting with only a short and rapidly evolving history to rely on. Being able to predict the response of well established industries to the
introduction of new technology is difficult enough, for relatively new ones it becomes even more so.
This thesis is motivated by a desire to present a novel assessment of this market. In an attempt to sort out this puzzle it is necessary to first identify how this market is evolving including what the true market needs are today and what emergent market needs may surface. Once these needs are identified, the ability of the new technologies to address them can be quantified to some extent based on their claimed performance specifications, strength of intellectual property, and financial security. The weight of these factors will be determined based on the real world experiences of the companies operating in this space.
An introduction to DNA and sequencing will be provided in Chapter 1 in order to familiarize the reader with the history of this ground breaking science. Chapter 2
presents some widely held theories on how to characterize emergent technologies and their evolving market. Whether or not the next generation sequencing technologies conform to these widely held notions on market evolution will be explored. To support the correlation and divergence of this market from traditional models, a survey was circulated to some of the leaders in this field. The results are presented in Chapter 3. Finally, Chapter 4 discusses some conclusions and predictions that can be drawn regarding DNA sequencing and its future, while also suggesting some areas for future research.
Chapter 1: Background on DNA Sequencing
Even before Watson and Crick's historic unraveling of the structure of Deoxyribonucleic Acid (DNA) in 19531, scientists realized the importance of this molecule and its
implications. DNA serves as the storehouse for inherited traits by encoding the
information necessary for every cell making up an organism to behave and interact in a manner that sustains life. Consisting of the nucleic acids, adenine, thymine, guanine, and cytosine, referred to as DNA bases, which are linked together in long chains to form chromosomes, DNA serves as an intricate template which the cellular machinery uses to produce proteins and monitor cellular processes. This is done through a cascade of
events in which genes, or specific encoding sequences scattered throughout an organism's DNA, are read and converted.
Chromosome Cell DNA Sugar Phosphate Backbone Base pair Adenine -Thymine -Guanine -Cytosine -Nitrogeous base
Figure 1 -DNA Overview2
Watson, J., Crick, F. Molecular Structure of Nucleic Acids: A Structure for Deoxyribose Nucleic Acid.
Nature, 171(4356):737, 1953.
1.1 Human Genome Project
A Genome refers to the entire complement of DNA that defines an organism. For humans the genome consists of -3 billion bases of DNA arranged into 13 pairs of chromosomes. Each of the trillions of cells in the human body, except white blood cells contains an entire copy of that person's genome. While each person is believed to be
~99.9% the same genetically, the 0.1% difference correlates to about 3 million bases. In 1990 the NIH and DOE announced an ambitious project to sequence the entire genome of a representative group of humans that would serve as a template for further research.3 Having a reference genome, it was surmised, would enable researchers to more easily elucidate genetically linked diseases, identify potential drug targets, and gain a deeper understanding of cell function and the cell-environment interaction.
Originally slated to take about 15 years, the sequencing effort finished years ahead of schedule thanks to rapid improvement in DNA sequencing technologies driven by competition. The publication of 'The Initial Sequencing and Analysis of the Human Genome' in Nature magazine in 200 14, represented a remarkable step forward for scientific research and ushered in the post-genomic era where a reference genome is the first step toward the ability to rapidly and reliably sequence and compare DNA sequence.
1.2 History of the Technology
The ability to systematically sequence DNA was introduced in 1977 when Fred Sanger published his groundbreaking paper 'DNA Sequencing with Chain-Terminating
Inhibitors'5 which ultimately earned him a Nobel Prize. It took over another 20 years before the technology had advanced enough in regards to throughput and cost to even suggest tackling something as large as the human genome.
3 U.S. Department of Health and Human Services and Department of Energy, Understanding Our Genetic
Inheritance. The U.S. Human Genome Project: The First Five Years, April 1990.
4 International Human Genome Sequencing Consortium. Initial Sequencing and Analysis of the Human Genome. Nature, Vol. 409: 860-921, 2001.
5 Sanger, F., Nicklen, S., Coulson, A. DNA Sequencing with Chain-Terminating Inhibitors. Proceedings of
The problem with DNA sequencing is one of scale and throughput. A strand of DNA measures just 22 to 24 angstroms across and the average unit (a base pair) is only 3.3 angstroms long resulting in the need for some means to translate the information encoded by the sequence of bases into a detectable signal. Sanger sequencing relies on DNA polymerase combined with fluorescently labeled bases to create many copies of an
unknown strand of DNA incorporating a detectable fluorescent signal. This method then relies on a sieving matrix to sort out the labeled DNA by size enabling the determination
of both the identity and order of the sequence. The basic process is outlined in Appendix A.
Since its invention Sanger sequencing has been improved through the incorporation of thermally-stable polymerase, utilization of four different fluorescent dyes, invention of thermal cycling instruments, and introduction of capillary electrophoresis. Each of these improvements led to an increase in the amount of DNA that could be sequenced in a given time period and a reduction in the complexity of the operation. While many attribute the accelerated completion of the Human Genome Project to a competition that emerged with a private company (Celera Genomics), which was also attempting to sequence the Human Genome ahead of the public effort, it is certain that the timeline for both efforts benefited from the introduction of capillary sequencers.
Figure 2 reflects the rapid increase in trace submissions (a trace consisted of a continuous sequence of DNA typically around 700 base pairs long) to the National Center for biotechnology Information (NCBI, the database where all of the NIH funded sequence is made publicly available) between 2001 and 2006. This curve directly correlates with the introductions of new capillary sequencers by Applied Biosystems, the ABI 3700 in the late 90's and the ABI 3730 in 2002. While there were other technology providers attempting to meet the demand for low cost, high-throughput sequencing, these instruments dominated. This was reflected in the fact that they were the technology
choice of three of the largest sequencing centers (The Whitehead Institute, The Sanger Center, and Celera Genomics).
Trace Submission to NCBI 1.80E+08 1.60E+09 1.80E+08 -1.40E+09 1.40E+08 -1.20E+09 1.20E+08 S1.OOE+09 1.OOE+08 -- 8.OE+OB NewTraces
8.OOE+07 -+-Toal Traces
6.OOE+08 6.OOE+07
4.OOE+07 4.OOE+ 0
2.OOE+07 2.OOE+08
O.OOE+00 - O.OOE+O
Figure 2 - NCBI Trace Submissions March 2001 to November 20066
Advances in technology were accompanied by the emergence and scale-up of large genome sequencing centers which were able to take advantage of economies of scale and innovative new production methods to drive down the cost of sequencing down. This advantage was achieved through the introduction of automation and the ability to negotiate reduced pricing from vendors with larger volumes. Figure 3 shows the declining cost of sequencing 1000 bases of DNA experienced at the Broad Institute of MIT and Harvard (originally the Genome Sequencing Center of the Whitehead Institute) mapped against Moore's Law. Moore's Law reflects the fact that the cost per transistor has been declining inversely as the achievable density of transistors on a chip. This annual 2 fold decrease in cost per year has held up over the last 40 years and has often been compared to the declining cost of DNA sequencing. This comparison is interesting when considered in terms of what the scaling of chip technology has enabled and what
the scaling of sequencing technology hopes to enable.
6
From NCBI website, http://www.ncbi.nlm.nih.gov/
-DNA Sequencing Cost
$7.00 M&OO $4.0 $3.oo $20 $1.00 1998 1999 2000 2001 2002 2003 2004 2005Figure 3 - Cost to Sequence 1000 Base pairs at the Broad Institute vs. Moore's Law7
1.3 Market Leader
As mentioned earlier the Human Genome Project helped to enhance Applied Biosystems' position as the market leader in DNA sequencing technology. Strategic alliances with the larger labs involved in the HGP enabled ABI's 3700 instrument to quickly outsell its nearest competitor, Amersham Biosciences. By the time the 3730 (an upgrade from the
3700's 16 capillaries to 96 along with the addition of automated sample loading) was introduced in May of 2002, ABI was already entrenched in the market, enjoying annual sales of over $700 million by 2001.
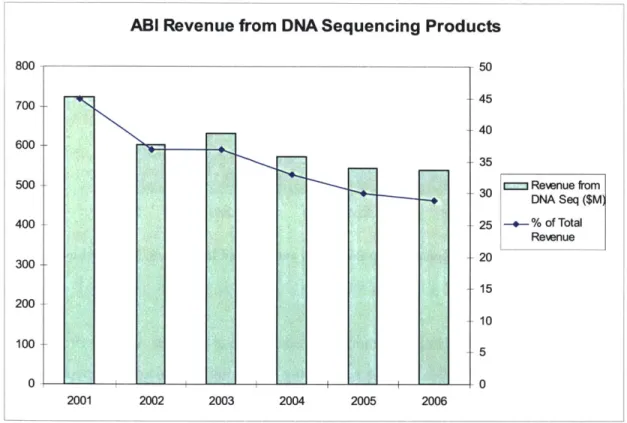
Looking at ABI's declining profits and revenue from DNA sequencing products from 2001 to 2006 (Figure 4), it is not obvious what makes this market so attractive to new 7
entrants. There are at least three explanations for this decline. First, although the NIH continues to fund the sequencing of large organisms, there has been no additional capacity scale-up at the large centers resulting in a net decrease in instrumentation sales. At the same time, the centers continue to drive the cost per base down as they refine and optimize their internal sequencing processes (thereby reducing the quantity of
consumables they need to purchase from ABI). Finally, with a reference genome in hand, many researchers have set their sites on new avenues of investigation, utilizing
technologies other than sequencing.
ABI Revenue from DNA Sequencing Products
800 50 700-4 40 600 35 5003 Reenue from 30 DNA Seq ($M) 400 - 25 -i- % of Total Reenue 300- 20 15 200 10 100_- 5 0 -0 2001 2002 2003 2004 2005 2006
Figure 4 - ABI's Revenue from Sequencing Products 2001-20068
One of the new areas of investigation is gene expression analysis, which will be discussed in greater detail later in the new applications section. ABI also has products that support this type of research which are reflected in Figure 5. Given the noticeable upward trend in revenues from these additional products, it is not difficult to see how a
technology that both encompassed and extended the capabilities of the existing technologies generating this revenue would be considered a reasonable investment.
ABI Revenue All DNA Products
800 700- 600--o Revenue from 500 DNA Seq ($M) 400 c Revenue from RTPCR and 300- Applied Genomics ($M) 200-- 100-- 0----2001 2002 2003 2004 2005 2006
Figure 5 - ABI Revenue from All DNA Products 2001-20069
1.4 Technology Assessment
The performance of DNA sequencing technology is assessed along a few different dimensions that vary in importance depending on the application being addressed. The primary dimensions are: Quality; Complexity of Sample Preparation; Read Length; Throughput (Bases/Hour, $/Base); and the Nature of the Final Data. For optimal analysis, DNA sequencing technology would be able to read off an entire chromosome, end to end, without interruption (this would be >200 million bases for human chromosome 1) and perhaps be able sequence an entire human genome in the same amount of time it takes a cell to create a copy of its genome when dividing (approximately 10 hours during the
synthesis phase of the cell cycle). Unfortunately, the greatest continuous length of DNA commonly sequenced by the market leading technology is five orders of magnitude less
than the typical chromosome (~800 base pairs) and takes more than an hour to generate. A decreased signal to noise ratio is the primary obstacle to extending Sanger sequencing far beyond this threshold. This is why the current approach to sequencing relies
massively redundant sequencing feeding complex algorithms that take data from many short reads and reassemble them into larger continuous segments based on overlaps. These short reads are characterized by the parameters listed above which this section will explore further.
1.4.1 Quality
The quality of a sequence of DNA is determined to be the likelihood that an errant base was reported in the sequencing process. In order to determine the performance of a sequencing instrument, many runs are conducted with samples of known sequence. Correct and errant sequence is then equated to particular signal characteristics which are referenced in later runs and used to score new reads. The ABI 3730, for example, relies on laser excitation of fluorophores to generate a signal which is then detected with a CCD camera. Characteristics of the received signal such as intensity, duration, and
conformation to an expected wavelength are then used to score the individual base calls.
For the HGP a standard was created known as Phred20 which represented the minimum quality needed for a base to be submitted into NCBI. Phred20 equates to one error in every hundred bases reported. In order to improve on this error rate, sequencing projects rely on levels of coverage. In the HGP the typical base received lOX coverage, meaning the same base location was observed in at least 10 different reads.
A human's genome is a diploid meaning there are two sets of chromosomes (one
inherited from each parent) resulting in two different but correct sets of sequence for each person. In addition, genetic mutations, such as those seen in some cancers, can introduce additional sequence variation. As a result, it is necessary for sequencing technology to have the capacity to differentiate between an errant base and true genetic variation which has proven very difficult with current methods.
1.4.2 Complexity of Sample Preparation
The Phred20 standard is meant to report on errors arising strictly from the detection instrumentation itself, another source of error in DNA sequencing, however, is the sample preparation process. Prior to actually being loaded onto a sequencing instrument, the sample of interest undergoes any number of rigorous preparation steps, each of which may introduce errors into the sequence that may be reported as high quality bases later on. Processes such as clonal amplification, polymorphous chain reaction, rolling circle
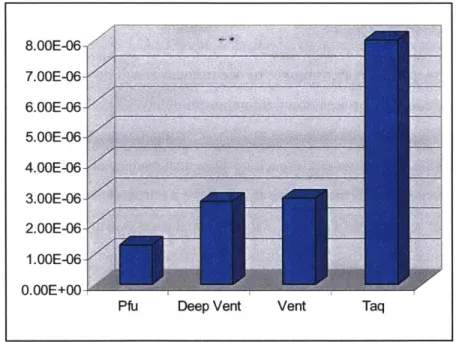
amplification, and the Sanger sequencing reaction, generate many copies of the target sequence and each have error rates associated with them. While these error rates are typically very low (see Figure 6), the prep may utilize multiple amplification steps that are exponential in nature and involve hundreds of thousands of molecules, meaning any error can propagate and amplify, possibly rendering it indistinguishable from actual genetic variation.
Figure 6 - Average Error Rates of Thermostable DNA Polymerase During PCR
The error rates in this chart were calculated using the equation ER = mf (bpxd), where mf is the mutation frequency, bp is the number of detectable sites, and d is the number of template doublings'0
10Cline, J., et al. PCR Fidelity of Pfu DNA Polymerase and other Thermostable DNA Polymerases.
Nucleic Acids Research, Vol. 24(18): 3547, 1996
8.OOE-06 7.OOE-06 6.OOE-06 5.OOE-06 4.QOE-06 3.OOE-06 2.OOE-06 1.OOE-06 O.OOE+00
There are other less quantifiable errors that can be attributed to the level of complexity inherent in sample prep. Many of these can be reduced through automation and
refinement, but the most effective way to eliminate errors is through simplification of the process. In addition to limiting errors, a streamlined process speeds up the learning curve for potential customers making it a much easier sell. The total amount of amplification steps along with the total time to prep one sample will be used in this technology assessment as a proxy for a complexity measurement. The standard Sanger sequencing process consists of 3 amplification steps that occur over a 33 hour time span.
1.4.3 Read Length
As mentioned earlier, the most advanced sequencing methods to date rely on read lengths that are on the order of 800 bases that are assembled together based on overlapping sequence to form larger segments or contigs. Read length is a very important characteristic of sequencing data because it translates directly into the ability to
accurately assemble a read. DNA is a basically a quaternary system with the number of unique sequences possible for a given length X equal to 4x. Consequently, the shorter the length of a read, the greater number of occurrences it will have in a genome. The human genome could be broken down into approximately 300 billion 10 base sequences and there are only about 1 million unique 10 base sequences possible. Thus, one would expect to find -3000 occurrences of each of these sequences making it difficult to
determine exactly where in the genome it may have a particular read may have originated from. This is an oversimplification of the problem, however, since it is well known that there are sequence biases that further limit the number of sequence variations for any read length that actually occur.
In their 2005 Nuclei Acids Research paper 'An Analysis of the Feasibility of Short Read Resequencing', Whiteford et al. investigated the utility of short read lengths based on their ability to accurately reassemble them onto a reference sequence. Figure 7(a) shows the percentage of the Human Genome that can be uniquely characterized by reads of a given read length. The authors argue that an approach that relied on read lengths of at least 43 base pairs could only hope to uniquely characterize -90% of the genome. Figure
8 (a) and (b) shows the same analysis for the much smaller genomes of X-phage and E.Coli K12. In both of these cases, read lengths of 15 base pairs is adequate to account for over 95% of the genome.
25 50 75 Read length / (nt) 100 125 100 75 50 25 0 25 50 75 Read length ! (nt)
Figure 7 - Unique Sequence for Varying Read Length in the Human Genome
On the right is the percentage of unique sequence in the Human Genome for given read lengths and on the right is the percentage of Chromosome 1 covered by contigs greater than a threshold length as a function of read length'" 100 75 50 25 0 10 15 Read Length I (nt) 100 75 50 25 0 20 5 10 15 Read Length I (nt)
Figure 8 - Unique Sequence for Varying Read Length in X-phage and E.Coli K12 The percentage of unique sequence in the X-phage(a) and E.Coli K12 (b) genomes for given read lengths
" Whiteford, N., Haslam, N., Weber, G., Prugel-Bennett, A., Essex, J., Roach, P., Bradley, M., Nelyon, C. An Analysis of the Feasibility of Short Read Resequencing. Nucleic Acides Research, 33(19) p.3, 2005.
12 Whiteford, N., Haslam, N., Weber, G., Prugel-Bennett, A., Essex, J., Roach, P., Bradley, M., Nelyon, C.
An Analysis of the Feasibility of Short Read Resequencing. Nucleic Acides Research, 33(19) p.4, 2005. 100 *(b) .100 - 500 1000 4000 10000 .... .. ................. -0 2 75 50 25 (a) - -- -- -I " " ' " " " " ' " .. . .. . . .. .. I. . . 0 100 125 (a) a: (b) - -- -20
This study puts the importance of read length into perspective. With the available human genome template, the authors argue that 'whole genome resequencing will be limited with current technology' but that 'partitioning the problem, by focusing on single chromosomes or by neglecting the more difficult and repetitive parts of the genome, makes the problem more tractable'".
Much effort has been devoted in the development of new sequencing technologies to extend the read length as far as possible. The greatest limitation for many of the next generation efforts is the fact that the detection method is serial and noise is introduced with each successive base measurement making each additional base in the read more difficult than the one before it and severely limiting the opportunity for substantial improvement. One way some technologies have sought to extend their read length is through the use of paired ends. Paired Ends refers to the ability to sequence both ends of a continuous stretch of DNA of known length. If you knew the approximate length of a strand of DNA, two 25 base pair reads from its ends, is essentially one 50 base pair read for the assembly algorithm.
It is obvious that read length will play a major role when determining the utility of new sequencing efforts, but it is not yet obvious what the optimal read length will be for the different applications. With more reference sequence to rely on every day and more complex analysis algorithms being employed on more powerful computing hardware, it is probable that the theoretical required read lengths will continue to shrink. The simple fact remains, however, that longer read lengths are better.
1.4.4 Throughput
The throughput of a sequencing technology is often what is advertised, although it can be difficult to determine exactly what is being referenced. For the purposes of this analysis, throughput will consist of both the time and cost components of an associated technology.
13 Whiteford, N., Haslam, N., Weber, G., Prugel-Bennett, A., Essex, J., Roach, P., Bradley, M., Nelyon, C.
In order to establish a metrics for comparison, some simplification will be required. Consider a representative sequencing process as characterized by Figure 9.
I Consumables I (Reagents,
labware), Labor, Capital Investment
Acquisition Sample Prep -- Sequencing -* Processing Bases/$IHour
Figure 9 - Typical Sequencing Process
The inputs to this process, aside from the actual sample, are the consumables, such as proprietary reagents and labware (sample plates, pipettes, etc.), labor, and an upfront capital investment in the sequencing detection instrumentation. Assuming that the cost of the instrumentation will amortize over the course of many sequencing runs, this
component can be ignored, leaving consumables and labor as the primary determinants of cost. The output of a sequencing process is bases of DNA.
For the ABI 3730, it costs approximately $0.001 per base of sequence in labor and consumable costs. As mentioned earlier, it takes approximately 33 hours to prepare a sample and another 1.1 hours to run a sample on the detector with each run yielding around 80,000 bases of sequence. Since all sample prep can be highly parallelized, the time associated with this portion of the process can be ignored and throughput can be calculated based on a constant feed to the detector; this translates into a throughput of 73,000 bases/hour at a cost of $73. This means you could sequence the human genome once over in 41,000 hours (-5 years) for a cost of $3 million with a single ABI
1.4.5 The Nature of the Data
Fast, inexpensive computational power has enabled researchers to extract meaningful information more efficiently from ever growing data sets. This trend has contributed significantly to the DNA sequencing efforts. Complex signal processing combined with even more complex statistical analysis, has opened the doorway to high throughput detection technologies that can afford to measure significant amounts of spurious data without impacting their ability to generate an even greater amount of meaningful information. This reliance on back end processing is not without it pitfalls, however. Time and effort spent weeding out the noise in the data is time and effort sacrificed elsewhere. Even if the analysis step is fully automated, the storage requirements and transmission rates for the data generated can pose a formidable challenge to a typical research lab. Also, while complex statistical algorithms may help extend the usefulness of short read lengths (as discussed previously) they can only go so far before they begin to impact the reported quality of the reads. It is for these reasons that it is important to keep in mind what type of data is being generated and how much post processing is involved with a particular sequencing technology when assessing its utility.
1.5 New Entrant Opportunity
Although dramatic improvements have occurred in the rate and quality of DNA sequencing over the last decade, large projects are still primarily relegated to the large genome centers by virtue of their infrastructure and specialized knowledge. Following the completion of the HGP, many new specialized sequencing applications emerged for
which traditional Sanger sequencing was clearly not ideal. The ability to quickly and
inexpensively generate smaller sets of sequence information for many individuals promised an instant market for whoever could invent it first. In an effort to further spur on the development of new technologies, the NHGRI awarded a number of sequencing grants:
NHGRI's near-term goal is to lower the cost of sequencing a mammalian-sized genome to $100,000, which would enable researchers to sequence the genomes of hundreds or even thousands ofpeople as part of studies to
Ultimately, NHGRI's vision is to cut the cost of whole-genome sequencing to
$1, 000 or less, which would enable the sequencing of individual genomes as
part of medical care. The ability to sequence each person's genome
cost-effectively could give rise to more individualized strategies for diagnosing,
treating and preventing disease. Such information could enable doctors to
tailor therapies to each person's unique genetic profile.'4
The NHGRI awarded three rounds of grants in 2004, 2005, and 2006 to 30 different
researchers and companies totaling over $83 million (a list of awardees can be found in Appendix B). This was followed in 2006 by calls for applicants for the XPrize award for
genomics that would award $10 million to the effort which could:
develop radically new technology that will dramatically reduce the time and cost of sequencing genomes, and accelerate a new era ofpredictive and personalized medicine. The X PRIZE Foundation aims to enable the
development of low-cost diagnostic sequencing of human genomes.15
With the promise guaranteed market and the fanfare created by such publicized funding opportunities, it is easy to understand the allure of this market for both technology developers and potential investors.
1.6 New Applications
Inherent in the definition of the Next Generation Sequencing Technologies is the ability to extend the utility of sequence information through new applications. Gene expression analysis, mutation detection, copy number variation, genotyping, and targeted
resequencing are just some of the new areas that being explored.
1.6.1 Gene Expression
Gene expression profiling has been an important tool in biological research for some time. Just knowing a person's genetic makeup does not tell the whole story. The specific genes and the rate at which they are translated depend on a number of factors that are difficult to measure. One method that has been employed successfully to determine quantitatively, which genes are active, has been to rely on the levels of mRNA (an intermediary in the
14 NIGRI press release: NHGRI Seeks Next Generation of Sequencing Technologies. October 14, 2004.
gene expression cascade) in a cell. A technology that could improve upon current performance of this measurement would be an instant success.
Currently companies such as Illumina and Affymetrix market proprietary technology for conducting gene expression analysis. As Figure 10 shows, both of these companies experienced revenue growth between 2001 and 2005 that would be attractive to any new entrant.
Gene Expression Profiling Revenue
400 350-- 300--250 3 Illumina ($M) 200 o Affymetrx ($M) 150 100-50 0--2001 2002 2003 2004 2005
Figure 10 - Iliumina and Affymetrix Revenue 2001-200516
1.6.2 Genomic Variation
Initially Single Nucleotide Polymorphisms (SNPs) were thought to comprise the majority of interspecies genomic variation. This led to the formation of the International Hap Map Consortium, which sought to decipher a roadmap of SNPs that could be used as a
shortcut to determine underlying structural variation in the genome which could highlight evolutionary change as well as identify possible disease markers. In 2006, however, a 16 From Illumina, Affymetrix Annual Reports 2002-2006
paper by Feuk et al. reviewed recent research resulting from genome-scanning
technologies which revealed that deletions, duplications and large scale copy number variants (CNVs), insertions, inversions, and translocations are all present in the genome at levels that far exceed the number of SNPs. Later in 2006, Redon et al. estimated that the level of CNVs within the genome was somewhere on the order of 12%, showing that the initial estimates of 99.9% person to person identity was a gross overestimate7.
The implication of the high level of genomic variation is that simple SNP measurement assays will most likely not provide an adequate detection method. In addition, most of the genome scanning technologies being utilized cannot provide a complete assessment of genomic variation. As seen in Figure 11, only the highly inefficient 'Southern
Blotting' and 'Sequence-assembly comparison' methods can hope to capture information on all types of variation.
Genome-wide scans
Clone-based array-CGH No No Yes (>50 kb No No
SNP array No No Yes Yes Yes MPs
Clonepaired-end sequencing Yes Yes (breakpoints) Yes(>8 kb of Yes(>8kb of No
(fosmnid) detetkxn) deletions; <40 kb of
insertions)
A 7
k
Microsatelifte genotyping NO NO Yes(detetions) Yes (deletions) Yes
MLPA No NO Yes Yes Yes
Real-timne qPCR No No Yes Yes Yes
Souhern otig Ys Yes Yes YeYs
Detection limits are shown in parentheses where applicable. The emphasis is on those approaches that are used for the detection of submicroscopic variants, although karyotyping is also shown. For comparison, each technology's ability to detect smaller sequence variants (<1 kb) is also shown. CGH, comparative genome
hybridization; CNV, copy-number variant; FISH, fluorescence In situ hybridization (including metaphase, interphase and fibre FISH); indel, insertion or deletion;
LCV, large-scale CNV; MAPH, multiplex ampliflabte probe hybridization; MLPA, multiplex igation-dependent probe amplification; QMPSF quantitative multiplex
PCR of short fluorescent fragments; qPCR, quantitative PCR.
Figure 11 -Methods for Detecting Structural Variants in the Human Genomes
'7 Redon, R., et al Global Variation in Copy Number in the Human Genome. Nature, 444 p.444, Nov. 2006. 18
Feuk, L., Carson, A., Scherer, S. Structural Variation in the Human Genome. Nature Reviews Genetics, 7 p.88, Feb. 2006.
Once again it is obvious that a sequencing method that could provide the same information as the existing technologies listed in Figure 11, in a more cost and time efficient manner, would have no problem conquering the market. Whether or not the Next Generation Sequencing Technologies can meet the required specifications will be an important determinant in their possible success.
1.7 Examples of Next Generation Sequencing Technology (NGST) Companies While there are many researchers pursuing new sequencing technologies, a handful of companies have taken an early lead in establishing themselves as the next big
advancement. This section will briefly highlight four of these efforts: 454 Life Sciences; Solexa Inc.; Agencourt Personal Genomics; and Helicos Biosciences Corp. A timeline of some of the major events in the evolution of these companies is shown in Figure 12. Combined, these companies offer tremendous insight into the sequencing market. The experiences of these companies and the dimensions along which they have chosen to innovate and compete, is the basis for the analysis in Chapter 2 and the survey detailed in Chapter 3. In other words, the best way to determine the important aspects of this market is through the observation of those who are attempting to enter it. It is important to note both the similarities and differences in the expected specifications for each of these technologies.
It is interesting that in addition to the companies explored here, there are a set of efforts looking at even more radical sequencing solutions. While those closest to market seek to make the $100,000 genome reality, the $1000 is being actively pursued by those
employing completely different technologies such as Nanopores and Force Spectroscopy (see Appendix B).
1.7.1 454 Life Sciences
Started in June of 2000, 454 Life Sciences was the first company to bring a product to market, installing their first unit in April of 2005. Relying on a miniaturized
Pyrosequencing platform combined with emulsion PCR (as outlined in Appendix C) 454
500,000 100 base pair reads in 4 hours with a Phred20 quality19. While this represented a considerable increase in raw throughput over the 3730, the technology was not well suited for some applications due to a difficulty sequencing long sequence repeats. 454 is currently a wholly owned subsidiary of Curagen Corporation and has an exclusive distribution agreement with Roche
1.7.2 Solexa Inc.
Solexa Inc. is the oldest of the companies that will be discussed and has undergone considerable change in its lifetime. Following its acquisition of Lynx Therapeutics Inc. in early 2005, Solexa emerged as one of the front runners in this market. Solexa shipped its first instruments to customers in July of 2006 with published specifications of 1 billion bases per run broken into 25 base lengths with a pass rate of 90% delivered in a 3 day run. This process relies on a bridge PCR step followed by extension sequencing with
reversible terminators (see Appendix C for more details). Solexa was acquired by Illumina Inc. in November of 2006.
1.7.3 Agencourt Personal Genomics
Agencourt Personal Genomics was a spin-off of Agencourt Bioscience following its acquisition by Beckman Coultier. APG was then acquired by ABI in May of 2005. APG technology is a variation on sequencing by ligation which was initially licensed from George Church's lab at Harvard. Appendix C explains the Polony technology employed at the Church lab. Like the Polony approach APG's technology relies on emulsion PCR and sequencing by ligation, and hopes to achieve ~25 base pair reads on a chip yielding I billion bases in a 3 day run.
1.7.4 Helicos Biosciences Corp.
Helicos Biosciences Corp. is the only one in this group that claims to be true 'single molecule sequencing'. This is due to the fact that there is no initial PCR step prior to sequencing, which is accomplished via extension sequencing with reversible terminators
19 Margulies, M., et al. Genome Sequencing in Microfabricated High-Density Picolitre Reactors. Nature, Vol.437:378, September 2005.
(see Appendix C for more details). Helicos' instrument, due for a 2007 release, promises 1 billion bases of high quality sequence per day.
309$81.6M/4.5y rs 11/10M3 S163/3yrs "
awred for HGP scale- awarded to Broad, r.Aaddt
p oWitehead, Baylor, Baylor, Wash U, Bod ahU n
aRnd Wash U Agencoudt, and TIGR Baylor
WA3M3 Agencourt 111/14A4A ncu 8 5 Agencourt 5/31/06 ABI
5/102 3730 awarde d $118,000 by Awarded $5.4Myrs Awar d ed $2/yrs buys APG (or
Introduced NI H for pol ony NGS grant NGS grant $120M
6/1/9 0u37 /1 geco sequencing
Int r:dudo d 7/1 Agsencor 4/27185 Agencourt
Bfosune 1/7M3 George Church Biosciences bought
publishes 'Flourescent by Beckman
-In Situ Sequencing on Agencourt Personal
Polymerase Colonies' Genomics spun off
11/75 Commecia 74%Pubishes on a
64M Etablshedas 81843$20M11/14M04 55.M/3rs 7 26 e R tenve launch of Genome 5agr/44 hybrid
66% owned Subir raised from NGS grant sn euncr2seunn aprch
190-5196197198119991200012001J 2002 1 2003 1 2004 1 2005 t* Q CS 0 19 2006
3/10105 Announces 9/2M5 Publishes 5/1846 Files 11/1396 Acquired by
12 1 ures] successful 'Elucidation of the $100M Shelf Illumina for $600M
$quit fingt sequencing of Phi- Small RNA Registration I
equity funding X 174 genome Component of the 19/1416 Sequencing
Transcriptome of X chromosone with
Sanger Institute
3/7415 Merges 7/12/95 Secures 7/t116 Early
with Lynx $32.5M in private acces 4n1trumenl
Therapeutics equity funding sinpped
Chapter 2: Conceptual Perspectives on Market Evolution
The development and maturation of new technology markets has been examined from many different theoretical perspectives, all of which offer some insight into the
underlying mechanisms dictating this evolution. The following sections will explore a handful of these theories that provide an insightful description of the Next Generation Sequencing Market.
2.1 Technology Push vs. Market Pull
There have been many studies arguing the prevalence of either 'Technology Push' or 'Market Pull' as the primary determinant of industry evolution. 'Technology Push' is the concept that industry is driven by new technological invention and discovery20. 'Market Pull', on the other hand argues that underlying unmet market needs determine how industries change and which endeavors are ultimately successful21. The fact that there is support for both sides reinforces the view that it is most likely a combination of these forces and their interplay driving any new market. The degree of this interplay is determined by many factors, internal and external, including maturity of the industry, level of competition, and intensity of demand. Knowing which force is the primary driver of a market (aware that this can and does change over time) is an important step in being able to assess the achievements of the participants.
2.2 Level of Disruption
The concept of disruptive technology is an apt description of most emerging technology
markets. As defined by Christensen in The Innovator's Dilemma, disruptive technologies
are those which:
... bring to market a very different value proposition than had been available previously. Generally disruptive technologies underperform established products in mainstream markets. But they have other features that afew fringe (and generally 20 Chidamber, S. R., Kon, H. B. A Research Retrospective of Innovation Inception and Success: The
Technology-Push Demand-Pull Question. International Journal of Technology Management, 9(1), 1994.
21 Chidamber, S. R., Kon, H. B. A Research Retrospective of Innovation Inception and Success: The
new) customers value. Products that are based on disruptive technologies are typically cheaper, simpler, smaller, and, frequently, more convenient to use2 2
.
Christensen also argues that 'markets that do not exist cannot be analyzed' referring to the inability of established companies to predict and prepare for the impact of a disruptive technology.
Figure 13 outlines the evolution of disruptive technologies with reference to the
established product. As the chart indicates, not all 'invading technologies' are successful in their attempts to overtake the current market leader. The ability to accurately assign such a development curve to a new technology company would be an invaluable tool in
predicting that company's ultimate level of success in the market.
Invading Technologies Prodact Perfe EGmce Established 1 Product Tim To T, T
Figure 13 -Christensen's View on Disruptive Technology
One way to define a company's development curve is suggested by Utterback in
Mastering the Dynamics of Innovation . Figure 14 illustrates the two types of
innovation proposed for a new technology company. Initially there is a high level of product innovation as the technology is altered and refined in an attempt to address a range of applications. This is followed by a period of process innovation, where
22 Christensen, C. The Innovator's Dilemma. HarperCollins, New York, NY 2003. p.xviii
2
3 Utterback, J. Mastering the Dynamics of Innovation. Harvard Business School Press. Boston, MA 1996. p. 91
production costs are reduced in response to a reduction in the need to support a high degree of product variation. The combined area under the two of these curves can be interpreted in order to generate the product performance S curves seen in Figure 13. Therefore, determining the ongoing level of product innovation can lead to a prediction of the shape of a company's S curve and its advancement along it. This can be reflected in forward looking statements by the company concerning planned technology
improvements and the degree to which a company is focused on particular markets as mentioned earlier.
ProducP innovation
Fluid phase Trn-sitional SpeCific phae
ph2se
Figure 14 - Utterback's Phase Diagram for New Companies24
2.3 Dominant Design
As a market evolves the natural progression is towards what is known as a dominant design environment. As identified by Tushman and Anderson, a dominant design results when 'a technological breakthrough, or discontinuity, initiates an era of intense technical variation and selection'25. A dominant design typically represents the optimal solution
available to meet the identified market needs. Inherent in this definition is the fact the dominant design is not necessarily the most technologically advanced solution, but rather
24
Utterback, J. Mastering the Dynamics of Innovation. Harvard Business School Press. Boston, MA 1996.
.91
Tushman, M. L., Anderson, P. Technological Discontinuities and Dominant Designs: A Cyclical Model
the one that addresses the financial and accessibility demands of the consumers while delivering the necessary technological performance. As defined by James Utterback in Mastering the Dynamics of Innovation, a dominant design:
... is the one that wins the allegiance of the marketplace, the one that
competitors and innovators must adhere to if they hope to command
signficant market following. The dominant design usually takes the form of a new product (or set offeatures) synthesized from individual technological
innovations introduced independently in prior product variants.2 6
Once established, a dominant design is subject to competition from other copycat technologies that seek to capitalize on the market standardization. The degree to which the different competitive technologies in a given market vary is a good indication of how far along the path to a dominant design it is.
2.4 Intellectual Property
In all technology industries, intellectual property plays an integral role in enabling a company to succeed. A company needs to innovate and to support its innovation with a foundation of solid IP in addition to providing the resources to defend it. At the same time, a company must have extensive knowledge of the existing IP in its market space in order to avoid wasting time developing technology it can never own and possibly falling victim to costly lawsuits brought by its competitors. In his work 'Competition,
Cooperation, and Innovation', Teece addresses the problems of both too little and overaggressive IP strategies. As he explains, one major market failure involves the inability of firms to prevent other firms from incorporating their technology resulting in a 'free rider' environment. Even when direct imitation is prevented, he adds, 'there is likely to be a technological neighborhood illuminated by the innovation that is not foreclosed by the patent'27. How to measure the strength of IP is a different matter. Lacking litigation as a reference for the strength of a company's IP, the size of the portfolio and the importance allotted it are good indicators.
26 Utterback, J. Mastering the Dynamics of Innovation. Harvard Business School Press. Boston, MA 1996.
p. 24
27 Teece, D. J. Competition, Cooperation, and Innovation: Organizational Arrangements for Regimes of
2.5 Synthesis
The topics discussed in the previous section were meant to provide an evaluation
framework in order to help provide a clearer picture of how this new technology market may evolve. First it is necessary to discuss how each of these topics relates specifically to the NGST market.
While it is difficult to determine the degree to which a company is being driven by the force of market pull, it is possible to gage the amount of application focus a company exhibits. This, in turn, can be viewed as a reflection of market influence. For the Next Generation Sequencing companies, this is a function of the potential applications that were highlighted in section 1.6. All of the applications discussed are potentially very lucrative, but they also require a significant amount of work to develop. The implied trade off here is to focus on a particular application in order to secure that customer base in favor of pursuing a larger customer base by addressing many applications with less effectiveness.
When the NGST market is evaluated with respect to the traditional de novo sequencing application, the technology certainly seems to fit the definition of a 'disruptive
technology'. The shorter lengths and reduced quality of the reads generated by the NGSTs, would have rendered them highly inefficient if they were employed exclusively in the Human Genome Project. Also, while they seem to enjoy advantages in other parameters (200 fold increase in throughput and a 100 fold reduction in cost) described in
Section 1.4, as of yet, none of the NGST have managed to corner the market. As far as the inability to analyze a disruptive market, the fact that the next big applications in Genomic sequencing have only generally been identified is merely an indication of the relative maturity of this market. For this market Figure 13 can be used to map the progress of these new technologies to the established ABI technology.
Regarding the concept of dominant design, all of the companies described earlier share a high degree of similarity. All rely on a massively parallel approach to sequencing with
reduced read length. This fact seems to suggest that the market is more or less
converging on a technology standard for the next generation in DNA sequencing. But as mentioned earlier, there are many efforts underway that rely on an entirely different approach to sequencing which represent an entirely different tier of development. Determining which dominant design appears to be relevant to a given technology will play a role in determining how to differentiate these different tiers of development.
The NGST market is currently full of competitors all vying for the same customers. The fact that they are all relying on a scientifically similar approach (see Appendix C) in order to address the customers' needs is certain to result in some overlapping technology. It is likely that once the handful of competitors mentioned earlier all have instruments on the market, some IP infringement suits will follow. This conclusion is based on the history of this market (ABI has been involved in numerous IP infringement lawsuits) and recent occurrences (ABI has recently sued Solexa over patents relating to SBL which threaten their technology acquired with APG). When this happens it will be the company with the deepest pockets and largest IP portfolio that will win out, assuming there is no
dramatic advantage to any of the different technologies.
Based on the above observations, it is possible to postulate some measurements of success for this market. The four dimensions that can be extracted are: Degree of Market Focus; Phase of Development; Degree of Differentiation from Competition; and Strength of IP. Figure 15 is meant to show an overview of how these dimensions interact.
Illustrated in the figure is how, as a technology development effort evolves, its
application pool shrinks, or to put it another way, its Degree of Market Focus is enhanced as the developers identify and focus on the most promising applications. Also
represented, though not explicitly, in this figure is the Development Phase which is the relationship between the forces of market pull and technology push. As the technology migrates toward a dominant design, the strength of Market Pull increases representing Utterback's transition from the 'Fluid' to the 'Transitional' and finally the 'Specific Phase'.
Application Pool
0
*Invention
SIPAcquisition
(M&A, Patent
Expiration, Etc.)
-Collaboration
/
Market Maturation*Competition
*Availability of
Funding
-Investor
Influence
Dominant Design
Figure 15 -New Market EvolutionThe influence of the 'Strength of IP' dimension can be seen in Figure 15 through the diminishing influence of Technology Push. This represents the fact that as the market moves toward the dominant design, there is much less room to innovate due to the impediment of competitive IP. Finally the 'Degree of Differentiation' dimension is represented when Figure 15 is interpreted not as representative of a particular effort, but as an overview of the entire market. As the market as a whole migrates towards the Dominant Design, the Degree of Differentiation for all of the competitors is reduced (implied here is the fact that, for each application, a different dominant design may surface).
With this view of the market in mind, a survey was constructed in order to gather
information from the participants in the NGST market. The primary goal of the survey is to test whether or not these dimensions can be used to provide an accurate gage of the markets relative maturity and future prospects. If this is the case, these dimensions can then be used in order to track the progress of competitors in this market and as a template for the analysis of future new biotechnology markets.
Chapter 3: Survey
3.1 Survey Methodology
The purpose of this survey is to gather information from a range of participants in the NGST market in order to gain a deeper understanding of their motivation and what they
view as their primary challenges. The survey was distributed to individuals associated with both private and academic technologies, as well as to institutional financiers. By surveying participants with a range of backgrounds, the intent is to shed light on the technology drivers at different points in the evolution of the efforts in question. A list of survey candidates was generated from a combination of a search of leading companies in the commercial sequencing market and the awardees list of the NIH 'Next Generation Sequencing Technology' grants. The mechanism for identifying the leading companies was a search of press releases and recent conference participation. The major criteria necessary for a firm or lab to be included was that the investigator or company in question had to claim a goal of sequencing all or part of a human genome at a significantly reduced cost from today's benchmark of ~$ 1 OM.
3.2 Survey Design
The survey is included in Appendix D. It is divided in four sections: Background; Market Overview; Technology; Intellectual Property; and Funding. The 'Background' section serves to identify the responder's role, affiliation, and historical involvement. This was important for grouping responses in order to determine how the different participant categories view this market. The 'Market Overview' section explores what the respondents consider to be the primary market opportunities for their technology and what effect their technology will have on the established market. It is comprised of five
questions including the following:
* What effect did the following factors have on the decision to develop your technology?
o Faith in the superiority of the technology o Market opportunity
o Availability of Funding o IP Availability
" How do you rank the following potential markets for your technology? o De Novo sequencing
o Resequencing o Mutation detection
o Copy number identification o Genotyping
o Expression analysis
" How do you rank the following potential customers? o Pharma (Biopharma) companies
o Diagnostic companies o Academic labs o Government labs
" How would you describe your relationship to these existing technologies? o ABI 3730
o Affymetrix Genechip o Illumina Bead Array o Luminex xMap
The 'Technology' section is meant to gather information on what the novel aspects of the respondents' technologies are and what their targeted performance specifications look like. This section has four questions total with the most critical being:
* To the best of your knowledge, please rank the amount of effort devoted to each of the listed components in order to develop your technology.
0 Core biology (custom enzymes, dyes, etc.)
o Assay design (component scaling, cycling optimization, etc.) O Mechanical integration (fluidics, optics, etc.)
O Image analysis software o Read quality analysis software
The questions under 'Intellectual Property' relate to how the respondents value their intellectual property and how IP in general has dictated their development effort. These issues are examined with six questions including:
" What do you consider the primary benefits of your IP? o Freedom to operate (no blocking IP)
o Protection from competition/imitation
o Leverage for bargaining with potential partners/buyers o Cross licensing opportunities
o Credibility for funding
" Have you had to alter your design at all in order to avoid potential IP conflicts?
" If you had access to all of the IP available in this market (including that of your competitors) do you believe you could use this to improve your product?
o Yes, absolutely
o Maybe, I am not familiar enough with the available technologies o Not likely
Finally the 'Funding' section serves to gather information on the degree of public funding each respondent is receiving.
The survey was sent to 45 candidates comprised of both companies and researchers. The initial response of 4 was increased to 7 with a follow-up round.
3.3 Data Analysis
While the response to the survey was not overwhelming the data gathered did provide a interesting insight regarding the Market. With a sampling of four company and three academic responses the data does include responses from both of the primary participant groups in this market. Due to the sensitive nature of some of the questions on the survey, not all respondents answered the survey in its entirety. As a result, the following analysis