The Bricks, Clicks, Economics and Mortar of Contemporary Retail:
The Consequences that Retailer Storing Strategies and Retail Performance across Markets have on Real Estate Investments
by
Kevin William Fagan
B.S., Architectural Engineering, 2001 University of Texas at Austin
Submitted to the Program in Real Estate Development in Conjunction with the Center for Real Estate in Partial Fulfillment of the Requirements for the Degree of
MASTER OF SCIENCE IN REAL ESTATE DEVELOPMENT at the
MASSACHUSETTS INSTITUTE OF TECHNOLOGY
FEBRUARY, 2011
©2011Kevin William Fagan All rights reserved
The author hereby grants to MIT permission to reproduce and to distribute publicly paper and electronic copies of this thesis document in whole or in part in any medium now known or
hereafter created.
Signature of Author____________________________________________________________
Center for Real Estate January 10, 2011
Certified by___________________________________________________________________
William C. Wheaton, Ph.D. Professor of Economics,
M.I.T. Department of Economics Thesis Supervisor
Accepted by___________________________________________________________________
David Geltner, Ph.D.
Chairman, Interdepartmental Degree Program in Real Estate Development
The Bricks, Clicks, Economics and Mortar of Contemporary Retail 3
The Bricks, Clicks, Economics and Mortar of Contemporary Retail:
The Consequences that Retailer Storing Strategies and Retail Performance Across Markets have on Real Estate Investments
by
Kevin William Fagan
Submitted to the Program in Real Estate Development in Conjunction with the Center for Real Estate on January 10, 2011 in Partial Fulfillment of the Requirements for the
Degree of Master of Science in Real Estate Development
ABSTRACT
The retail industry in the 21st century is undergoing a confluence of transformative changes. In this paper we discuss particularly noteworthy changes related to demography, retail economics and the Internet. We note how, in reaction to those transformations, brick-and-mortar retailers have developed innovative strategies to maintain growth and store performance, such as urban market penetration and multi-channel selling. We also have done a rigorous analysis of retail performance across major U.S. markets to determine the ex post and ex ante effects of trends and strategy changes. The hypothesis of this paper is that the conventional definition of “good” retail real estate has substantially changed in the last decade.
The analytic approach of this paper is to: 1) observe broad retail industry trends, 2) conduct industry interviews to identify corresponding retailer strategy shifts, 3) perform cross-metro analysis of retail performance and 4) extrapolate meaningful effects on retail real estate. This provides owners, operators and developers of retail properties insight into the evolving characteristics and needs of tenants as they adapt to the new retail environment.
Conclusions include description of the attributes of markets, properties, tenant mixes and amenities that best support contemporary retailing. Commentary and analysis is also provided on the impact of e-commerce and bricks-and-mortar retailers’ adoption of multi-channel selling.
Some results are that larger, denser markets have less consumption per capita, but those markets are generally underserved and have greater store gross revenues. Retailers are motivated to enter urban markets with flexible prototypes and online platforms. Population growth serves as a wealth proxy and corresponds strongly with sales growth. Housing prices are positively correlated to retail sales. Income growth has a much stronger relationship to sales performance than static income levels. Ethnicities and incomes are sorted and stratified in dense markets, making performance forecasting more nuanced. Relatively higher Internet usage in a metro corresponds to significantly higher brick-and-mortar retail sales.
Thesis Supervisor: William C. Wheaton Title: Professor of Economics
The Bricks, Clicks, Economics and Mortar of Contemporary Retail 5 TABLE OF CONTENTS Abstract ... 3 Table of Contents ... 5 Table of Figures... 7 Acknowlegements ... 8 Chapter 1: Introduction ... 9 1.1 Research Motivation ... 9 1.2 Background ... 9 1.3 Methodology ... 12 1.4 Summary Conclusions ... 12 1.5 Thesis Structure ... 14
Chapter 2: Methodology and Data ... 15
2.1 Introduction ... 15
2.2 Observe Broad Industry Trends ... 15
2.3 Conduct Industry Interviews ... 16
2.4 Perform Cross-Metro Analysis of Retail Data ... 16
2.5 Extrapolate Consequences to Real Estate ... 21
Chapter 3: Retail Strategies – Industry Trends and Interviews ... 22
3.1 General Changes in the Retail Industry ... 22
3.1.1 Long-term Consumer Trends ... 23
3.1.2 Long-term Retail Business Trends ... 29
3.2 Shopping Center Trends ... 32
3.3 The Urban Shift in Retail ... 36
3.3.1 Brief Background of Contemporary Urbanization ... 36
3.3.2 Urban Strategies in Retail ... 38
3.4 E-commerce and Multi-channel Retailing ... 41
3.5 Industry Interviews ... 47
3.6 Chapter Summary ... 77
Chapter 4: Retail Economics – Performance Across Markets ... 78
4.1 Introduction ... 78
4.2 Results Presentation Format ... 79
4.3 Role of Income Elasticity ... 82
4.3.1 Sales per Capita (S/P) ... 82
The Bricks, Clicks, Economics and Mortar of Contemporary Retail 6
4.4 Role of Employment Elasticity ... 84
4.4.1 Sales per Capita (S/P) ... 85
4.4.2 Expected Sales per Store (S/St) ... 85
4.5 Role of Scale ... 87
4.5.1 Sales per Capita (S/P) ... 87
4.5.2 Expected Sales per Store (S/St) ... 88
4.6 Role of Central City Density ... 90
4.6.1 Sales per Capita (S/P) ... 90
4.7 Role of Housing Prices ... 92
4.7.1 Sales per Capita (S/P) ... 92
4.7.2 Expected Sales per Store (S/St) ... 94
4.8 Role of Broadband Usage ... 95
4.8.1 Sales per Capita (S/P) ... 95
4.9 Chapter Summary ... 98
Chapter 5: Consequences to Real Esate ... 99
5.1 What Types of Markets and Properties ... 99
5.2 What Types of Retailers and Tenant Mix ... 101
5.3 What Types of Amenities ... 102
Chapter 6: Conclusion ... 104
Chapter 7: Topics for further study ... 105
Bibliography ... 107
Appendix A: Description and Source of Regression Datasets ... 111
Appendix B: Interview Templates ... 112
Appendix C: Results of Regression Analysis by Retail Category ... 113
Appendix D: ICSC 2009 Shopping Center Classifications ... 115
The Bricks, Clicks, Economics and Mortar of Contemporary Retail 7
TABLE OF FIGURES
Figure 1: Legend of Regression Model Variables and Datasets ... 17
Figure 2: NAICS Retail Categories ... 20
Figure 3: 2007 Rank of Core Business Sectors in the United States ... 22
Figure 4: US Population by Age as of May 2010 ... 24
Figure 5: Annual Percentage Change in U.S. Income and Retail Sales per Capita ... 25
Figure 6: U.S. Average Personal Savings Rate (% of Disposable Income) ... 26
Figure 7: Revolving Consumer Debt per Capita in 2010 Dollars ... 27
Figure 8: U.S. Household Mean and Median Incomes, 1970-2010 ... 28
Figure 9: Retail Bankruptcies, Mergers and Acquisitions, 2000-2008 ... 30
Figure 10: Retail Bankruptcies by Dollar Amount ($100M+) ... 31
Figure 11: U.S. Store Openings and Closings, 1993-2008 ... 32
Figure 12: Index of Income, Sales and Retail Square Footage per Capita (1970 = 100) ... 33
Figure 13: Share of Shopping Center Growth by Center Category, 1990-2010 ... 34
Figure 14: Index of Income, Sales and Retail Square Footage by Center Type ... 35
Figure 15: U.S. City Density Changes for 500k+ Population Cities, 1990-2005 ... 37
Figure 16: Examples of Flexible Prototypes ... 40
Figure 17: Historical Percent of Internet Users in the U.S. ... 42
Figure 18: Percent Population in Top Ten MSAs that Use Broadband at Home ... 43
Figure 19: E-commerce Total and Categorical Share of Retail Sales ... 44
Figure 20: List of Interview Participants and Firm Affiliations ... 48
Figure 21: Summary Statistics for Regression Model Datasets ... 79
Figure 22: Summary Results for Income per Capita Variable ... 82
Figure 23: Summary Results for Employment per Capita Variable ... 84
Figure 24: Summary Results for Population Variable ... 87
Figure 25: Summary Results for Central City Density Variable ... 90
Figure 26: Summary Results for Median Home Price Variable ... 92
Figure 27: Summary Results for Percent Broadband Use in Homes Variable ... 95
Figure 28: Description and Sources of Variables and Datasets for Regressions ... 111
Figure 29: Summary Regression Results by Retail Category (TOT, FURN, ELEC, BLDG, FOOD, HLTH) ... 113
Figure 30: Summary Regression Results by Retail Category (CLTH, BOOK, GENR, HOTL, RESTR) ... 114
Figure 31: ICSC Shopping Center Definitions ... 115
Figure 32: Vehicular Miles Traveled, 1970-2010 ... 116
The Bricks, Clicks, Economics and Mortar of Contemporary Retail 8
ACKNOWLEGEMENTS
This thesis was possible primarily due to a number of individuals and organizations that supported me in this endeavor. I extend sincere appreciation to my thesis advisor, Professor Bill Wheaton for his sharp mind and ability to see clearly through small mountains of data and focus on that which is important. Special thanks goes to the staff at ING Clarion, particularly David Lynn, Tim Wang, Bohdy Hedgcock and Chris Roscoe, for the providing support and access to data sources. I’d also like to thank Ai Kong for providing a basis for the cross-sectional approach taken in this thesis.
I thank the various retail and real estate investment firms that contributed input and interviews. Their generosity of time and willingness to provide expertise and opinions established a great deal of practical substance in this research.
I would also like to thank all of my friends, family, classmates and the MIT faculty and staff for making my graduate school experience productive and memorable. I especially thank Christina DiPierro for all the food, love and smiles. It would take another 100 pages to list the ways she helped me over the last year. Also, I offer special mention to Professor David Geltner, the most dedicated educator I’ve ever met.
Finally, I give very special thanks to my mom and dad, Linda and Joe Fagan, who are always there for me in one way or another.
The Bricks, Clicks, Economics and Mortar of Contemporary Retail 9
CHAPTER 1: INTRODUCTION
1.1 Research Motivation
The retail industry in the 21st century has experienced what some in the business have described a “sea change”. In this paper we discuss particularly noteworthy changes affecting the retail industry such as large demographic shifts, discretionary income trends, increased
competition and specialization of firms and centers, diminishing store growth opportunities in traditional type markets and the onset of the Internet era with widespread consumer access to high-speed broadband and retailers adopting online as a viable selling channel. We then examine how, in reaction to those transformations, brick-and-mortar retailers have developed innovative strategies to maintain growth and store performance, such as entry into urban markets and adoption of online selling channels. Finally, we explore the effects of these changes in a real estate context and describe the role they play in successful real estate investment strategy. This also gives owners, operators and developers of retail properties insight into the evolving
characteristics and needs of successful tenants as they adapt to the new retail environment. The hypothesis of this paper is that the conventional definition of “good” retail real estate has substantially changed in the last decade.
The approach of this paper is to identify significant shifts in retail strategies and trends and determine how they fit within empirical retail performance across major metropolitan statistical areas (MSAs). This determines some ex post and ex ante effects of those strategies and trends, and what economic attributes of cities will best support contemporary retailing. Finally, given the strong relationship between tenant and landlord in the retail sector, this
analysis is then used to answer fundamental questions about the consequences to retail real estate. 1.2 Background
Beginning roughly a decade before the Great Recession of 2008, there were indications that the relationship between consumers and brick-and-mortar retailers was in the process of considerable change. Industry competition increased while shoppers became more educated and demanding. In the 2000’s, bankruptcies of U.S. retail companies escalated, marked notably by the fall of major retailers such as Kmart, Linens ‘n Things and Circuit City. Nationally, the gap between store closings and store openings consistently widened over the last 15 years.
The Bricks, Clicks, Economics and Mortar of Contemporary Retail 10
Part of this competitive pressure stems from scarcity of viable land for store expansion due to overdevelopment of particular types of shopping centers. At least thirty years of rapid suburban growth caused rampant, sometimes speculative development of generic large format stores in regional and power centers to the point of market saturation.
Suburban market saturation of power centers was accompanied by the rise of the
“category killer” retailers. These are large national retail chains that focus on a particular retail category, using economies of scale for competitive advantage in pricing and branding. This drove significant industry consolidation, and ultimately only a handful of retailers dominated certain categories. This left consumers with a lack of product differentiation from the select few stores in the marketplace. On top of diminished product differentiation, design of shopping centers became largely formulaic and offered little diversity of experience for consumers. Therefore, due to similarity of both product and experience, a given suburban retail center may often be in direct competition with a large number of other centers in an oversupplied trade area.
Then the boom of e-commerce, particularly over the last decade, added another viable shopping channel to direct selling, catalogue mail order and physical stores, further increasing the effective number of firms selling in the marketplace. However, the cannibalistic effect of e-commerce on bricks-and-mortar retail has been modest thus far. Many traditional retail firms have successfully incorporated their own online retailing platforms. So perhaps more significant than the direct competition e-commerce has posed to brick-and-mortar retailers is that the
Internet became a source of abundant product information and pricing transparency. This was also more easily utilized by the Internet savvy “Echo Boomers”, who have now entered the marketplace as wage earning consumers. They are a generational cohort equal in size to the Baby Boomers and the first consumers to grow up with the Internet and mobile technology.
The Great Recession exacerbated these new challenges facing retailers. In 2008 and 2009, total national retail sales1 exhibited the first consecutive year-over-year decrease since the 1960’s. As unemployment increased to double digits and wages showed no signs of increasing, savings rates and consumer deleveraging increased dramatically, starkly contrasting a long-term trend to the opposite. With that additional economic pressure, many retail businesses did not
The Bricks, Clicks, Economics and Mortar of Contemporary Retail 11
survive if they had not reacted adeptly to the changing retail environment in the last decade. Moving forward, retailers that have weathered the storm thus far are adapting to the changing industry landscape in many ways.
In addition to economic, competitive and consumer demand pressures, retail firms have also been challenged to anticipate the changing nature of United States demographics as the 76.5 million Baby Boomers (aged 46 to 64) file into retirement and the 73.2 million Echo Boomers (aged 16 to 32) become the next working class and majority of U.S. consumption. The Baby Boomers, soon to be retired “Golden Boomers”, still have the largest buying power of any cohort in the United States. On the other hand, the Echo Boomers are beginning to reach peak
household buying power in the next decade. This presents an interesting transition period as retailers and retail real estate owners must find a harmony between the demands of two very large, very different groups of consumers. Given that retail is tied to demography, the obvious question is, where will these cohorts choose to live? Proponents of urbanization espouse as “conventional wisdom” that Baby Boomers are moving to center cities for urban amenities and access to health care, while Echo Boomers will move inward to urban cores for economic opportunity. However, the ultimate net migration behavior of these two population cohorts is unclear.
Regardless, the retail industry in general clearly perceives their growth to be within urban cores and fringes as anecdotally many retailers, such as Target, Best Buy and Staples have clearly implemented urban store formats. Although clear demography data supporting
widespread urbanization is not yet available, there are other trends supporting a shift to urbanity, including: public subsidies for urban infill and revitalization, increased high density mixed-used and transit-oriented projects in private real estate development, declining vehicular use resulting from increased congestion and gas prices and national surveys indicating preference toward urban environments.
In summary, the retail industry has undergone substantial change in the last decade. The purpose of this paper is to identify new retail strategies and analyze them in the context of empirical retail performance across major MSAs and infer consequences to real estate. Since in the retail sector the landlord shares much of the business risk of the tenant, this analysis is then used to answer fundamental questions about the retail asset sector: What are the characteristics
The Bricks, Clicks, Economics and Mortar of Contemporary Retail 12
of quality retail properties? What are the attributes of the best performing markets? What type of space and amenities will retailers need? What tenant mixes will translate to the best
performing retail centers? What are the biggest concerns for operators and asset managers? 1.3 Methodology
To answer these questions the approach of this study is divided in two parts: strategy identification (Chapter 3) and performance analysis (Chapter 4). Evidence of the former is provided through industry interviews and citation of relevant anecdotes and trends in relevant data. Evidence of the latter is provided by multivariate OLS regression modeling of the variance of retail performance in three (3) dependent variables and eight (8) corresponding independent climate and economic variables across 66 MSAs. This analysis is done for both 2002 and 2007 Economic Census retail data and the ’02-’07 change between these datasets.
The combination of these two sections will give the context to determine the effects of the new retailing environment on real estate. This extrapolation will be presented in Chapter 5.
Refer to Chapter 2 for a full description of the methodology and data. 1.4 Summary Conclusions
The demographic shifts of Baby Boomers retiring, Echo Boomers becoming wage-earners and growth of nonwhite populations are large considerations for retailers as they locate stores to target these demographics. Long-term consumer trends indicate that there may be less discretionary income for retailers to capture in the near to long-term. Income stratification makes it important to look at both mean and median income in target markets. Ethnicity is also important and certain groups, such as Hispanics have more rapidly increasing household incomes.
The retail industry is has undergone a long period of consolidation and heightened competition. Specialty, “category killer” retailers and power centers have greatly diminished growth opportunities in traditional, suburban markets. This specialization has led to an abundance of similar offerings of products and experiences.
E-commerce has proven to be a revolutionary force in the industry. While there is
The Bricks, Clicks, Economics and Mortar of Contemporary Retail 13
retailers. Retailers are successfully implementing multi-channel platforms to develop strong branding and offer better shopping experiences. One of the most salient conclusions of this paper is that e-commerce is a buttress to brick-and-mortar retail, and retailers that adopt well-integrated multi-channel selling platforms will be the most successful in the future.
Another primary finding of this research paper is that retailers are implementing new strategies for entering urban markets. These new strategies are in reaction to oversupply of retail in suburban markets and an anticipation of demographic changes towards higher density, urban living. General strategies include using smaller, flexible store prototypes, more rigorous
definition of trade areas and incorporation of online platforms for supplemental sales, marketing, inventory control and supply chain management. Real estate practitioners are beginning to take on similar strategies.
The results of the cross-city regression analysis show that if costs of urban market entries can be offset, store performance will be greater in larger, denser markets. The cross-metro analysis implies that “strong” markets for store performance have large, growing populations with high and growing mean incomes. Employment levels are important for only certain categories of sales. Median home prices are a strong predictor, but not driver of retail sales. Population growth and home prices may serve as a proxy for the “wealth effect”. Availability of broadband access is a strong compliment to physical store sales. Access to online information decreases search costs and drives more offline retail sales.
For real estate, most domestic development in the foreseeable future it will occur in densely populated markets, frequently as part of mixed-use projects with amenities such as public transit, walkability and proximity to entertainment. Existing assets with competitive advantages in “strong”, supply-constrained markets may be candidates for improvement or renovation to better suit the contemporary retailers’ space needs and create better shopping experiences. Value should be placed on assets with flexibility to adjust to shrinking and shifting space needs.
Tighter asset control and management will be required due to increased volatility in the retail industry and higher costs of turnover and design changes in urban markets. Also, trade areas in urban markets require more thorough understanding in regards to income and ethnic
The Bricks, Clicks, Economics and Mortar of Contemporary Retail 14
profiles and traffic patterns. Control over tenant mixes, common areas and design should be more adamantly negotiated in leases. Retail centers can be differentiated by typical power centers and malls by using public areas for social gather or programmed events.
Determining tenant mixes will require careful balancing given increased volatility in the retail industry. Firms selling inelastic goods such as grocers and value-oriented retailers will provide rent roll that is more resistant to economic downturns or lagging discretionary incomes. The most viable retail tenants are large, specialty retailers that dominant their category. Retailers with a highly integrated online platform are expected to perform the best. There are also
opportunities for niche or new concept retailers with particularly differentiating qualities such as a unique offerings or shopping experiences.
1.5 Thesis Structure
The remainder of this paper is organized as follows: Chapter 2 describes the methodology and data collection in further detail. Chapter 3 provides evidence of industry trends and presents interviews of practitioners. Chapter 4 discusses the results of regression analysis of retail data across major MSAs. Chapter 5 summarily combines empirical results from Chapter 3 and 4 to extrapolate conclusions on the effects on real estate. Chapter 6 concludes.
The Bricks, Clicks, Economics and Mortar of Contemporary Retail 15
CHAPTER 2: METHODOLOGY AND DATA
2.1 Introduction
The primary hypothesis of this thesis is that the conventional definition of good retail real estate has substantially changed in the last decade. To test that hypothesis, the approach of this paper is to examine broad changes in the retail industry (Chapter 3), put them in an empirical economic context and make ex post an ex ante conclusions on contemporary retailing (Chapter 4). From those conclusions we can extrapolate effects to the underlying real estate that retailers occupy (Chapter 5). A shopping center developer or investor will have traditional parameters with which they vet sites or properties, i.e. how they define a “good” retail center. Given the conclusions derived from this paper, we will determine if there have been substantial revisions to that set of parameters. Specifics on the methodological approach and collection of evidence and data are presented in the remainder of this section.
2.2 Observe Broad Industry Trends
Because the business of retail can change within short periods of time, it is important to identify broad trends that could indicate shifts in the way retailers occupy space. For this purpose, we have gathered data on the following topics for presentation:
- Long-term history of national retail sales, incomes, personal savings rates and population
- Long-term history of stock of shopping centers - Historical annual store closings and openings - Urbanization trends and historical city densities
- Anecdotal examples of flexible store prototype and urban storing strategies
- Internet and e-commerce sales and retailing strategies and citation of previous studies on effects
Sources for these topics are cited throughout the paper. Data for consumer behavior, population, density and e-commerce was compiled from various departments within the U.S. Bureau of Census (BOC), the Bureau of Labor and Statistics (BLS), the Federal Reserve Board,
The Bricks, Clicks, Economics and Mortar of Contemporary Retail 16
and the Bureau of Economic Analysis (BEA). Data regarding shopping centers and store
openings and closings was compiled from the International Council of Shopping Centers (ICSC) and the CoStar Group. Various other sources of data in this section include news articles, surveys and academic and industry research studies.
2.3 Conduct Industry Interviews
Chapter 3 concludes with the presentation of industry feedback from a standardized series of short interviews. The purpose is to understand “on the ground” strategy given the context of the broad trends national laid out in the first part of Chapter 3. Interviews were conducted with decision makers from both retail companies and real estate companies in the retail sector.
The participants in the interviews represent a cross-section of the retail business that gives varying perspectives on contemporary storing strategies. The participants are retail storing strategists, retail REITs, real estate equity investors, shopping center developers and designers. The participants are strategists in the following firms: Walmart, Staples, PetSmart, Kohl’s, BJ’s Wholesale Club, Stop & Shop, Ivanhoe Cambridge, General Growth Properties, Simon
Properties, ING Clarion, Vornado, WS Development, Samuels & Associates, Linear Retail and Elkus Manfredi Architects.
The interviews themselves were designed tube succinct and focused on the broad topics identified in the first part of Chapter 3. The interview templates can be found in Appendix B. There are four (4) questions designed to cover the general topics of growth, urbanization, physical store strategies and multi-channel retailing.
Interviews were performed over the phone and were only recorded via note-taking. No audio recordings were made. Therefore, the responses to the interview questions are reported in paraphrased transcripts with some direct quotes. These distilled transcripts were sent to the interviewees for approval and/or revision. The interview transcripts are presented beginning with the name and position of the interviewee and a brief description of the firm.
2.4 Perform Cross-Metro Analysis of Retail Data
Chapter 4 in this paper examines the relationship between city climate and economic data with corresponding retail performance data. This analysis is based on a multivariate ordinary
The Bricks, Clicks, Economics and Mortar of Contemporary Retail 17
least squares (OLS) regression model of three (3) sets of data, each with eight (8) independent control variables (city attributes), three (3) dependent variables (measures of retail performance) across 11 different retail categories for approximately 66 MSAs. The variables are shown in Figure 1. Summary statistics of datasets for each of the variable are shown in Figure 21of Chapter 4 to provide context of scale and variability for the results section.
The primary sources for these data were various departments of the U.S. Bureau of Census (BOC) and the Bureau of Labor and Statistics (BLS). Retail data is from the 2002 and 2007 Economic Census which provides detailed microdata on retail sector sales and
establishments every five years. Home price data is from the National Association of Realtors (NAR). Climate data is primarily sourced from the U.S. National Oceanic and Atmospheric Administration (NOAA). Specific departmental sources of the data are compiled in a table in Appendix A.
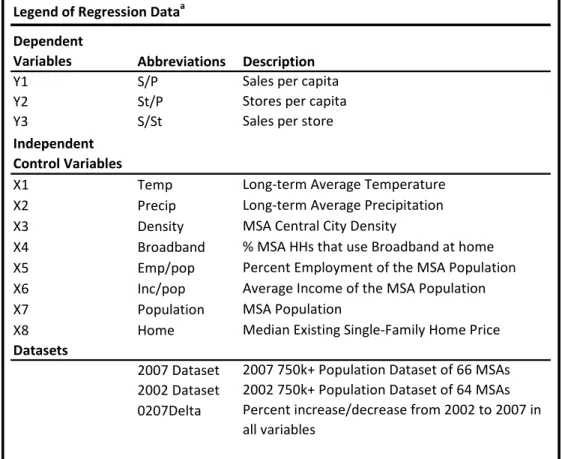
Figure 1: Legend of Regression Model Variables and Datasets
Legend of Regression Dataa
Dependent
Variables Abbreviations Description
Y1 S/P Sales per capita Y2 St/P Stores per capita Y3 S/St Sales per store Independent Control Variables X1 Temp Long‐term Average Temperature X2 Precip Long‐term Average Precipitation X3 Density MSA Central City Density X4 Broadband % MSA HHs that use Broadband at home X5 Emp/pop Percent Employment of the MSA Population X6 Inc/pop Average Income of the MSA Population X7 Population MSA Population X8 Home Median Existing Single‐Family Home Price Datasets 2007 Dataset 2007 750k+ Population Dataset of 66 MSAs 2002 Dataset 2002 750k+ Population Dataset of 64 MSAs 0207Delta Percent increase/decrease from 2002 to 2007 in all variables a Refer to Appendix A to see further description of data including units and sources.
The Bricks, Clicks, Economics and Mortar of Contemporary Retail 18
The combination of these variables resulted in a total of 99 OLS regression equations, 33 per dataset. This is three (3) dependent variable equations for 11 different retail categories for three (3) different datasets. The regression equation takes the following form, where “j” and “I” correspond to the variable number indicated in Figure 1.
Yj = β0 + βiXi + … + βnXn +ej
In this equation, a unit increase in Xi is associated with a mean βi increase in Yj.
However, the data variance of control variables in this regression model can be significantly larger for depending on the size of the MSA. Therefore the 2002 and 2007 static datasets were log transformed to control for relatively greater variability. In the resultant regression equations, a 1% increase in Xi is associated with a βi% increase in Yj. Both the independent and dependent
datasets were log transformed to yield the following regression equations. ln(Yj) = β0 + ln(βi Xi) + … + ln(βn Xn) + ej
The summary results of these equations are broken down by independent variable in Chapter 4. In each section, the role of an independent variable is described by showing their elasticities of retail supply and demand relative to the dependent Yj.
The dependent variables of retail performance were examined because of their interactive relationship to each other. In the results tables, a column is included with the heading
“ExpBeta”. This essentially represents the expected beta of the X variable in the Sales per Store (S/St) Y3 results table. This column is the difference between the corresponding beta in the Y1 and Y2 results tables. That is, (βi,S/P- βi,St/P) = βi,S/St for the “ExpBeta” column. This is discussed
further in Chapter 4.
The 66 MSAs were selected because they have populations of over 750,000 or greater. The first run of this analysis included approximately 250 MSAs with populations 100,000 or greater; however the inclusion of relatively small MSAs caused noisy results due to the idiosyncratic and sometimes parasitic nature of small metropolitan areas. For example, if a substantial shopping center is added to a small MSA, it could drastically affect the total amount of sales and stores relative to the MSA’s economic characteristics which could cause misleading results in the overall OLS equations. Also, many small MSAs are effectively satellites of larger ones. This will cause some spurious correlations to be drawn, particularly regarding
The Bricks, Clicks, Economics and Mortar of Contemporary Retail 19
employment since a person that lives in a small MSA will travel to a nearby large MSA for work. Also, Las Vegas was omitted from these datasets due to the tourism expenditures skewing the amount of consumption demand relative to the cities indigenous economic variables.
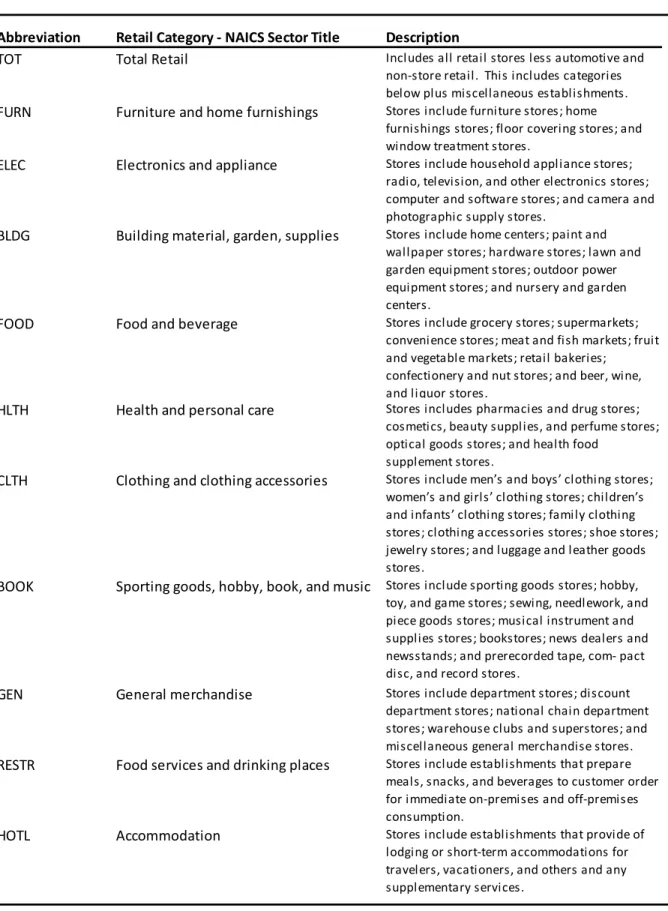
Finally, the data for the retail performance was examined results across all retail categories as defined by the North American Industry Classification System (NAICS). We performed these additional layers of analysis because retail is a segmented business in regards to shopping behavior and economic influences. For example, people may shop less in rainy areas, but need to buy more of certain goods due to increased wear and tear. Other examples are that some goods may be more frequently bought online or some goods may have very high income elasticity where others may not. The analysis denotation and official NAICS title and
The Bricks, Clicks, Economics and Mortar of Contemporary Retail 20 Figure 2: NAICS Retail Categories
Abbreviation Retail Category ‐ NAICS Sector Title Description
TOT Total Retail Includes all retail stores less automotive and non‐store retail. This includes categories below plus miscellaneous establishments.
FURN Furniture and home furnishings Stores include furniture stores; home furnishings stores; floor covering stores; and window treatment stores.
ELEC Electronics and appliance Stores include household appliance stores; radio, television, and other electronics stores; computer and software stores; and camera and photographic supply stores. BLDG Building material, garden, supplies Stores include home centers; paint and wallpaper stores; hardware stores; lawn and garden equipment stores; outdoor power equipment stores; and nursery and garden centers.
FOOD Food and beverage Stores include grocery stores; supermarkets; convenience stores; meat and fish markets; fruit and vegetable markets; retail bakeries; confectionery and nut stores; and beer, wine, and liquor stores. HLTH Health and personal care Stores includes pharmacies and drug stores; cosmetics, beauty supplies, and perfume stores; optical goods stores; and health food supplement stores. CLTH Clothing and clothing accessories Stores include men’s and boys’ clothing stores; women’s and girls’ clothing stores; children’s and infants’ clothing stores; family clothing stores; clothing accessories stores; shoe stores; jewelry stores; and luggage and leather goods stores.
BOOK Sporting goods, hobby, book, and music Stores include sporting goods stores; hobby, toy, and game stores; sewing, needlework, and piece goods stores; musical instrument and supplies stores; bookstores; news dealers and newsstands; and prerecorded tape, com‐ pact disc, and record stores.
GEN General merchandise Stores include department stores; discount department stores; national chain department stores; warehouse clubs and superstores; and miscellaneous general merchandise stores.
RESTR Food services and drinking places Stores include establishments that prepare meals, snacks, and beverages to customer order for immediate on‐premises and off‐premises consumption.
HOTL Accommodation Stores include establishments that provide of lodging or short‐term accommodations for travelers, vacationers, and others and any supplementary services.
The Bricks, Clicks, Economics and Mortar of Contemporary Retail 21
2.5 Extrapolate Consequences to Real Estate
Chapter 5 of this paper is will summarily review and combine results from Chapters 3 and 4 in a real estate context. We will examine if the trends and strategies discussed in Chapter 3 are evident in the results presented in Chapter 4. This will yield an ex post viewpoint of effects of trends and strategy. However, because the trends and strategies from Chapter 3 are very contemporary shifts, there may be no apparent effect in data analysis presented in Chapter 4. That being said, some of the results in Chapter 4 may support logical constructs of past economic models of retail and may have implications to future retail performance if the Chapter 3
strategies are implemented, giving an ex ante viewpoint.
Using both the ex ante and ex post conclusions, we will extrapolate how real estate will be affected in the long term – that is, over the next 10-20 years. Where will retailers look to expand? What will they expect of the spaces they occupy? Given their product and business model, what types of retailers will provide stable rent through economic cycles and which ones have the greatest opportunity for growth?
The Bricks, Clicks, Economics and Mortar of Contemporary Retail 22
CHAPTER 3: RETAIL STRATEGIES – INDUSTRY TRENDS AND INTERVIEWS
3.1 General Changes in the Retail Industry
Retail is one of the largest sectors of the United States economy, constituting a $4.4 trillion industry with over 1.1 million business establishments and 15.5 million employees. Even though the industry has such enormous size, it is a fast-paced, volatile business that relies on a number of ephemeral drivers. Some of these drivers are cyclical on a longer-term basis such as national economic health, interest rates and consumer confidence. Others are very short-term such as consumer fads and tastes. These metrics of demand are crucial to retailers but often will not matter to real estate owners or developers, even though they essentially participate in the same business. Their products are fundamentally different. Retail products are mobile, dynamic and the supply can be adjusted daily, whereas the real estate products are fixed, very inelastic and decisions are essentially irreversible, at least in the short-term.
Figure 3: 2007 Rank of Core Business Sectors in the United States
Therefore, in this chapter we seek to identify long-term industry trends and shifts in retail strategy that are relevant and meaningful to real estate investors. Specifically, we attempt to
2007 Rank of Core Business Sectors in the United States
NAICS code Description Establishments Revenue Employees
21 Mining, quarrying, oil & gas 15 14 14 22 Utilities 16 11 15 23 Construction 4 4 7 31‐33 Manufacturing 10 1 3 44‐45 Retail trade 1 2 2 48‐49 Transportation and warehousing 11 8 9 51 Information 12 7 11 52 Finance and insurance 7 3 8 53 Real estate and rental and leasing 9 12 12 54 Professional, scientific, and tech services 2 6 6 56 Admin, Support, Waste Mgmt, Remediation 8 9 5 61 Educational services 14 16 16 62 Health care and social assistance 3 5 1 71 Arts, entertainment, and recreation 13 15 13 72 Accommodation and food services 5 10 4 81 Other services (except public admin) 6 13 10 Source: U.S. Census Bureau, 2007 Economic Census
The Bricks, Clicks, Economics and Mortar of Contemporary Retail 23
report trends that ultimately affect the “storing strategy” of retailers. Storing strategy refers to the mid to long-term plans that retailers devise regarding where and when they open (or close) what type of stores. Also part of this strategy is the design of store “prototypes”, which includes floorplate size and layouts, lighting, ceiling height, inventory, et al. In other words, storing strategy decides the location, size and design characteristics of the properties the retail stores will occupy. This obviously affects real estate owners directly.
The timelines and metrics retail firms use to formulate storing strategy are much more aligned with those used in real estate decisions. Retail companies will typically make one, three and/or five year plans for stores, which get revised based on general market and competitive conditions. Like in real estate firms, decisions on stores pass through an investment committee approval process in large retail firms. In real estate rent and absorption forecasts, pipelines and competitive properties will drive decisions. Similarly, retailers perform sales volume forecasts and competitive analyses for potential store openings. And finally, both real estate owners and retailers are concerned with the physical size, design and layout of properties and stores.
3.1.1 Long-term Consumer Trends
If, as the saying goes, “location, location, location” is always the three most important things in real estate, “demographics” may be the fourth, particularly for retail sector real estate. First of all, retail is a starkly segmented industry and different products are tailored differently by every consumer characteristic possible: age, income, ethnicity, etc. Typically the paramount consideration in retail site selection is the demographic profile in the assumed trade area. Retail firms formulate a description of their target customer and place stores where that customer lives. Then, generally speaking, store growth will continue until all market demand is captured or the distance between firms is maximized based on consumers’ willingness to travel.
The demographic metric has to be measured on a case-by-case basis for a potential store or shopping center site. However, it is worth taking a looking at a “30,000 foot view” of the national population trends to see the ocean that retailers are currently swimming in. The coming 10 years will be a very interesting time in the United States demographics. In that period, the
The Bricks, Clicks, Economics and Mortar of Contemporary Retail 24
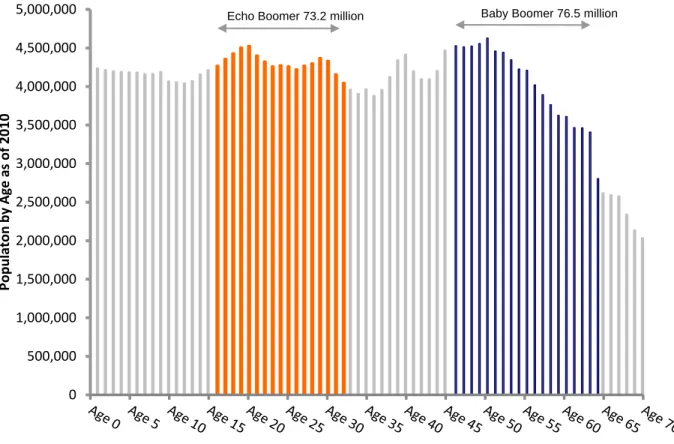
76.5 million Baby Boomers (aged 46 to 64)2, the largest generational cohort in U.S. history, will move en mass into retirement. Meanwhile their offspring, the Echo Boomers (aged 16 to 32)3, a comparably immense cohort at 73.2 million, will mature into wage-earning adults and head towards their peak earning power years.
Figure 4: US Population by Age as of May 2010
2Although the definition varies somewhat, this is the definition presented by the US Census Bureau in their October
2001 Census Brief.
3There is no widely accepted consensus on the exact defining years of the U.S. Echo Boom. The definition provided
here is based off of multiple sources, primarily the Bureau of Labor and Statistics and Bloomberg. The noted beginning year of the Echo Boom is 1978 as this is the first cohort of students to generally have access to the Internet throughout high school due to a 1993 federal government initiative to incorporate computers and the Internet in schools. The cohort ending year of 1994 is the first clear downward trend year of Echo Boom birthrates, and this marks the year where the youngest of the Baby Boomers turned 30, well past the national average age of 26 for “first-birther” women.
0 500,000 1,000,000 1,500,000 2,000,000 2,500,000 3,000,000 3,500,000 4,000,000 4,500,000 5,000,000 Populaton by Age as of 2010
Echo Boomer 73.2 million Baby Boomer 76.5 million
The Bricks, Clicks, Economics and Mortar of Contemporary Retail 25
There are a lot of resources expended on the behalf of retailers trying to anticipate the spending habits, priorities, preferences and lifestyle choices of these two very different generations. Although the U.S. Bureau of Census (BOC) does not report incomes by age category, there are many speculative estimates that put the spending power (disposable income) of Baby Boomers around $2 trillion and Echo Boomers a little over $1 trillion.
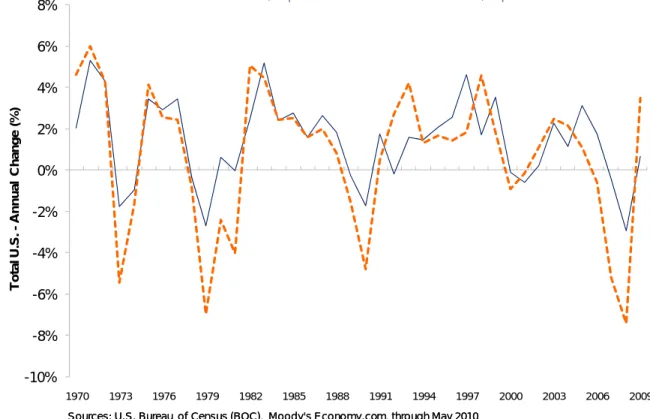
When examining the volume of total national retail sales (inflation adjusted) over the past 40 years, sales per capita exhibit an average annual (real) increase of 0.78%, and the volatility is very cyclical about this mean. National average incomes per capita have a long-term (real) average increase of 1.44%, while exhibiting the same cyclical, volatile behavior but generally acting as a lagging indicator of sales, as can be seen in Figure 5 below.
Figure 5: Annual Percentage Change in U.S. Income and Retail Sales per Capita
The strong relationship between long-term average sales and income makes income-related trends very important to retailers. Some notable recent trends are savings rates, consumer credit and socio-economic income stratification. The former two trends are often metrics
-10% -8% -6% -4% -2% 0% 2% 4% 6% 8% 1970 1973 1976 1979 1982 1985 1988 1991 1994 1997 2000 2003 2006 2009 T o ta l U .S . -A n nua l C h a n ge ( % )
Real Inc/capita Real Retail Sales/capita
Sources: U.S. Bureau of Census (BOC), Moody's Economy.com, through May 2010 Sources: U.S. Bureau of Census (BOC), Moody's Economy.com, through May 2010
The Bricks, Clicks, Economics and Mortar of Contemporary Retail 26
retailers will use in sales forecasting models. The latter is a trend that affects considerations in income profiling of markets in which retailers wish to enter.
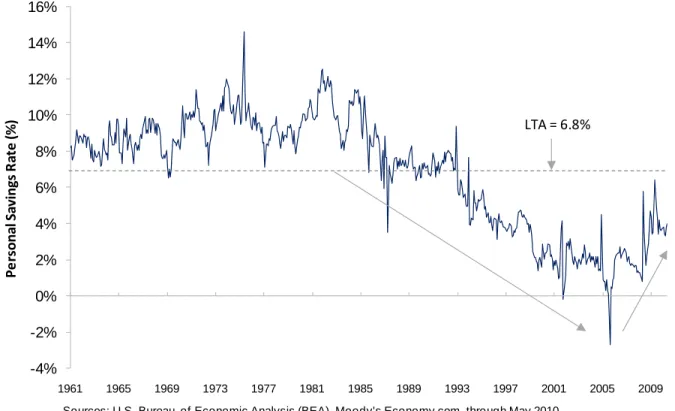
Household purchases are made from “disposable income”, which is defined as gross income less taxes. “Discretionary income” is defined as disposable income less savings and essential living purchases or “fixed costs”, such as food, housing and some clothing. These fixed-cost, necessity goods are generally income inelastic. However, most retailers selling non-necessity goods are concerned with discretionary incomes and savings rates. As seen in Figure 6, there has been a long trend of decreased savings among Americans, bottoming out around 1% of disposable income in the last decade. The Great Recession seems to have been a wake-up call, and this non-savings trend has recently reversed. U.S. consumers are believed to have entered into a period of “deleveraging”. Also, there is some evidence that Baby Boomers entering retirement will be more fiscally conservative and have higher savings rates (DeVaney 2005). Retailers will be watching this trend with great interest.
Figure 6: U.S. Average Personal Savings Rate (% of Disposable Income)
-4% -2% 0% 2% 4% 6% 8% 10% 12% 14% 16% 1961 1965 1969 1973 1977 1981 1985 1989 1993 1997 2001 2005 2009 Pe rs o n al Sa vings Ra te (% )
Sources: U.S. Bureau of Economic Analysis (BEA), Moody's Economy.com, through May 2010
The Bricks, Clicks, Economics and Mortar of Contemporary Retail 27
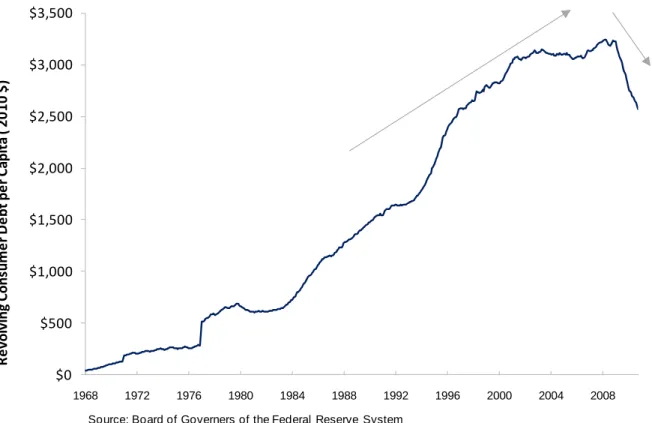
A similar trend reversal has happened with consumer credit. The advent of the credit card has helped the U.S. population rack up unprecedented amounts of revolving debt.
Revolving debt includes about 98% credit card debt according to the Federal Reserve Board. In Figure 7, the amount of revolving debt is shown historically on an inflation adjusted, per capita basis. The amount of consumer revolving debt peaked at $974 billion but is now down to $800 billion. Twenty years ago this total was only $337 billion in 2010 dollars, indicating a more than 200% increase in real terms.
Figure 7: Revolving Consumer Debt per Capita in 2010 Dollars
For some context on what this could mean for retailers, let us consider the impact of debt burdens on discretionary incomes. In 2007, an estimated 176 million people had an average of $5500 in credit card debt with an average APR of 14%, which would take approximately 23 years to pay off with minimum monthly payments.4 To bring this down to a more reasonable 5 year payoff, the average monthly payment would have to increase by 16%. On a broad level, this suggests that national retailers of discretionary goods are going to have a smaller pie to fight
4 Data sources: U.S. Bureau of Census Table 1151, Federal Reserve Board, Creditcards.com, Nov. 2010
$0 $500 $1,000 $1,500 $2,000 $2,500 $3,000 $3,500 1968 1972 1976 1980 1984 1988 1992 1996 2000 2004 2008 R e vo lv in g C o ns um e r De b t pe r Ca p ita ( 2010 $)
The Bricks, Clicks, Economics and Mortar of Contemporary Retail 28
over in the short to mid-term. This implies that those retailers’ storing strategies will be more conservative, focusing only on locations with unmet demand in high income areas.
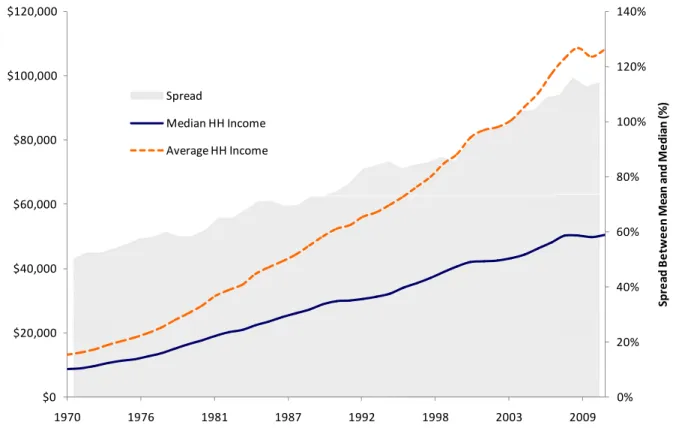
This relates to another long-term national trend – income stratification. As implied by Figure 8, an increasingly smaller number of households have increasingly higher incomes. Higher income households will typically have disproportionately higher discretionary income for retail expenditures, since taxes and fixed costs may not vary as much as gross incomes. Going forward, retailers will have to find ways to sell more effectively to a shrinking population of high income families, or they will need to find higher densities of underserved low and middle income families. Another part of this is that some ethnic groups have significantly faster growing
household incomes than others. In the 2000’s, Hispanic and other groups classified as “nonwhite” had the fastest growing incomes in the U.S. (Bucks, et al. 2009).
Figure 8: U.S. Household Mean and Median Incomes, 1970-2010
0% 20% 40% 60% 80% 100% 120% 140% $0 $20,000 $40,000 $60,000 $80,000 $100,000 $120,000 1970 1976 1981 1987 1992 1998 2003 2009 Spre ad Be tw een Me an an d Me d ia n (%) Hi st o ri ca l U. S. Ho u se h o ld Me an an d Me d ia n In co m e s (n o m in al $) Spread Median HH Income Average HH Income Source: U.S. Bureau of Census, Moody's Analytics, November 2010
The Bricks, Clicks, Economics and Mortar of Contemporary Retail 29
3.1.2 Long-term Retail Business Trends
Due to a convergence of many factors, retailing has become a sharply more competitive business environment in the last 10-15 years. This resulted in a period of a tighter margins, increased bankruptcies and consolidation.
According to an analysis of 225 publicly held U.S. retailers (Kurt Salmon Assoc 2008), the last decade has been a period of underwhelming performance by the majority of the industry. Of the 225 companies studied, 60 percent produced less than 10 percent increase in annual revenues between 1998 and 2007. Of those, 15 percent exhibited declining yearly profits. In 2007, just before the recession, 27 percent of the 225 retailers reported falling profits. In that study, the surveyed retailers themselves largely attributed poor performance numbers on an overall lack of product and shopping experience differentiation in the retail industry.
The most recent and notorious retail bankruptcies (Circuit City, Linens ‘n Things and Mervyns) occurred recently in 2008. Many feel other large retailers such as Blockbuster and Jamba Juice are soon to follow. These closures are primarily associated with the recession and the brutal toll it has taken on the retail industry. However, the increased rate of retailer
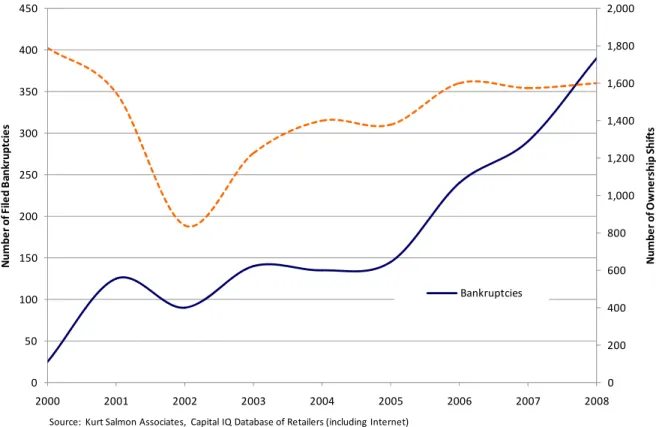
The Bricks, Clicks, Economics and Mortar of Contemporary Retail 30 Figure 9: Retail Bankruptcies, Mergers and Acquisitions, 2000-2008
Although many of these bankruptcies and mergers represent small firms swallowed by larger firms, many large retailers were also experiencing difficulties as early as the late 1990’s as seen in Figure 10. Over $44 billion in assets were filed under Chapter 11 bankruptcy protection in the 2000’s before the 2008 recession took hold. This is over four times the amount that was filed in 2008 and 2009. 0 200 400 600 800 1,000 1,200 1,400 1,600 1,800 2,000 0 50 100 150 200 250 300 350 400 450 2000 2001 2002 2003 2004 2005 2006 2007 2008 Num b e r of Ow n e rs h ip Shi ft s Nu m b e r of Fi le d Ba n kr u p tc ies Bankruptcies Source: Kurt Salmon Associates, Capital IQ Database of Retailers (including Internet)
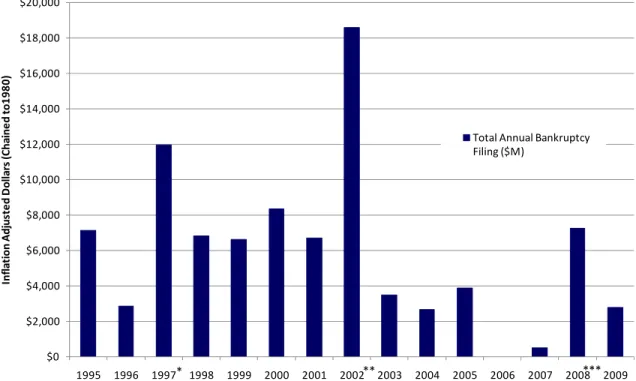
The Bricks, Clicks, Economics and Mortar of Contemporary Retail 31 Figure 10: Retail Bankruptcies by Dollar Amount ($100M+)
A large part of what was happening with the bankruptcies and mergers was consolidation and increased specialization of the industry’s largest and best capitalized firms. These retail firms were dubbed “category killers”. The moniker refers to these firms’ focused specialization in a particular retail category and their substantial competitive advantage in pricing and scale over smaller retailers in the same category. The rise of these retailers has corresponded to store closings increasingly outpacing store openings in the last 10 years, as seen in Figure 11.
$0 $2,000 $4,000 $6,000 $8,000 $10,000 $12,000 $14,000 $16,000 $18,000 $20,000 1995 1996 1997 1998 1999 2000 2001 2002 2003 2004 2005 2006 2007 2008 2009 In fl at io n Adj u st e d D o lla rs (C h ain e d t o 19 80 ) Total Annual Bankruptcy Filing ($M) Source: UCLA Law Bankruptcy Database ($100+ Assets) * Includes Montgomery Ward bankruptcy. ** Includes K‐Mart bankruptcy. *** Includes Circuit City, Mervyns and Linens 'n Things bankruptcies. * ** ***
The Bricks, Clicks, Economics and Mortar of Contemporary Retail 32 Figure 11: U.S. Store Openings and Closings, 1993-2008
Essentially what this means is that there is more homogeneity in the retail industry. While the environment is more competitive, it is also dominated by a few retailers selling similar products. Tenants that specialize effectively like the category killers represent viable tenants that are more likely to be expanding. While this specialization allows for some competitive advantage, it also narrows buying options for consumer. That presents opportunity for retail tenants that offer unique products which are differentiated from the large specialty retailers. 3.2 Shopping Center Trends
Per the CoStar Group, the current national stock of retail space is 49 square feet per capita and the stock of shopping center space is 23.3 square feet per capita. So, is the nation over-retailed? This is an often-asked, loaded question that is too abstract to have much meaning. The answer is that sometimes it is and sometimes it isn’t. The stock of retail buildings and
‐5 0 5 10 15 20 25 30 35 0 20 40 60 80 100 120 140 160 180 1993 1994 1995 1996 1997 1998 1999 2000 2001 2002 2003 2004 2005 2006 2007 2008 Nu m b e r of U. S. St o re s Cl os in g/ O p e n in g A nnua lly Spread Store Closings Store Openings
The Bricks, Clicks, Economics and Mortar of Contemporary Retail 33
stores is regulated by the drivers in the space market. Put simply, development will proceed or halt depending on whether market rents will sufficiently cover costs to build, where rents are determined by demand for space. In this section, we will ask it another way – has the long-term development of a particular type of retail real estate outpaced the historical demand? Since we have seen already that income is a key component of demand for retail, we will take a simple approach of observing income per capita in contrast with sales and square footage of retail per capita in the nation. The following Figure 12 exhibits an indexed value of these data with a base value of 100 in 1970. We can examine the historical rates of increase of each variable.
Figure 12: Index of Income, Sales and Retail Square Footage per Capita (1970 = 100)
Expectedly, the national stock of retail space moves roughly in sync with retail sales per capita. It is also unsurprising that real incomes per capita have increased at a slightly greater annual pace than stock and sales. In the last 20 years, total retail sales and square footage per capita have increased 10.7% and 9.1%, respectively, whereas income per capita increased 24.9%. This indicates that overall retail space has not increased disproportionately to demand. However, shopping centers had a boom in the 1970’s and 1980’s and have a rate of increase in the last 20
0 50 100 150 200 250 1970 1973 1976 1979 1982 1985 1988 1991 1994 1997 2000 2003 2006 2009 In d exed V a lu es ( c h a in ed t o 1970) Real Inc/capita
Real Retail Sales/capita Retail SF/capita
Shopping Center SF/Capita
The Bricks, Clicks, Economics and Mortar of Contemporary Retail 34
years of 23.3%. This is a much higher increase than overall retail stock, so next we take a deeper look at the individual categories of shopping centers. Shopping center classifications as defined by the International Council of Shopping Centers (ICSC) are included in Figure 31 in Appendix D.
Figure 13: Share of Shopping Center Growth by Center Category, 1990-2010
Even though power centers comprise only 12% of overall shopping centers, they have accounted for a disproportionate 40% of the growth in shopping centers in the last 20 years. This means that power centers have had exponentially greater growth than malls, outlets, strip centers, etc. Therefore, we look again at square footage of retail in the context of historical income and sales, this time using the stock of the top three fastest growing shopping centers: power centers, community centers and neighborhood centers.
39.3% 25.3% 15.9% 7.0% 6.9% 2.5%2.2% 1.0%
Share of Shopping Center Growth 1990‐2010
Power Centers Community Centers Neighborhood Centers Lifestyle Centers Convenience Outlets Regional Centers Super Regional CentersThe Bricks, Clicks, Economics and Mortar of Contemporary Retail 35 Figure 14: Index of Income, Sales and Retail Square Footage by Center Type
Clearly power centers stand out in the chart in Figure 14. Exhibiting a 176% increase in the last 20 years, they have vastly outpaced real incomes and increased their market share at the expense of other center types. They are a part of the consolidation that has occurred in the industry that was described in the previous section. Power centers are anchor dominated by category killer stores such as Lowes, IKEA, Target, Best Buy, et al. They have a typical range of 250,000 to 600,000 square feet GLA, 25 to 80 acres of site and a trade area of 5-10 miles.
This implies is that the overall market may be saturated with power centers. A number of these centers were likely developed on a speculative basis and will underperform. Future
development of such centers or expansion of retailers into these centers will need to be done carefully, in strong markets. This also means that future growth opportunities may exist in higher density markets where power center formats have physical barriers to entry.
0 100 200 300 400 500 600 1970 1973 1976 1979 1982 1985 1988 1991 1994 1997 2000 2003 2006 2009 In d exed V a lu es (c h a in ed t o 19 70)
Real Inc/capita Real Retail Sales/capita
Community Centers Neighborhood Centers
Power Centers
The Bricks, Clicks, Economics and Mortar of Contemporary Retail 36
3.3 The Urban Shift in Retail
3.3.1 Brief Background of Contemporary Urbanization
An old adage in the retail business is “retail follows rooftops,” meaning that people primarily shop where they live. Recently, somewhat of a conventional wisdom has developed that suburbanization has reversed and people are moving back to cities. However, this is mostly anecdotal, and there are arguments and evidence both for urbanization and continued
decentralization occurring in the future.
The argument for increased urbanization is essentially that many of the factors that drove suburbanization (poor schools, services and utilities, higher taxes, congestion and crime and “white flight”) have been resolved through urban revitalization, and retiring “empty nesters” and career-minded Echo Boomers will choose to live in cities to take advantage of these
improvements. There are many examples of city planning boards abandoning traditional post-World War II Euclidian zoning in favor of higher density, mixed-use urban revival. To encourage economic redevelopment of some blighted downtown districts or functionally obsolescent buildings, municipalities have offered incentives to private developers through public-private partnerships, tax credits, abatements, utility discounts, or public financing.
Most architecture and planning academic institutions train new planners in the design of integrated, mixed-use communities. The vast majority of these schools teach some form of “New Urbanism”, a concept in planning that espouses effective combination of density, open space, multiple transportation options and walkability among a mix of real estate uses. Real estate trade organizations, especially the Urban Land Institute, have produced countless publications and studies on the positive value of these developments.
Of theBaby Boomer generation, 17 million, or 25 percent of the cohort will be senior citizens within the next decade. There are indications these Boomers will greater desire communities that are walkable or have access to public transit. Retail consulting firms have predicted that they will seek smaller, easier shopping formats that are closer to home (DelWebb 2010). Walkability has become important enough that, as of July 2007, the popular online real estate database, Zillow, includes “Walk Scores” on their listings that give a home or property a
The Bricks, Clicks, Economics and Mortar of Contemporary Retail 37
numerical grade from 0-100 on the walkability of the property to retail and transit infrastructure and other services.
Furthermore, increased costs of transportation and time-value of money have made long commutes from the suburbs undesirable. There are some indications that this is resulting in decreased preference towards transportation via automobile. In Appendix E, Figure 32it is clear that the amount of automobile use is decelerating over the last 20-30 years. Also, automobile sales have significantly decreased as a share of total retail sales over the last decade (Figure 33).
However, despite this convincing case for urbanization, it has not yet come to bear, and there is no statistical evidence that this is happening on a widespread basis. In Figure 15 below, some data is presented for density changes in U.S. cities. Central city densification has actually slowed in the U.S. in the 2000’s. The large density increases in 1990-2000 can at least partially be explained by the fact that that decade underwent the largest population growth in U.S. history (Hobbs and Stoops, 2002, p.12).
Figure 15: U.S. City Density Changes for 500k+ Population Cities, 1990-2005
Seeking to answer if there is a relatively greater trend for central city densification, one research study shows that for 73 major MSAs, the majority of MSAs outperformed their central
U.S. City Density Changes, 500k+ Populations Top 5 1990‐2000 Top 5 2000‐2005 Las Vegas 85.2% Las Vegas 13.6% Phoenix 33.6% Phoenix 10.6% Austin 32.7% San Antonio 9.1% Charlotte 31.3% Charlotte 8.7% Denver 18.4% Jacksonville 6.4% Bottom 5 1990‐2000 Bottom 5 2000‐2005 Philadelphia ‐4.3% Philadelphia ‐3.6% Milwaukee ‐5.0% Washington D.C. ‐3.8% Washington ‐5.7% San Francisco ‐4.8% Detroit ‐7.5% Boston ‐5.1% Baltimore ‐11.5% Detroit ‐6.8% Overall Average 1990‐2000 Overall Average 2000‐2005 12.5% 2.0% Source: U.S. Bureau of Census ‐ City Data Book
The Bricks, Clicks, Economics and Mortar of Contemporary Retail 38
cities in population growth from 2000-2004 (Nguyen 2006)5. Another study by the U.S.
Department of Agriculture(Cromartie 2009) suggests that the U.S. population is likely to become more rural based on historical migration behavior from the 1990’s, with controls for various demographic and geographic characteristics. The justification is that people will seek the housing affordability of these areas as urban markets become more expensive.
Another argument for decentralization is the onset of communications technology in business. The idea is that e-mail and video conferencing eliminates the need of informational and physical proximity afforded by central business districts (CBDs). This is supported anecdotally by the fact that many major companies now institute part time work-from-home programs.
The truth of urbanization most likely lies somewhere in between. Cities will have a combination of densification and border expansion. The extent to which one will outpace the other will depend on the metro, and both patterns of growth will present opportunities.
3.3.2 Urban Strategies in Retail
At a shareholders conference in 2008, the Walmart head of U.S. Development, Eduardo Castro-Wright said of their urban target markets, “If we had the same market share in those 15 opportunity markets as in the rest of the U.S., it would represent a larger opportunity than exists in India and Russia combined. It is a very significant opportunity for us and one you will see us invest in more in the future.”
Essentially, the degree to which urbanization is occurring in a widespread fashion in the United States is not particularly paramount to retail real estate owners. What is more important is that retailers are clearly recognizing penetration into urban markets as a second growth opportunity. This is a volte face of previous strategy now that suburban markets have become saturated with power centers and the like. Traditionally, economics have dictated that the cost to enter these markets outweigh the revenues. One of the primary ways in which typically large format retailers are offsetting those costs is developing and implementing small, flexible prototypes.
The Bricks, Clicks, Economics and Mortar of Contemporary Retail 39
Prototype “flexibility” has been an industry buzzword for at least 10 years now. It was implemented for streamlining store navigation and inventories to make “high velocity” efficient formats. However, this flexibility was generally implemented on a small scale. By and large, prototypes were still used as guidelines for development of a new store. In the past, the proven prototypes were strictly adhered to by major retailers. Availability of a space that suited the requirements of the prototype would be a major part of a retailers storing strategy, i.e. where and when new store expansion would occur. In other words, maintaining the prototype was
paramount. It was important for shopping center owners and developers to understand prototypes of target tenants to match their space properly.
However, as the amount of available space for large format retailers has dwindled, particularly in the strongest suburban markets, the preference for modularity has been replaced with flexibility. Now, in a real way, retailers are beginning to look for the location first and decipher how to adapt the store to the given space, whether it is an irregular shape or multiple levels. This is known in the industry as “right-sizing”. The following table in Figure 16presents some anecdotal examples of contemporary prototype flexibility that retailers are using to enter new markets.