Publisher’s version / Version de l'éditeur:
European Journal of Nuclear Medicine and Molecular Imaging, 38, 7, pp.
1323-1334, 2011-03-05
READ THESE TERMS AND CONDITIONS CAREFULLY BEFORE USING THIS WEBSITE. https://nrc-publications.canada.ca/eng/copyright
Vous avez des questions? Nous pouvons vous aider. Pour communiquer directement avec un auteur, consultez la première page de la revue dans laquelle son article a été publié afin de trouver ses coordonnées. Si vous n’arrivez pas à les repérer, communiquez avec nous à PublicationsArchive-ArchivesPublications@nrc-cnrc.gc.ca.
Questions? Contact the NRC Publications Archive team at
PublicationsArchive-ArchivesPublications@nrc-cnrc.gc.ca. If you wish to email the authors directly, please see the first page of the publication for their contact information.
NRC Publications Archive
Archives des publications du CNRC
This publication could be one of several versions: author’s original, accepted manuscript or the publisher’s version. / La version de cette publication peut être l’une des suivantes : la version prépublication de l’auteur, la version acceptée du manuscrit ou la version de l’éditeur.
For the publisher’s version, please access the DOI link below./ Pour consulter la version de l’éditeur, utilisez le lien DOI ci-dessous.
https://doi.org/10.1007/s00259-011-1753-9
Access and use of this website and the material on it are subject to the Terms and Conditions set forth at
Viability and proliferation potential of adipose-derived stem cells
following labeling with a positron-emitting radiotracer
Elhami, Esmat; Goertzern, Andrew L.; Xiang, Bo; Deng, Jixian; Stillwell,
Chris; Mzengeza, Shadreck; Arora, Rakesh C.; Freed, Darren; Tian,
Ganghong
https://publications-cnrc.canada.ca/fra/droits
L’accès à ce site Web et l’utilisation de son contenu sont assujettis aux conditions présentées dans le site LISEZ CES CONDITIONS ATTENTIVEMENT AVANT D’UTILISER CE SITE WEB.
NRC Publications Record / Notice d'Archives des publications de CNRC:
https://nrc-publications.canada.ca/eng/view/object/?id=ee286119-daf4-4064-819c-5123181ae250 https://publications-cnrc.canada.ca/fra/voir/objet/?id=ee286119-daf4-4064-819c-5123181ae250
Viability and proliferation potential of adipose-derived stem cells following
labeling with a positron-emitting radiotracer
Esmat Elhami
1, 2, Andrew L. Goertzen
1, Bo Xiang
3, Jixian Deng
3, Chris Stillwell
3,
Shadreck Mzengeza
1, Rakesh C. Arora
4, Darren Freed
4and Ganghong Tian
3 (1) Department of Radiology, University of Manitoba, Winnipeg, Canada(2) Department of Physics, University of Winnipeg, 515 Portage Ave, Winnipeg, MB, R3B 2E9, Canada (3) Cardiac Studies Group, Institute for Biodiagnostics, National Research Council Canada, Winnipeg,
Canada
(4) Cardiac Science Program, St. Boniface General Hospital, Winnipeg, Canada
Abstract
Purpose Adipose-derived stem cells (ASCs) have promising potential in regenerative medicine and cell therapy. Our objective is to examine the biological function of the labeled stem cells following labeling with a readily available positron emission tomography (PET) tracer, 18F-fluoro-2-deoxy-D-glucose (FDG). In this work we characterize labeling efficiency through assessment of FDG uptake and retention by the ASCs and the effect of FDG on cell viability, proliferation, transdifferentiation, and cell function in vitro using rat ASCs.
Methods Samples of 105 ASCs (from visceral fat tissue) were labeled with concentrations of FDG (1– 55 Bq/cell) in 0.75 ml culture medium. Label uptake and retention, as a function of labeling time, FDG concentration, and efflux period were measured to determine optimum cell labeling conditions. Cell viability, proliferation, DNA structure damage, cell differentiation, and other cell functions were examined. Non-labeled ASC samples were used as a control for all experimental groups. Labeled ASCs were injected via tail vein in several healthy rats and initial cell biodistribution was assessed.
Results Our results showed that FDG uptake and retention by the stem cells did not depend on FDG concentration but on labeling and efflux periods and glucose content of the labeling and efflux media. Cell viability, transdifferentiation, and cell function were not greatly affected. DNA damage due to FDG
radioactivity was acute, but reversible; cells managed to repair the damage and continue with cell cycles. Over all, FDG (up to 25 Bq/cell) did not impose severe cytotoxicity in rat ASCs. Initial biodistribution of the FDG-labeled ASCs was 80% + retention in the lungs. In the delayed whole-body images (2–3 h
postinjection) there was some activity distribution resembling typical FDG uptake patterns.
Conclusion For in vivo cell tracking studies with PET tracers, the parameter of interest is the amount of radiotracer that is present in the cells being labeled and consequent biological effects. From our study we developed a labeling protocol for labeling ASCs with a readily available PET tracer, FDG. Our results indicate that ASCs can be safely labeled with FDG concentration up to 25 Bq/cell, without compromising their biological function. A labeling period of 90 min in glucose-free medium and efflux of 60 min in
complete media resulted in optimum label retention, i.e., 60% + by the stem cells. The initial biodistribution of the implanted FDG-labeled stem cells can be monitored using microPET imaging.
Keywords Cell labeling; Adipose-derived stem cells; 18F-FDG; PET; Cell tracking Abbreviations
ASCs Adipose-derived stem cells 18
F-FDG, FDG [18F]Fluoro-2-deoxy-D-glucose PET Positron emission tomography
Introduction
Stem cell therapy offers promising therapeutic benefits in treating various diseases [1–4], and yet, the outcome of the stem cell therapy is profoundly dependent on the method of cell delivery to the targeted region and maintaining viable cell function long after implantation [5]. Accurately monitoring the implanted stem cells in vivo is a key to understanding the mechanisms through which cell therapy works [6].
Noninvasive in vivo imaging techniques are potentially ideal in providing quantitative information about the biodistribution, proliferation, and transdifferentiation of the engrafted stem cells in the region of interest. This information is necessary to identify the optimum method of delivering sufficient numbers of stem cells to the targeted sites and optimize the therapeutic benefits while eliminating the undesired side effects of cell therapy.
Positron emission tomography (PET) is emerging as a reliable in vivo molecular imaging technique in clinical and preclinical studies due to its high sensitivity that allows detection of picomolar quantities [7, 8]. [18F]Fluoro-2-deoxy-D-glucose (FDG) is a glucose analogue and it is widely used in clinical oncology. FDG is preferably taken up by the metabolically hyperactive cancerous cells [9]. Therefore, FDG PET imaging is used for diagnosis, staging, and assessment of response to treatment in oncology patients. In addition, PET imaging with tracers other than FDG, but specific to cell proliferation and
transdifferentiation, has been applied in assessment of stem cell therapy in human and animal studies [10–13]. For example, thymidine, a deoxynucleoside is required for DNA synthesis and its fluorinated analogue γ′-deoxy-γ′-18
F-fluorothymidine (18F-FLT) is taken up by cells actively synthesizing DNA. Thus, 18
F-FLT PET imaging is used to determine cell proliferation [12]. Moreover, 9-(4-18
F-fluoro-3-hydroxymethylbutyl)guanine (18F-FHBG) is a radioactive substrate of herpes simplex virus 1 thymidine kinase (HSV1-tk). Cells expressing HSV1-tk would metabolize and accumulate the substrate and could therefore be identified on 18F-FHBG PET images [10–13]. Thus, a viral vector encoding a gene for
HSV1-tk is often used as a reporter to assess transdifferentiation and function of the HSV1-HSV1-tk-transfected cells.
The 18F PET tracers have a relatively short half-life (∼110 min) and may not be favorable tracers for long-term in vivo tracking. However, as a readily available tracer, FDG can be used as a tracer of choice to assess the initial biodistribution of those stem cells whose distribution has not been characterized previously. The cell biodistribution and optimal conditions for FDG labeling of adult stem cells has not been defined. Specifically, potential detrimental effects of FDG on viability, proliferation,
transdifferentiation, and function of adult stem cells have not been fully examined.
The present study was designed to: (1) characterize FDG uptake and label retention by adult stem cells in vitro to determine optimum labeling conditions; (2) determine whether PET probe-associated radioactivity affects viability, proliferation, transdifferentiation, and function of labeled cells; and (3) examine the feasibility of FDG PET imaging for initial biodistribution of implanted stem cells. As adipose-derived stem cells (ASCs) have demonstrated potential for clinical use, this cell type was chosen as a representative of adult-derived stem cells for use in this study [14, 15].
Materials and methods
The animals used in this study were treated with humane care in compliance with the Canadian Council on Animal Care Guide. The experimental protocols have been approved by the National Research Council of Canada Animal Care Committee.
Preparation of ASCs
ASCs were prepared according to the method developed by Zuk et al. [15] with modifications as
previously described [16]. In brief, subcutaneous adipose tissue (3–4 g) was obtained from the abdominal and inguinal regions of inbred male Lewis rats. The excised adipose tissue was washed extensively with phosphate-buffered saline (PBS, HyClone, Logan, UT, USA) to remove debris and blood cells. The
adipose tissue was minced and digested with collagenase I (2 mg/ml, Worthington Biochemical Corp., Lakewood, NJ, USA) at 37°C for 20–30 min. Active collagen was neutralized by adding DMEM (HyClone) containing 15% fetal bovine serum (FBS, HyClone). The digested adipose tissue was filtered with a 100-μm strainer to eliminate the undigested fragments. The cellular suspension was centrifuged at 1,000 g for 10 min. The cell pellets were resuspended in DMEM containing 15% FBS and cultivated for 48 h at 37°C in 5% CO2. Unattached cells and debris were removed, and fresh medium was added to the adherent cells. The cells used for labeling analysis were at passage 1, and samples of 1.5–β × 105 ASCs were prepared.
Assessment of 18F-FDG uptake by ASCs 18
F-FDG was supplied by the Great-West Life PET/CT Imaging Centre, located at Health Sciences Centre, Winnipeg, MB, Canada, which receives its FDG supply from the Cross Cancer Institute at the University of Alberta (Edmonton, AB, Canada). ASCs were labeled with FDG following protocols similar to those described previously [17]. The experimental procedures are summarized in Table 1. The activities of FDG administered to the cell samples were measured with a standard dose calibrator (Capintec CRC 10, Capintec Inc., Ramsey, NJ, USA). As FDG is a glucose analogue, the ASCs were incubated in glucose-free medium for 30 min prior to labeling with FDG. Note that the terms label and FDG are used interchangeably.
Table 1 Detailed specifications of the in vitro measurements in labeling ASCs with 18F-FDG
Exp. Measurements ASCs,
samples Before labelinga 18 F-FDG (MBq) Labeling mediuma (0.75 ml)/time Postlabeling 1 Label uptake 1.5 × 10⁵ Gluc-free/30 min 0.18 Gluc-free/5, 30, 60, 90, 120 min
Standard washb, lyse cells 6 replicates 2 Label uptake 1.5 × 10⁵ - 0.18 Gluc+/5, 30, 60, 90, 120 min
Standard washb, lyse cells 6 replicates 3 Label uptake 1.5 × 10⁵ Gluc-free/30 min 0.18, 0.56, 1.78, 3.62, 8.29
Gluc-free/90 min Standard wash b , lyse cells 6 replicates 4 Label retention 1.5 × 10⁵
Gluc-free/30 min 0.56 Gluc-free/90 min
Label removal 1× PBS wash; effluxa: (gluc-free)/5, 30, 120, 240 min standard wash, lyse cells 6 replicates 5 Label retention 1.5 × 10⁵ - 0.56 Gluc+/90 min Label removal 1× PBS wash; effluxa: (gluc+)/5, 30, 120, 240 min standard wash, lyse cells
6
replicates
6 Cell numbers (trypan blue exclusion assay)
β × 104 Gluc-free/30 min 0, 1.85, 3.40, 7.40
Gluc-free/90 min Standard wash, cell suspension, trypsinized 6 replicates 7 DNA damage 1.5 × 10⁵
Gluc-free/30 min 0, 3.40 Gluc-free/90 min
Standard wash, comet assay
3
Exp. Measurements ASCs, samples Before labelinga 18 F-FDG (MBq) Labeling mediuma (0.75 ml)/time Postlabeling 8 Cell function 1.5 × 10⁵
Gluc-free/30 min 0, 4.15 Gluc-free/90 min
Standard wash, RT-PCR procedure 3 replicates 9 Transdifferentiation (adipo: oil red O staining)
1.5 × 10⁵
Gluc-free/30 min 0, 3.40 Gluc-free/90 min
Standard wash, adipogenic and osteogenic inductions 4
replicates
RT-PCR reverse transcription polymerase chain reaction
a
Incubation conditions: 37°C, 5% CO2 and 20% O2 b
Standard wash refers to medium removal and wash twice with PBS
The label uptake by the ASCs was assessed through the following measurements in samples of 1.5×10⁵ cells in 0.75 ml medium: (1) cells were labeled with 0.18 MBq of FDG for different labeling periods, i.e., 5, 30, 60, 90, and 120 min; (2) under the same condition as in condition 1, the culture medium was either glucose-containing or glucose-free medium; and (3) cells were labeled with 0.18, 0.56, 1.78, 3.62, and 8.29 MBq of FDG (1–55 Bq/cell) in glucose-free medium for 90 min. The glucose-containing medium will be referred to as complete medium.
At the end of each incubation period the FDG-containing medium was removed and the ASCs were washed twice with PBS. These steps will be referred to as standard wash procedures. Supernatants were collected and the cells were lysed with 0.1% sodium dodecyl sulfate (SDS) (Sigma-Aldrich) for
subsequent measurement of FDG activities and protein content with Bradford reagent. The radioactivity was measured in the dose calibrator or a well counter (Laboratory Technologies Inc., Maple Park, IL, USA). The ratio of radioactivity in the cell lysate to the sum of radioactivities in the cell lysate and supernatant was expressed as the label uptake by the cells. The uptake ratios were normalized to microgram of protein in respective samples to account for cell loss during an experiment. All
measurements of FDG radioactivities were corrected for its natural decay. The well counter was properly cross-calibrated to the dose calibrator to provide radioactivity measurements in units of becquerel. Assessment of 18F-FDG retention by ASCs
ASCs were first labeled with 0.56 MBq of FDG in glucose-free medium for 90 min. The glucose-free medium was used to enhance uptake of FDG. Following the 90-min labeling, the stem cells were washed with FDG-free PBS and cultured in either FDG-free glucose-free or FDG-free complete medium. Efflux of FDG was determined by measuring the radioactivity of the medium collected at 5, 30, 120, and 240 min after FDG removal, i.e., efflux periods. At the end of each efflux period, the cells were lysed and the radioactivities in the cell lysate and efflux supernatant were measured. Percentage of FDG retention was expressed as the radioactivity in cell lysate divided by the total radioactivities in the cell lysate and the supernatant × 100%.
Assessment of 18F-FDG on viability and proliferation of ASCs
Cell viability was measured using the trypan blue (0.4%) exclusion assay. Samples of ASCs (2×10⁴ cells/sample) were labeled in a glucose-free medium with 0, 1.85, 3.70, and 7.40 MBq of FDG (∼45– 185 Bq/cell) for 90 min. Unbound radiotracer was washed with the standard procedure and the labeled cells were cultivated in FDG-free complete medium. The number of live and dead cells was determined immediately, 1, 2, and 3 days after cell cultivation. Cell viability was expressed as the number of viable cells divided by the total cell count × 100%. Cell proliferation was assessed by cell numbers measured at the different points of time.
Assessment of DNA damage
To examine the effect of FDG labeling on DNA integrity, ASCs (1.5×10⁵ cells/sample) were incubated with 0, 1.85, 3.70, and 7.40 MBq of FDG (12–50 Bq/cell) in glucose-free medium for 90 min. Following the original protocol by Olive and Banáth [18], the comet assay was performed at 1 and 24 h after FDG labeling to assess the DNA damage in the labeled cells.
Induction of differentiation in ASCs
To assess effects of radioactivity on transdifferentiation capacity of adult stem cells, samples of ASCs were first incubated in glucose-free medium with 3.70 MBq of FDG (25 Bq/cell) for 90 min. The cells were then collected and subjected to adipogenic and osteogenic inductions using methods described
previously [19]. The induction conditions are summarized in Table 2. At the end of each induction, expressions of genes specific for adipocytes (lipoprotein lipase, LPL, and peroxisome proliferator-activated receptor- , PPAR- ) and osteocytes (secreted phosphoprotein 1, SPP-1, and osterix, OSX) were determined using reverse transcription polymerase chain reaction (RT-PCR). Expression of vascular endothelial growth factor (VEGF), hepatocyte growth factor (HGF), and insulin-like growth factor (IGF-I) by ASCs were assessed with RT-PCR to determine effects of the radioactivity on function of the stem cells.
Table 2 Induction type and components used in ASC differentiation Type of
induction Induction components
Induction period
Adipogenic induction
DMEM, 5% FBS, 33 mM biotin, 17 mM pantothenate, 10 μM bovine insulin, 250 μM isobutylmethylxanthine, β00 μM indomethacin, 1 μM
dexamethasone, 5 μg/ml streptomycin, 5 U/ml penicillin
12 days
Osteogenic induction
DMEM, 10% FBS, 10 mM -glycerophosphate, 50 μM ascorbate-2-phosphate, 10 nM 1,25(OH)2 vitamin D3, 5 μg/ml streptomycin, 5 U/ml penicillin
28 days
Adipogenic and osteogenic differentiation of ASCs were also evaluated histochemically using methods described previously [16]. Adipogenic differentiation was also evaluated by staining the cells with oil red O stain, which stains intracellular lipid deposits red. The intracellular lipid level is closely related to
adipogenic differentiation in adult stem cells [19]. Osteogenic transdifferentiation of ASCs was assessed using nitroblue tetrazolium chloride/bromo-4-chloro-3-indolyl phosphate toluidine salt that stains alkaline phosphates (AP) gray. The stained ASCs were then examined under a light microscope. For all
measurements, a p value of 0.05 was considered for significant difference between groups. Imaging of 18F-FDG-labeled ASCs in vivo
As a proof of principle in using FDG as a labeling agent for the ASCs for application in stem cell therapy of heart failure models, and developing optimum imaging protocols, the biodistribution studies were carried out with microPET imaging of healthy rats injected with 18F-FDG-labeled ASCs. Following our in vitro labeling protocols, four samples of 3×10⁵ ASCs were incubated in 5 ml glucose-free medium containing 3.70 MBq/ml of FDG (∼62 Bq/cell) for 60–90 min. After the efflux period (30–60 min) and medium removal, cells were trypsinized. Cell concentration and viability were measured using trypan blue exclusion essay; +90% of cells were viable. From the cell suspension, 106 cells in 1 ml glucose-free and serum-free medium were prepared for injection into the animal subjects. Total activity of the labeled cells was measured with a dose calibrator.
Inbred Lewis rats (n = γ) were anesthetized with β% isoflurane and the respiration was controlled with a rodent ventilator. Labeled stem cells were injected via intravenous (i.v.) tail vein (with total FDG activity of 2.37, 2.44, and 2.92 MBq, corrected for syringe residual). Image data were acquired on a microPET P4 scanner (Siemens Preclinical Solutions, Knoxville, TN, USA) with system settings at 350–700 keV and
6-ns coincidence timing window. This system has an axial field of view (FOV) of 7.8 cm, 19-cm diameter transaxial FOV with spatial resolution of 1.8 mm at the center of the FOV [20]. Emission data were acquired for 20–30 min with the heart at the center of the FOV followed by a transmission scan for attenuation correction using a 57Co point source. Whole-body emission data were acquired using 3–4 bed positions with 10- to 20-min emission and transmission scans per bed position. List-mode raw data were sorted using typical histogram protocols and images were reconstructed using Fourier rebinning followed by 2-D filtered backprojection (FBP) with normalization and attenuation corrections applied to the data. Due to low statistics, scatter correction was not applied.
Volume of interest (VOI) analysis was performed using ASIPro ver. 6.3.3.0 software. VOIs were drawn on the transverse planes for each organ (slice thickness 1.2 mm) and total activities were then determined. The percentage of the VOI total value to the injected dose (ID%) was determined. All activities were decay corrected for 18F physical decay. For qualitative comparison, several animals were injected via tail vein with free FDG in 1 ml of PBS serum. The animals were imaged 45–60 min postinjection, following similar protocols for whole-body imaging. These images were not quantified.
Results
Efficiency of 18F-FDG uptake by ASCs
FDG uptake per microgram protein as a function of labeling period and glucose content are shown in Fig. 1. There are significant (p < 0.05) differences in the FDG uptakes among the ASCs incubated at different labeling periods.
In general, FDG uptake increased as labeling period prolonged, i.e., the uptake (% per μg protein) at 5, 30, 60, 90, and 120 min labeling period is 0.19, 0.35, 0.46, 0.49, and 0.66, respectively, in labeling with glucose-free medium, and 0.02, 0.08, 0.11, 0.14, and 0.13, when complete medium was used. The total label uptake (%) ranged from 6.2 to 31% for cells labeled in glucose-free medium and was 0.5–5.0% for those labeled in complete medium.
There was no significant difference in FDG uptake at the five concentrations measured (p > 0.05). The uptake (% per μg protein) was 0.49, 0.5β, 0.48, 0.43, and 0.49 for labeling with 0.18, 0.56, 1.78, 3.62, and 8.29 MBq of FDG, respectively.
18
F-FDG retention in ASCs
Retention of FDG in ASCs following labeling at different conditions is summarized in Fig. 2. The presence of glucose in the efflux medium significantly reduced the retention of FDG in the stem cells, similar to the effect measured in FDG uptake. Label retention was 93, 85, 85, and 86% (or 94, 78, 54, and 60%) at efflux periods of 5, 30, 120, and 240 min, respectively, with glucose-free (or complete) efflux medium. From the label retention measurements a labeling period of 90 min in glucose-free medium and efflux of 60 min in complete media resulted in 60% + label retention by the stem cells.
Fig. 1 Label uptake (% per μg protein) by rat ASCs as a function of labeling period when cells were labeled with 0.18 MBq of 18
F-FDG in 0.75 ml glucose-free media (open bars) or complete media (solid bars). All activities are corrected for 18
F-FDG physical decay. Each bar represents the mean value + SD of 6 replicates
Fig. 2 Label retention (%) by ASCs as a function of efflux periods when cells were labeled with 0.56 MBq of 18F-FDG for 90 min in 0.75 ml glucose-free medium: the labeled cells effluxed in glucose-free media (open bars) or complete media (solid bars). All activities are corrected for 18F-FDG physical decay. Each bar represents the mean value + SD of 6 replicates
Effects of 18F-FDG on cell viability
The results of cell viability (live/total cells %) measured following FDG labeling is summarized in Table 3. Cell viability did not change significantly as the amount of FDG changed from 0 to 7.40 MBq (p > 0.05). Quantitative and pictorial results of cell proliferation and change in cell size are shown in Fig. 3 and Fig. 4, respectively. Total number of cells over 3 days postlabeling demonstrate the rate of cell division and proliferation (Fig. 3a) which shows a proportional relationship with cell size as a function of time and FDG activity (Fig. 3b). As the amount of FDG increased, the average size of the viable ASCs increased, corresponding to cell cycle arrest and decrease in the total number of cells, with significant differences between no-FDG and 7.40-MBq data in 2–3 days postlabeling.
Table 3 Results of trypan blue exclusion assay for measuring cell viability (live/total cells %) in control (no
FDG) and FDG-labeled cells; the values represent the mean values ± SD of 6 replicates in each group
Time postlabeling Control (no FDG) 1.85 MBq 3.40 MBq 7.40 MBq 18 F-FDG 0 h 97 ± 6 96 ± 7 96 ± β 96 ± 4 24 h 99 ± 1 99 ± 1 98 ± β 98 ± β 48 h 97 ± 4 96 ± γ 95 ± γ 98 ± β 72 h 99 ± β 99 ± 1 99 ± β 99 ± β
Fig. 3 Results from cell viability measurements using trypan blue dye exclusion assay; total number of cells (a) and cell size (b) of labeled ASCs as function of time. Cells were labeled with 0, 1.85, 3.70, and 7.40 MBq of 18
F-FDG in 0.75 ml of glucose-free medium for 90 min. Each bar represents mean value + SD of 6 replicates
Fig. 4 Microscopic photos of lenti-eGFP ASCs obtained from cell viability measurements, using inverted fluorescent microscope (Axio Observer.Z1, Zeiss, Jena, Germany); control group at day 0 (a) and day 3 (b), ASCs labeled with 7.40 MBq of 18F-FDG at day 0 (c) and day 3 (d) postlabeling. Increase in the cell size is visible as the amount of 18F-FDG increases from 0 to 7.40 MBq
Figure 4a–d present microscopic pictures of the cells labeled with 0 and 7.40 MBq of FDG at day 0 and day 3; the increase in cell size is visible on day 3 in the FDG-labeled ASCs.
Effect of 18F-FDG labeling on DNA integrity
The results of the damage to the DNA structure are shown in Fig. 5. In the microscopic pictures of the individual cells, the DNA damage is depicted as a comet tail (Fig. 5a–d). This artifact is visible for the case of cells labeled with 7.40 MBq of FDG at 1 hr after label removal (Fig. 5c). Quantitative data are presented as percentage of damaged cells to the total number of cells in Fig. 6e. The percentage of the cells with DNA damage increased as the amount of FDG radioactivity increased. The percentage of the damaged DNA cells was significantly lower at 24 h than immediately postlabeling (Fig. 5e), i.e., 0.3– 92.9% at 1 h vs 1.5–15.3% at 24 h postlabeling with 0–7.40 MBq of FDG.
Fig. 5 Results of DNA damage in labeled ASCs using the comet assay at 1 or 24 h postlabeling. Top row is control group at 1 h (a) and 24 h (b) postlabeling. The bottom row presents the cells labeled with 7.40 MBq of 18F-FDG at 1 h (c) and 24 h (d) postlabeling. The extent of the comet tail is mostly apparent in c, also indicated in the plot (e). There is a significant difference between the two data sets (p < 0.05), indicating DNA damage induced by 18F-FDG is not permanent and damaged cells are largely repaired
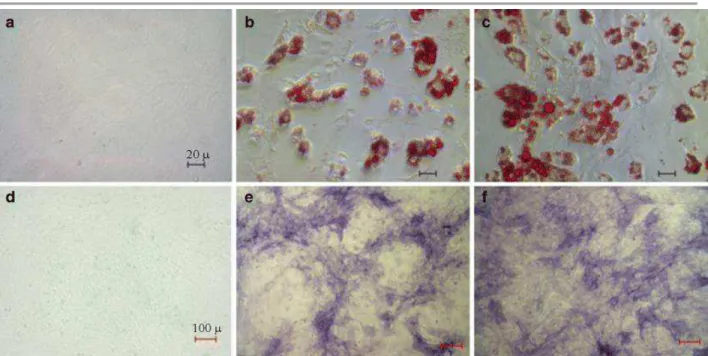
Fig. 6 Microscopic pictures of histochemical assays in adipogenic-induced ASCs using oil red O staining (top) and in osteogenic-induced ASCs using alkaline phosphate staining (bottom): non-induced, not-labeled (a, d); induced, 18F-FDG-labeled (3.70 MBq, labeled for 90 min) (b, e); induced, not-labeled (c, f). Concentration of oil red O stains represents the intracellular lipid deposits in ASCs. Suppression of adipogenic expression in the induced and FDG-labeled cells is visible. 18F-FDG did not affect the osteogenic expression in the ASCs. The pictures were taken with ×400 magnifications (top) and ×100 magnifications (bottom)
Effect of 18F-FDG on cell differentiation and function
Qualitative results of histochemical staining for adipogenic and osteogenic transdifferentiation are summarized in Fig. 6. Non-induced ASCs with a complete absence of a lipid drop served as a negative control (Fig. 6a). ASCs subjected to adipogenic induction exhibited a number of lipid drops in the intracellular compartment (Fig. 6c), as one of the indicators for a successful adipogenic differentiation
[19], while the 18F-FDG-labeled cells subjected to adipogenic induction had significantly less lipid drops (Fig. 6b). The average optical density (OD) in FDG-labeled ASCs (3.70 MBq) was 25% lower than those not labeled (data not shown). In the osteogenic group, the cells were stained for AP, a marker of the osteocytes. Both FDG-labeled and non-labeled ASCs showed similar results of AP staining; the difference in the OD results could not be quantified from the microscopic pictures (Fig. 6e–f).
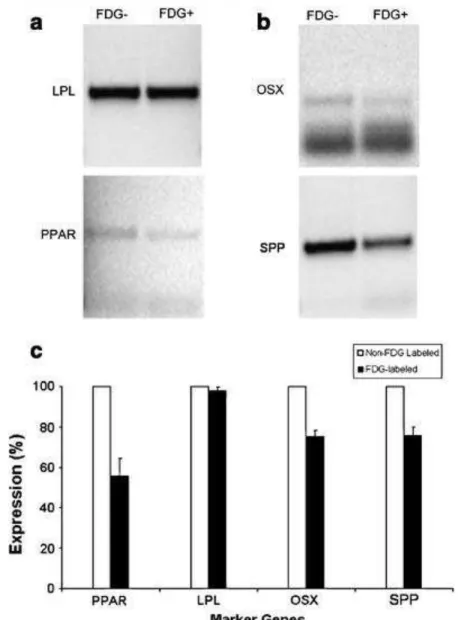
Figure 7 shows expressions of genes specific for either adipogenic or osteogenic transdifferentiation in the 18F-FDG-labeled and non-labeled ASCs. As to adipogenic differentiation, the 18F-FDG-labeled and non-labeled ASCs showed a similar expression of LPL, but the PPAR expression is significantly lower in the 18F-FDG-labeled ASCs than in the non-labeled ASCs (p < 0.05). Expression of both OSX and SPP (marker genes for osteogenic transdifferentiation) was lower in the 18F-FDG-labeled and control ASCs (p < 0.05).
Fig. 7 RT-PCR electrophoresis showing expression of specific genes in non- and FDG-labeled ASCs exposed to different inductions: adipogenic (a) and osteogenic (b). ASCs were labeled with 3.70 MBq of 18
F-FDG for 90 min. The intensity of bands corresponding to molecular weights of the genes correlates with expression of that gene. In the presence of 18F-FDG the expression decreases for all genes, with the most significant decrease in PPAR expression (c)
Effects of FDG labeling on cell function was assessed by monitoring of cytokine secretion (VEGF, IGF, transforming growth factor beta, TGF- ). Levels of the growth factors secreted by FDG-labeled and control ASCs are shown in Fig. 8. Evidently, levels of the growth factors were slightly lower in the FDG-labeled ASCs than in the control ASCs (Fig. 8b). OCT4 expression (a stem cell gene marker) was significantly lower in the FDG-labeled ASCs than in the control ASCs. The values in the plot represent ratios of the mRNA concentrations of a cytokine in each group of cells (labeled or non-labeled) to that of glyceraldehyde-3-phosphate dehydrogenase (GAPDH), which was used as an internal control.
Fig. 8 RT-PCR results of cytokines from control (no FDG) and FDG-labeled ASCs. RNAs were extracted after ASCs were labeled with 4.15 MBq of FDG for 90 min. RT-PCR experiments were performed in triplicate. a One result of RT-PCR electrophoresis for each cytokine; marker, DNA molecular size and the blackest band is 600 bp. Control (no FDG): from ASCs not labeled with FDG; FDG+: from ASCs labeled with FDG. b The results from statistical analysis of mRNA concentrations of four cytokines in the non-labeled (open bars) and non-labeled cells (solid bars) presented as ratios to mRNA concentrations in the GAPDH band in the corresponding groups. The ratio values are then normalized to the response in the non-labeled groups. Each bar represents the mean value + SD of γ replicates
In vivo distribution of 18F-FDG-labeled ASCs
VOI analysis of the images of the animals with the heart at the center of the FOV, acquired immediately after injection of the FDG-labeled stem cells via tail vein injection, showed that on average labeled stem cells were retained in the lungs with 84 ± 14 ID% (range of 76–100%). The data were corrected for 18
F physical decay and attenuation of 511-keV photons. Significant retention of labeled cells in the lungs made it impossible to accurately quantify the labeled stem cells retained in the neighboring organs, including myocardium, which is the target organ in the stem cell therapy in a congestive heart failure model.
Delayed images of the lungs at 21, 81, and 175 min postinjection are shown in Fig. 9. It appears that the activity present in the lungs is decreasing, presumably due to either efflux of FDG from the retained stem cells in the lungs or migration of the labeled cells. Delayed whole-body images acquired at 2–3 h
postinjection showed accumulation of activity in the Harderian glands, kidneys, and bladder in addition to the activity retained in the lungs. The increase in activity outside of the lungs resembled the typical FDG biodistribution pattern seen in control animals injected intravenously with free FDG. However, no direct measurement was performed to determine the exact chemical form of the radioactivity present in the kidneys or bladder.
Fig. 9 Coronal cross section of the lungs in a rat injected with 1.5×10718F-FDG-labeled ASCs (2.67 MBq) via i.v. tail vein injection; from left to right, immediately after injection (time reference), 21, 81, and 175 min postinjection. The image data, reconstructed with FBP algorithm are corrected for 18F physical decay and attenuation of 511-keV photons. A decrease in activity intensity suggests either clearance of ASCs from the lungs or efflux of 18F-FDG from the retained ASCs in the lungs
Discussion
Monitoring of the implanted stem cells is paramount in stem cell therapy, enabling one to assess the contribution of these cells to organ function and longitudinal evaluation of durability of effect. The labeling tracer should not modify/compromise the functionality of the labeled stem cells while being monitored with in vivo imaging techniques. In this study, we have evaluated the potential of using FDG as a tracer for in vivo tracking of ASCs using microPET imaging in a rodent model.
We have found in this study that FDG uptake by the ASCs depended on the labeling period and glucose content of the labeling medium. Labeling efficiency (uptake % per μg protein) increased as the labeling period was increased from 5 to 90 min with significant changes. Label uptake was improved by a factor of 5 when cells were labeled in glucose-free medium compared to labeling in complete medium, indicating that FDG and glucose are competing for transporters on the cell membrane to be taken up by the ASCs as expected. The cells were incubated in free medium for 30 min prior to labeling in a glucose-free medium; thus, the only source of glucose was FDG during the 90-min labeling period. As a result, as the amount of FDG increased, so did the rate of FDG transport to the glucose-avid cells, but uptake values (ratio of FDG in the cells to that in the cells and supernatant) remained constant. It should be noted that the values of FDG uptake (% per μg protein) as a function of FDG activity (∼0.50%) are in good agreement with uptake values for the 90-min labeling period in Fig. 1 (0.49%), in cells labeled with FDG in glucose-free medium. These results suggest a period of equal intra- and extracellular FDG concentration at 90 min. Therefore, FDG labeling of ASCs for 90 min in glucose-free medium will provide an optimum uptake considering the trade-off between label uptake and 18F half-life (109.77 min).
Label retention demonstrates the equilibrium between FDG uptake and efflux rates of the unbound (non-phosphorylated) FDG inside the cells. FDG is actively transported into the cells via glucose transporters. Once inside the cells, FDG goes through the phosphorylation process, similar to glucose, forming FDG-6-PO4, but unlike glucose, FDG cannot go through glycolysis and further metabolism; thus, it is trapped inside the cells. In the efflux process, some of the unbound or non-phosphorylated FDG washes out. When labeled cells were effluxed in glucose-free medium, FDG retention stabilized as the efflux period varied from 30 min to 4 h. Also, glucose-avid cells better retain the FDG in the absence of glucose competing for transport and phosphorylation. On the other hand, in the presence of glucose in the efflux medium, FDG retention decreased over the same period of time. While it is not expected that
phosphorylated FDG can easily efflux out of the cells, there are other possible reasons for higher rates of FDG efflux in the presence of glucose. For example, due to the presence of sufficient glucose-6-PO4, or saturation of phosphorylation processes, FDG taken up by the cells is not phosphorylated.
The difference in FDG retention by the ASCs in glucose-free or glucose-containing media becomes important for labeling cells used for in vivo studies. Upon the injection of the labeled cells into the body,
the environment is not glucose-free any more and unbound or non-phosphorylated FDG can still efflux out of the cells. Therefore in this study, for in vivo transfer of labeled cells, complete medium was used for the efflux periods to ensure optimum label retention by the cells.
Even though the viability of the labeled cells up to 3 days was not changed significantly, the change in the size of the cells became significant at the higher FDG concentrations (185 Bq/cell). The increase in the cell size resulted in delays in the cell division processes, which is demonstrated as a decrease in the total number of cells at 3 days postlabeling (Fig. 4). In the control group (no FDG), the number of cells
increased, i.e., cells continued with regular cell division cycles. On the other hand, in the FDG-labeled cells, as the amount of labeling FDG increased (12–50 Bq/cell), the total number of cells decreased. The results of the comet assay demonstrated that FDG radioactivity inevitably leads to acute DNA single-strand breaks in the ASCs, represented by the large percentage of damaged cells at 1 h postlabeling (Fig. 5e). However, after 24 h the number of damaged cells significantly decreased, suggesting that a large percentage of damaged cells manage to repair and continue with cell division cycles, as presented in cell viability and proliferation results (Fig. 3).
The radiation dose to the cells from the 18F radioactivity can be estimated by considering the dose due to the positron emission only. Due to the small sample volume (i.e., 0.75 ml) and low effective atomic number of the cells, the dose due to 511-keV photons is not considered. The total dose rate in units of J/kg/s or Gy/s is then determined from the following formula:
(1)
where A is the activity in Bq, E β+ is the mean positron energy (0.211 MeV), B.R. is the branching ratio of the positron emission in 18F decay (0.97), and 1.602×10 −13 (J/MeV) is the conversion factor. Total dose
(J/kg or Gy) is then determined by inserting the dose rate from t = 0 to t = ∞, i.e., division of dose rate to decay constant of 18F:
(2) Therefore, labeled ASCs with 1.85, 3.70, and 7.40 MBq of FDG were exposed to doses of 0.77, 1.54, and
3.08 Gy, respectively, using the above equations. Even though the radiotoxicity effects on the cells depend on the cell type and type of radiation [21], our results showed that the exposed doses do not impose severe long-term cytotoxicity, and labeled cells continue with cell division cycles. These findings are particularly important for our future in vivo studies, where differentiating cells might strongly take up 18
F tracers, i.e., 18F-FLT, 18F-FHBG, etc., bearing in mind that in vivo concentrations achieved are not expected to be as high as those measured in vitro.
Expression of specific genes in the stem cells subjected to adipogenic and osteogenic inductions was not significantly different in the FDG-labeled cells (with 4.15 MBq) to that of the non-labeled cells. However, secretion of VEGF, TGF- 1 and OCT4 cytokines was significantly suppressed in FDG-labeled ASCs compare to that in the non-labeled cells by 12, 16, and 20%, respectively. These findings suggest an upper limit for an optimum FDG concentration, i.e., 4.15 MBq (28 Bq/cell) for labeling of ASCs in order to leave all cell functions of the ASCs intact.
The animal microPET image data in our study were primarily used for qualitative assessment and developing imaging protocols for future in vivo studies. Biodistribution of the FDG-labeled ASCs was different from that of free FDG, when both delivered via intravenous tail vein injection. Immediately following injection, the FDG-labeled stem cells were primarily retained in the lungs, with appearance of activities in the brain, Harderian glands, kidneys, and bladder in the delayed whole-body images 2–3 h postinjection. On the other hand, free FDG upon tail vein injection resulted in minimal uptake in the lungs and a biodistribution pattern typically seen for free FDG, with pronounced uptake in the brain, Harderian glands, myocardium, and renal system.
Our findings from the biodistribution of FDG-labeled ASCs were in agreement with findings of similar studies in which methods of optimum cell delivery to targeted organs were explored [22, 23], i.e.,
intravenous tail vein injection resulted primarily in retention of the cells in the lungs. Cells delivered via tail vein (venous pathway) pass through the heart into the lungs via the pulmonary artery, where their large size restricts their passage through the capillaries, resulting in retention in the lungs. However, over time, radioactivity concentration in the lungs decreased which suggests either the cells are migrating or FDG is washing out of the cells and appearing in other organs, such as the brain, Harderian glands, and bladder, resembling a typical FDG biodistribution pattern [24]. In another words, the delayed whole-body images (2–3 h postinjection) do not necessarily describe the biodistribution of the stem cells labeled in the body, but rather represent a combination of the stem cell distribution and any redistributed FDG. Therefore, only the initial biodistribution of FDG-labeled stem cells could be quantified in the period immediately
postinjection.
Although FDG is commonly used in PET imaging for oncology staging to map out the distribution of highly metabolic regions in clinical patients, it can serve as a useful tracer in stem cell therapy as it is a readily available tracer. ASCs have potential applications in the stem cell therapy of a congestive heart failure model. Our study showed that the biological function of the ASCs was not significantly affected by labeling with FDG concentrations measured in this study, including cell viability and proliferation (45– 185 Bq/cell), DNA integrity (12–50 Bq/cell), differentiation (25 Bq/cell), and cell functions (28 Bq/cell). Therefore, an FDG concentration of 25 Bq/cell, in which transdifferentiation of the stem cells was not significantly compromised, can be considered as a safe FDG labeling concentration for ASCs. From this study we developed a protocol for labeling rat ASCs with FDG resulting in optimum label retention and insignificant cytotoxicity for in vivo cell transfer. The optimum labeling condition we observed was 30 min incubation in glucose-free medium prior to labeling, 90 min labeling with FDG concentrations up to 25 Bq/cell in glucose-free medium, and 60 min efflux in complete medium. All incubation conditions are 37°C and 5% CO2. The limitation of using FDG as a labeling tracer is in long-term in vivo monitoring of the labeled cells. In addition to its short half-life, the non-phosphorylated 18 F-FDG can efflux out of the labeled cells over time resulting in a non-ASCs-associated biodistribution of radioactivity in the body. Therefore, FDG can only be used for characterization and quantification of the
initial biodistribution of the labeled cells. As our in vivo studies using microPET imaging demonstrated, tail
vein injection of the labeled cells can only be reliably quantitative at the period immediately after injection. Qualitatively, biodistribution of the labeled stem cells and that of free FDG were markedly different. Also, tail vein injection is not the optimum method for cell delivery to the myocardium for application to cardiac stem cell therapy, as the majority of the cells are retained in the lungs. Other methods of cell delivery and longer-lived PET tracers are planned to be studied.
Conclusion
In this study we labeled rat ASCs with a readily available PET tracer, 18F-FDG, and examined, for the first time, the biological function of the FDG-labeled stem cells. The labeling efficiency procedures were determined and the effects of FDG radioactivity on the biological functions including cell viability,
proliferation, and transdifferentiation were examined. Biodistribution studies were carried out by injecting animals with labeled stem cells via intravenous tail vein injection. Whole-body imaging was acquired on a microPET P4 scanner.
Our study demonstrates that: (1) FDG retention by the ASCs is independent of the amount of FDG concentration, but largely depends on the labeling and efflux periods, as well as glucose content of the medium; (2) for in vivo transfer, labeling in glucose-free medium for 90 min followed by 60 min efflux in complete medium resulted in optimum label retention (60%+) by ASCs; (3) cytotoxicity imposed by FDG (at concentrations up to 25 Bq/cell) on the biological function of ASCs is not significant; and (4) the initial biodistribution of transplanted stem cells can be reliably monitored and quantified using microPET imaging in a rodent model.
Acknowledgments The authors thank the reviewers of this manuscript for their insightful comments and suggestions. This work has been supported by a Canadian Institute of Health Research (CIHR) Emerging Team Grant in Regenerative Medicine and Nanomedicine.
Conflicts of interest
None.
References
1. Wollert KC, Drexler H. Clinical applications of stem cells for the heart. Circ Res 2005;96:151–63
2. Rosenthal N. Prometheus’s vulture and stem-cell promise. N Engl J Med 2003;349:267–74. 3. Kim Y, Han H. High-glucose-induced prostaglandin E(2) and peroxisome proliferator-activated
receptor delta promote mouse embryonic stem cell proliferation. Stem Cells 2008;26(3):745–55 4. Baker M. Banking on the future of stem cells. Nature 2008;452(7185):263
5. Forrester JS, Makkar RR, Marbán E. Long-term outcome of stem cell therapy for acute myocardial infarction: right results, wrong reasons. J Am Coll Cardiol 2009;53(24):2270–2 6. Thomson M, Wall DM, Hicks RJ, Prince HM. In vivo tracking for cell therapies. Q J Nucl Med Mol
Imaging 2005;49:339–48.
7. Zhou R, Acton PD, Ferrari VA. Imaging stem cells implanted in infarcted myocardium. J Am Coll Cardiol 2006;48(10):2094–106
8. Terrovitis J, Lautamäki R, Bonios M, Fox J, Engles JM, Yu J, et al. Noninvasive quantification and optimization of acute cell retention by in vivo positron emission tomography after intramyocardial cardiac-derived stem cell delivery. J Am Coll Cardiol 2009;54(17):1619–26
9. Clavo AC, Brown RS, Wahl RL. Fluorodeoxyglucose uptake in human cancer cell lines is increased by hypoxia. J Nucl Med 1995;36(9):1625–32
10. Green LA, Nguyen K, Berenji B, Iyer M, Bauer E, Barrio JR, et al. A tracer kinetic model for 18F-FHBG for quantitating herpes simplex virus type 1 thymidine kinase reporter gene expression in living animals using PET. J Nucl Med 2004;45(9):1560–70
11. Yaghoubi SS, Couto MA, Chen CC, Polavaram L, Cui G, Sen L, et al. Preclinical safety
evaluation of 18F-FHBG: a PET reporter probe for imaging herpes simplex virus type 1 thymidine kinase (HSV1-tk) or mutant HSV1-srγ9tk’s expression. J Nucl Med β006;47(4):706–15
12. Vesselle H, Grierson J, Muzi M, Pugsley JM, Schmidt RA, Rabinowitz P, et al. In vivo validation of γ′-deoxy-γ′-[18F]fluorothymidine ([18F]FLT) as a proliferation imaging tracer in humans:
correlation of [(18)F]FLT uptake by positron emission tomography with Ki-67 immunohistochemistry and flow cytometry in human lung tumors. Clin Cancer Res 2002;8(11):3315–23
13. Bading JR, Shields AF. Imaging of cell proliferation: status and prospects. J Nucl Med 2008;49(Suppl 2):64S–80S
14. Fraser J, Wulur I, Alfonso Z, Hedrick MH. Fat tissue: an underappreciated source of stem cells for biotechnology. Trends Biotechnol 2006;24(4):150–4
15. Zuk PA, Zhu M, Ashjian P, De Ugarte DA, Huang JI, Mizuno H, et al. Human adipose tissue is a source of multipotent stem cells. Mol Biol Cell 2002;13(12):4279–95
16. Wang L, Deng J, Wang J, Xiang B, Yang T, Gruwel M, et al. Superparamagnetic iron oxide does not affect the viability and function of adipose-derived stem cells, and superparamagnetic iron oxide-enhanced magnetic resonance imaging identifies viable cells. Magn Reson Imaging 2009;27:108–19
17. Adonai N, Nguyen KN, Walsh J, Iyer M, Toyokuni T, Phelps ME, et al. Ex vivo cell labeling with 64Cu-pyruvaldehyde-bis(N4-methylthiosemicarbazone) for imaging cell trafficking in mice with positron-emission tomography. Proc Natl Acad Sci U S A 2002;99:3030–5
18. Olive PL, Banáth JP. The comet assay: a method to measure DNA damage in individual cells. Nat Protoc 2006;1:23–9
19. Sekiya I, Larson BL, Vuoristo JT, Cui JG, Prockop DJ. Adipogenic differentiation of human adult stem cells from bone marrow stroma (MSCs). J Bone Miner Res 2004;19:256–64
20. Tai C, Chatziioannou A, Siegel S, Young J, Newport D, Goble RN, et al. Performance evaluation of the microPET P4: a PET system dedicated to animal imaging. Phys Med Biol 2001;46:1845– 62.
21. Hall EJ. Radiobiology for the radiologist. 4th ed. Philadelphia: Lippincott; 1994.
22. Barbash IM, Chouraqui P, Baron J, Feinberg MS, Etzion S, Tessone A, et al. Systemic delivery of bone marrow-derived mesenchymal stem cells to the infarcted myocardium: feasibility, cell migration, and body distribution. Circulation 2003;108:863–8.
23. Hou D, Youssef EA, Brinton TJ, Zhang P, Rogers P, Price ET, et al. Radiolabeled cell distribution after intramyocardial, intracoronary, and interstitial retrograde coronary venous delivery:
implications for current clinical trials. Circulation 2005;112(9 Suppl):I150–6
24. Fueger BJ, Czernin J, Hildebrandt I, Tran C, Halpern BS, Stout D, et al. Impact of animal handling on the results of 18F-FDG PET studies in mice. J Nucl Med 2006;47:999–1006