EUROPEAN ORGANISATION FOR NUCLEAR RESEARCH (CERN)
Eur. Phys. J. C 78 (2018) 171
DOI:10.1140/epjc/s10052-018-5624-4
CERN-EP-2017-197 6th March 2018
Measurement of quarkonium production in
proton–lead and proton–proton collisions at
5.02 TeV with the ATLAS detector
The ATLAS Collaboration
The modification of the production of J/ψ, ψ(2S), and Υ(nS) (n= 1, 2, 3) in p+Pb collisions
with respect to their production in pp collisions has been studied. The p+Pb and pp datasets
used in this paper correspond to integrated luminosities of 28 nb−1and 25 pb−1respectively,
collected in 2013 and 2015 by the ATLAS detector at the LHC, both at a centre-of-mass energy per nucleon pair of 5.02 TeV. The quarkonium states are reconstructed in the dimuon decay channel. The yields of J/ψ and ψ(2S) are separated into prompt and non-prompt sources. The measured quarkonium differential cross sections are presented as a function of
rapidity and transverse momentum, as is the nuclear modification factor, RpPbfor J/ψ and
Υ(nS). No significant modification of the J/ψ production is observed while Υ(nS) production is found to be suppressed at low transverse momentum in p+Pb collisions relative to pp collisions. The production of excited charmonium and bottomonium states is found to be
suppressed relative to that of the ground states in central p+Pb collisions.
c
2018 CERN for the benefit of the ATLAS Collaboration.
Reproduction of this article or parts of it is allowed as specified in the CC-BY-4.0 license.
1 Introduction
The study of heavy quarkonium bound states (c¯c and b¯b) in ultra-relativistic heavy-ion collisions [1,2] has
been a subject of intense theoretical and experimental efforts since it was initially proposed by Matsui and
Satz [3] as a probe to study a deconfined quark–gluon plasma (QGP) created in nucleus–nucleus (A+A)
collisions. In order to understand quarkonium yields in A+A collisions it is necessary to disentangle
effects due to interaction between quarkonium and the QGP medium from those that can be ascribed to
cold nuclear matter (CNM). In proton (deuteron)–nucleus collisions, p(d)+A, the formation of a large region of deconfined and hot QGP matter was not expected to occur. Therefore, the observed suppression
of quarkonium yields in these systems with respect to pp collisions [4–7] has traditionally been attributed
to CNM effects.
Among the CNM effects, three primary initial-state effects are: modifications of the nuclear parton dis-tribution functions [8–11], parton saturation effects in the incident nucleus [12], and parton energy loss
through interactions with the nuclear medium [13,14]. On the other hand, the absorption of the heavy
quark–antiquark pair through interactions with the co-moving nuclear medium [15–18] is considered to
be a final-state effect. In proton–lead (p+Pb) collisions, the modification of quarkonium production with
respect to that in pp collisions may be quantified by the nuclear modification factor, RpPb, which is defined
as the ratio of the quarkonium production cross section in p+Pb collisions to the cross section measured in
ppcollisions at the same centre-of-mass energy, scaled by the number of nucleons in the lead nucleus:
RpPb= 1 208 σO(nS) p+Pb σO(nS) pp ,
where O(nS) represents one of five measured quarkonium states, J/ψ, ψ(2S), Υ(1S), Υ(2S) and Υ(3S). Several measurements of CNM effects in quarkonium production were performed with p+Pb data
col-lected in 2013 at the LHC at a centre-of-mass energy per nucleon pair √sNN = 5.02 TeV. Measurements
of the J/ψ nuclear modification factor and forward (p beam direction) to backward (Pb beam direction)
cross-section ratio by the ALICE [19,20] and LHCb [21] experiments show strong suppression at large
rapidity and low transverse momentum. However, no strong modification of J/ψ production is observed
at small rapidities and high transverse momentum by the ATLAS [22] or CMS [23] experiments
indic-ating that the CNM effects have strong rapidity and/or transverse momentum dependence. The CNM
effects in excited quarkonium states with respect to the ground state can be quantified by the double ratio, ρO(nS)/O(1S) pPb , defined as: ρO(nS)/O(1S) pPb = RpPb(O(nS)) RpPb(O(1S)) = σO(nS) p+Pb σO(1S) p+Pb /σ O(nS) pp σO(1S) pp ,
where n = 2 for charmonium and n = 2 or 3 for bottomonium. In the double ratio, most sources of
detector systematic uncertainty cancel out, and measurements of this quantity by different experiments
can easily be compared. The initial-state effects are expected to be largely cancelled out in double ratio
due to the same modifications affecting partons before the formation of the quarkonium state, so
meas-uring the relative suppression of different quarkonium states should help in understanding the properties
of the final-state effects separately from the initial ones. The PHENIX experiment at RHIC has presented
that the charmonium double ratio is smaller than unity, and decreases from peripheral to central
colli-sions [24]. At the LHC, inclusive J/ψ [19] and ψ(2S) [25] production has been measured by the ALICE
experiment in p+Pb collisions at √sNN = 5.02 TeV at forward rapidity. Those measurements show a
significantly larger suppression of the ψ(2S) compared to that measured for J/ψ.
The Υ(nS) (n= 2, 3) to Υ(1S) double ratios are both found to be less than unity by the CMS experiment
in p+Pb collisions at √sNN = 5.02 TeV [26]. A double ratio which is smaller than unity suggests the
presence of final-state interactions that affect the excited states more strongly than the ground state, since initial-state effects are expected to cancel. The CMS p+Pb results indicate that the CNM effect partially
contributes to the strong relative suppression found in previous CMS measurements [27–29] of Pb+Pb
collisions at √sNN = 2.76 TeV.
In this paper, four classes of experimental measurements are presented. The first class of
measure-ments is differential production cross sections of J/ψ, ψ(2S), and Υ(nS) (n = 1, 2, 3) in pp collisions
at √s = 5.02 TeV and p+Pb collisions at √sNN = 5.02 TeV. The second is the centre-of-mass rapidity
dependence and transverse momentum dependence of J/ψ and Υ(1S) nuclear modification factors, RpPb.
The third is the evolution of the quarkonium yields with p+Pb collision centrality [30] studied using
ra-tios of the yields of quarkonia to that of Z bosons and the correlation between quarkonium yields and event activity, where both are normalised by their average values over all events. The fourth is the
char-monium and bottochar-monium double ratios, ρO(nS)/O(1S)pPb , presented as a function of centre-of-mass rapidity
and centrality.
2 ATLAS detector
The ATLAS experiment [31] at the LHC is a multi-purpose detector with a forward-backward symmetric
cylindrical geometry and a nearly 4π coverage in solid angle.1 It consists of an inner tracking detector
(ID) surrounded by a thin superconducting solenoid providing a 2 T axial magnetic field, electromag-netic and hadron calorimeters, and a muon spectrometer (MS). The ID covers the pseudorapidity range |η| < 2.5. It consists of silicon pixel, silicon micro-strip, and gaseous transition radiation tracking
de-tectors. A new innermost insertable B-layer [32] installed during the first LHC long shutdown (2013
to 2015) has been operating as a part of the silicon pixel detector since 2015. The calorimeter system covers the pseudorapidity range |η| < 4.9. Within the region |η| < 3.2, electromagnetic calorimetry is
provided by barrel and endcap high-granularity lead/liquid-argon (LAr) electromagnetic calorimeters,
with an additional thin LAr presampler covering |η| < 1.8 to correct for energy loss in material upstream
of the calorimeters. Hadronic calorimetry is provided by a steel/scintillator tile calorimeter, segmented
into three barrel structures within |η| < 1.7, and two copper/LAr hadronic endcap calorimeters. The solid
angle coverage is completed with forward copper/LAr and tungsten/LAr calorimeter (FCal) modules op-timised for electromagnetic and hadronic measurements respectively. The MS comprises separate trigger and high-precision tracking chambers measuring the deflection of muons in a magnetic field generated by superconducting air-core toroids. Monitored drift tubes and cathode strip chambers are designed to
1ATLAS uses a right-handed coordinate system with its origin at the nominal interaction point (IP) in the centre of the detector
and the z-axis along the beam pipe. The x-axis points from the IP to the centre of the LHC ring, and the y-axis points upward. Cylindrical coordinates (r, φ) are used in the transverse plane, φ being the azimuthal angle around the beam pipe. The pseudorapidity is defined in terms of the polar angle θ as η= − ln tan(θ/2) and the transverse momentum pTis defined as
provide precise position measurements in the bending plane in the range |η| < 2.7. Resistive plate cham-bers (RPCs) and thin gap chamcham-bers (TGCs) with a coarse position resolution but a fast response time are used primarily to trigger on muons in the ranges |η| < 1.05 and 1.05 < |η| < 2.4 respectively.
The ATLAS trigger system [33,34] is separated into two levels: the hardware-based level-1 (L1) trigger
and the software-based high level trigger (HLT), which reduce the proton–proton/lead collision rate to several-hundred Hz of events of interest for data recording to mass storage. The L1 muon trigger requires coincidences between hits on different RPC or TGC planes, which are used as a seed for the HLT al-gorithms. The HLT uses dedicated algorithms to incorporate information from both the MS and the ID,
achieving position and momentum resolution close to that provided by the offline muon reconstruction,
as shown in Ref. [33]. During the first LHC long shutdown additional RPCs were installed to cover the
acceptance holes at the bottom of the MS and additional TGC coincidence logic was implemented for the region 1.3 < |η| < 1.9 to reduce backgrounds. More details about the improvement in the trigger system
during the long shutdown can be found in Ref. [34].
3 Datasets and Monte Carlo samples
This analysis includes data from p+Pb collisions recorded at the LHC in 2013 and pp collisions recorded in 2015, both at a centre-of-mass energy of 5.02 TeV per nucleon pair. These data samples correspond to
a total integrated luminosity of 28 nb−1and 25 pb−1for p+Pb and pp collisions respectively.
The p+Pb collisions result from the interactions of a proton beam with an energy of 4 TeV and a lead beam with an energy of 1.58 TeV per nucleon. The usual rapidity, y, in the laboratory frame is defined as
y = 0.5 ln[(E + pz)/(E − pz)], where E and pzrefer to energy and longitudinal momentum respectively.
In the p+Pb collision configuration, the proton–nucleon centre-of-mass rapidity, y∗, had a shift of∆y =
0.465 with respect to y in the laboratory frame. After 60% of the data were recorded the directions of the
proton and lead beams were reversed. In this paper, all data from both periods are presented in y∗, using
an additional convention that the proton beam always travels in the direction of positive y∗.
Monte Carlo (MC) simulations [35] of p+Pb and pp collision events are used to study muon trigger and
reconstruction efficiencies, and quarkonium signal yields extraction. Events were generated using Pythia
8 [36] with the CTEQ61L [37] parton distribution functions. In each event, one of the five quarkonium
states, J/ψ, ψ(2S), and Υ(nS) (n = 1, 2, 3), was produced unpolarised, as motivated by previous
meas-urements at the LHC energy [38–40], and forced to decay via the dimuon channel. The response of the
ATLAS detector was simulated using Geant 4 [41]. The simulated events were reconstructed with the
same algorithms used for data.
4 Event selection
Candidate events in p+Pb collisions were collected with a dimuon trigger which requires one muon to pass the identification requirement at L1. In addition, the L1 muon candidate must be confirmed in the
HLT as a muon with pT > 2 GeV, and at least one more muon candidate with pT > 2 GeV must be
found in a search over the full MS system. In pp collisions the candidate events were collected with a
in the HLT, the two L1 candidates must be confirmed as muons from a common vertex with opposite-sign charges.
In the offline analysis, events are required to have at least one reconstructed primary vertex with at least
four tracks and at least two muons originating from a common vertex, each with pT > 4 GeV and
match-ing an HLT muon candidate associated with the event trigger. The selected muons are required to be
Combined [42] and Tight [43] in p+Pb and pp collisions respectively, where Combined implies that a
muon results from a track in the ID which can be combined with one in the MS, and Tight requires a strict compatibility between the two segments. To ensure high-quality triggering and accurate track measure-ment, each muon track is further restricted to |η| < 2.4. Pairs of muon candidates satisfying these quality requirements, and with opposite charges, are selected as quarkonia candidate pairs. All candidate pairs that satisfy the criteria discussed above, including those events with additional interactions in the same bunch crossing (known as "pile-up" events), are used for the cross-section measurements.
In order to characterise the p+Pb collision geometry, each event is assigned to a centrality class based on the total transverse energy measured in the FCal on the Pb-going side (backwards). Collisions with more
(fewer) participating nucleons are referred to as central (peripheral). Following Ref. [30], the centrality
classes used for this analysis, in order from most central to most peripheral, are 0–5%, 5–10%, 10–20%, 20–30%, 30–40%, 40–60%, and 60–90%.
5 Analysis
5.1 Cross-section determination
The double-differential cross section multiplied by the dimuon decay branching fraction is calculated for
each measurement interval as: d2σO(nS)
dpTdy∗
× B(O(nS) → µ+µ−)= NO(nS)
∆pT×∆y × L
, (1)
where L is the integrated luminosity,∆pT and∆y are the interval sizes in terms of dimuon transverse
momentum and centre-of-mass rapidity respectively, and NO(nS) is the observed quarkonium yield in the
kinematic interval under study, extracted from fits and corrected for acceptance, trigger and reconstruction efficiencies. The total correction weight assigned to each selected dimuon candidate is given by:
w−1
total = A(O(nS)) · εreco·εtrig, (2)
where A(O(nS)) is the acceptance of the dimuon system for one of the five quarkonium states, εrecois the
dimuon reconstruction efficiency and εtrigis the trigger efficiency.
5.2 Acceptance
The acceptance of quarkonium decays into muon pairs is defined as the probability of both muons from the decay falling in the fiducial region (pT(µ±) > 4 GeV, |η(µ±)| < 2.4). The acceptance depends on transverse momentum, rapidity, invariant mass and the spin-alignment of the quarkonium state. The invariant mass
indicate that decays of quarkonia produced at LHC energies are consistent with the assumption that they are unpolarised. Based on this assumption, and with a further assumption that the nuclear medium does
not modify the average polarisation of produced quarkonia, all quarkonium states in both the p+Pb and pp
collisions are considered to be produced unpolarised in this paper. The acceptance, A(O(nS)), for each of
J/ψ, ψ(2S), and Υ(nS) (n = 1, 2, 3) as a function of quarkonium transverse momentum and |y| is calculated
using generator-level MC, applying cuts on the pTand η of the muons to emulate the fiducial volume as
described in Refs. [44,45]. The reconstructed dimuon transverse momentum, pµµT , is used for obtaining
the acceptance correction for a given event. However, the reconstructed dimuon transverse momentum
and the quarkonium transverse momentum could be different due to final-state radiation from muons.
Corrections for final-state radiation are obtained by comparing acceptances calculated from generator-level muons with those after full detector simulation. The final-state radiation corrections as a function
of pµµT are applied to the acceptance corrections. The correction factors are different for charmonium and
bottomonium states but are the same for ground and excited states. Finally, the same correction factors are used in pp and p+Pb data.
5.3 Muon reconstruction and trigger efficiency
The single muon reconstruction efficiency in p+Pb data is determined directly from data using J/ψ →
µ+µ−
tag-and-probe method as used in Ref. [22, 42], in which the tag muon is required to match with
the trigger used to select the sample such that the probe muon is unbiased from the sample selection
trigger, and the purity of the probe is guaranteed by background subtraction based on J/ψ → µ+µ−
decay. The dimuon trigger efficiency in p+Pb data is factorised into single-muon trigger efficiencies for reconstructed muons at the L1 and HLT, with the correlation between the L1 and HLT trigger algorithms
taken into account. The single-muon trigger efficiencies are obtained from data, based on J/ψ → µ+µ−
tag-and-probe method as described in Ref. [22], in intervals of pT(µ) and q × η(µ), where q is the charge
of the muon.
For the pp data, the same J/ψ → µ+µ−tag-and-probe technique as for p+Pb data is used to determine
single muon reconstruction and trigger efficiencies. The dimuon trigger efficiency in the pp data consists
of two components. The first part represents the trigger efficiency for a single muon in intervals of pT(µ)
and q×η(µ). The second part is a dimuon correction term to account for reductions in the trigger efficiency
due to close-by muon pairs identified as single muon candidates at L1. The dimuon correction term, which is determined separately for charmonium and bottomonium candidates, also accounts for inefficiency due to the vertex-quality requirement and opposite-sign charge requirement on the two online candidates. The efficiency and the dimuon correction term obtained from the MC simulation are used to correct data in order to suppress the statistical fluctuations of measured corrections. The measured average single-muon trigger efficiency is about 80% (95%) in the range |η(µ)| < 1.05 (1.05 < |η(µ)| < 2.4). In addition to the main corrections derived from simulation, data-to-simulation scale factors, which are simple linear factors to account for the differences between data and MC simulation, are also applied. The resulting scale factor is found to be about 92% in the range |η(µ)| < 1.05 and about 98% in the range 1.05 < |η(µ)| < 2.4 without
apparent pT dependence in both η regions.
5.4 Yield extraction
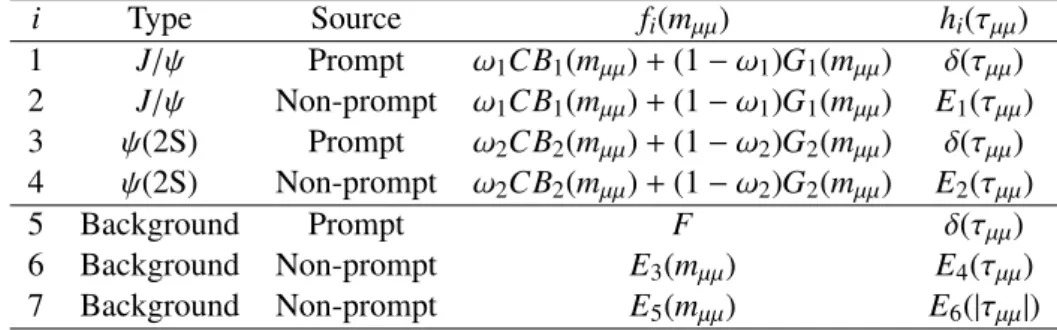
Table 1: Probability density functions for individual components in the central fit model used to extract the prompt and non-prompt contributions for charmonium signals and backgrounds. The composite PDF terms are defined as follows: CB - Crystal Ball; G - Gaussian; E - Exponential; F - constant distribution; δ - delta function. The
parameter ωiis the fraction of CB component in signal.
i Type Source fi(mµµ) hi(τµµ) 1 J/ψ Prompt ω1CB1(mµµ)+ (1 − ω1)G1(mµµ) δ(τµµ) 2 J/ψ Non-prompt ω1CB1(mµµ)+ (1 − ω1)G1(mµµ) E1(τµµ) 3 ψ(2S) Prompt ω2CB2(mµµ)+ (1 − ω2)G2(mµµ) δ(τµµ) 4 ψ(2S) Non-prompt ω2CB2(mµµ)+ (1 − ω2)G2(mµµ) E2(τµµ) 5 Background Prompt F δ(τµµ) 6 Background Non-prompt E3(mµµ) E4(τµµ) 7 Background Non-prompt E5(mµµ) E6(|τµµ|)
The charmonium yield determination decomposes the yields into two sources of muon pairs referred to as "prompt" and "non-prompt". The prompt J/ψ and ψ(2S) signal originates from the strong production of short-lived particles, including feed-down from other short-lived charmonium states, while non-prompt refers to J/ψ and ψ(2S) mesons which are the decay products of b-hadrons. To distinguish between
these prompt and non-prompt processes, the pseudo-proper lifetime, τµµ = (Lxymµµ)/pµµT , is used. The
transverse displacement, Lxy, is the distance of the dimuon secondary vertex from the primary vertex
along the dimuon momentum direction in the transverse plane. Two-dimensional unbinned
maximum-likelihood fits, as used in a previous ATLAS measurement [46], are performed on weighted distributions
of the dimuon invariant mass (mµµ) and pseudo-proper lifetime (τµµ) to extract prompt and non-prompt
signal yields, in intervals of pµµT , rapidity and centrality. The event weight is given by Eq. (2). To obtain
the acceptance corrections, J/ψ acceptance is applied to events with mµµ< 3.2 GeV, ψ(2S) acceptance is
applied to events with mµµ> 3.5 GeV and a linear interpolation of the two acceptances is used for events
with 3.2 < mµµ < 3.5 GeV. Each interval of pµµT , rapidity and centrality is fitted independently in the
RooFit framework [47]. The two-dimensional probability density function (PDF) in mµµand τµµfor the
fit model is defined as:
PDF(mµµ, τµµ)= 7 X
i=1
κifi(mµµ) · hi(τµµ) ⊗ g(τµµ),
where ⊗ implies a convolution, κi is the normalisation factor of each component and g(τµµ) is a double
Gaussian τµµresolution function. The two Gaussian components share a fixed mean at τµµ = 0. One of
the two widths in the resolution function is free, while the other width is fixed at the first one multiplied by a constant factor, determined from MC simulation. The relative fraction of the two Gaussian components is a free parameter. The details of the seven components in the nominal fit model are summarised in
Table1and described below.
The signal charmonium line shape in mµµis described by the sum of a Crystal Ball shape (CB) [48] and
a single Gaussian function with a common mean. The width parameter in the CB function is free, while the Gaussian width is fixed with respect to the CB width by a constant factor motivated by the ratio of muon transverse momentum resolutions in different parts of the detector. The rest of the parameters in the CB function are fixed to values obtained from MC simulation. The mean and width of the ψ(2S) are fixed to those of the J/ψ multiplied by a factor equal to the ratio of the measured masses of the ψ(2S)
and the J/ψ [49]. The relative fraction of the CB and Gaussian components is considered to be a free parameter, but one that is common to both the J/ψ and ψ(2S). The prompt charmonium line shapes in
τµµare described by a δ function convolved with the resolution function g(τµµ), whereas the non-prompt
charmonium signals have pseudo-proper lifetime line shapes given by an exponential function convolved with g(τµµ).
The background contribution contains one prompt component and two non-prompt components. The
prompt background is given by a δ function convolved with g(τµµ) in τµµand a constant distribution in
mµµ. One of the non-prompt background contributions is described by a single-sided exponential
func-tion convolved with g(τµµ) (for positive τµµonly), and the other non-prompt background contribution is
described by a double-sided exponential function convolved with g(τµµ) accounting for misreconstructed
or combinatoric dimuon pairs. The two non-prompt backgrounds are parameterised as two independent
exponential functions in mµµ.
There are in total seventeen free parameters in the charmonium fit model. The normalisation factor κi of
each component is extracted from each fit. From these parameters, and the weighted sum of events, all
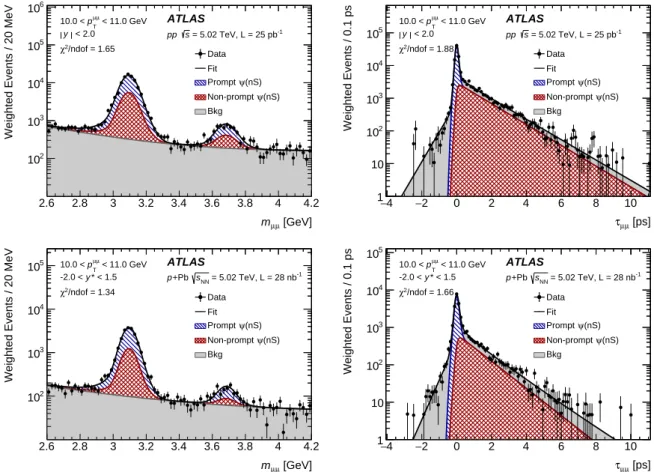
measured values are calculated. Figure1shows examples of charmonium fit projections onto invariant
mass and pseudo-proper lifetime axes. The fit projections are shown for the total prompt signal, total non-prompt signal and total background contributions.
Bottomonium
The yields of bottomonium states are obtained by performing unbinned maximum likelihood fits of the
weighted invariant mass distribution, in intervals of pµµT , rapidity and centrality. Due to overlaps between
the invariant mass peaks of different bottomonium states, the linear acceptance interpolation used for the charmonium states is not appropriate to the bottomonium states. Instead, each interval is fitted three times
to extract the corrected yields of the three different bottomonium states, each time with the acceptance
weight of one of the three states assigned to all candidates. Each of the fits in each interval of pµµT , rapidity and centrality is independent of all the others.
The bottomonium signal invariant mass model is essentially the same as the charmonium model. The mean and width of the Υ(1S) is free, while the means and widths of Υ(2S) and Υ(3S) are fixed with respect to parameters of Υ(1S) with a constant scaling factor equal to the Υ(nS) to Υ(1S) mass ratio taken from Ref. [49]. The bottomonium background parameterisation varies with pµµT . At low pµµT (pµµT < 6 GeV), and for all rapidity intervals, an error function multiplied by an exponential function is used to model the
mµµ turn-on effects due to decreasing acceptance with decreasing invariant mass, which originates from
the pTselection applied to each muon. At low pµµT , the background model’s parameters are constrained by
using a background control sample. The control sample is selected from dimuon events in which at least one of the muons has a transverse impact parameter with respect to the primary vertex larger than 0.2 mm. This criterion causes the control sample to be dominated by muon pairs from the decay of b-hadrons. For
candidates with higher pµµT , a second-order polynomial is used to describe the background contribution.
At low pµµT , the background model is first fitted to the control sample, then the parameters of the error
function are fixed at their fitted values, and finally the full fit model with the constrained background is
[GeV]
µ µ
m
2.6 2.8 3 3.2 3.4 3.6 3.8 4 4.2
Weighted Events / 20 MeV
2 10 3 10 4 10 5 10 6 10 ATLAS -1 = 5.02 TeV, L = 25 pb s pp < 11.0 GeV µ µ T p 10.0 < < 2.0 y /ndof = 1.65 2 χ Data Fit (nS) ψ Prompt (nS) ψ Non-prompt Bkg [ps] µ µ τ 4 − −2 0 2 4 6 8 10 Weighted Events / 0.1 ps 1 10 2 10 3 10 4 10 5 10 ATLAS -1 = 5.02 TeV, L = 25 pb s pp < 11.0 GeV µ µ T p 10.0 < < 2.0 y /ndof = 1.88 2 χ Data Fit (nS) ψ Prompt (nS) ψ Non-prompt Bkg [GeV] µ µ m 2.6 2.8 3 3.2 3.4 3.6 3.8 4 4.2
Weighted Events / 20 MeV
2 10 3 10 4 10 5 10 ATLAS -1 = 5.02 TeV, L = 28 nb NN s +Pb p < 11.0 GeV µ µ T p 10.0 < * < 1.5 y -2.0 < /ndof = 1.34 2 χ Data Fit (nS) ψ Prompt (nS) ψ Non-prompt Bkg [ps] µ µ τ 4 − −2 0 2 4 6 8 10 Weighted Events / 0.1 ps 1 10 2 10 3 10 4 10 5 10 ATLAS -1 = 5.02 TeV, L = 28 nb NN s +Pb p < 11.0 GeV µ µ T p 10.0 < * < 1.5 y -2.0 < /ndof = 1.66 2 χ Data Fit (nS) ψ Prompt (nS) ψ Non-prompt Bkg
Figure 1: Projections of the charmonium fit results onto dimuon invariant mass mµµ(left) and pseudo-proper lifetime
τµµ(right) for pp collisions at √s= 5.02 TeV (top) for the kinematic ranges 10 < pµµT < 11 GeV and |y| < 2.0, and
p+Pb collisions at √sNN = 5.02 TeV (bottom) for the kinematic ranges 10 < pµµT < 11 GeV and −2.0 < y∗ < 1.5.
The goodnesses of the invariant mass fits with ndof= 63 and the pseudo-proper lifetime fits with ndof = 153 are
also presented.
6 Systematic uncertainties
The sources of systematic uncertainty in the quarkonium yields include acceptance, muon reconstruction
and trigger efficiency corrections, the fit model parameterisation and bin migration corrections and the
luminosity. For the ratio measurements the systematic uncertainties are assessed in the same manner as for the yields, except that in the ratios the correlated systematic uncertainties, such as the luminosity uncertainty, cancel out.
Luminosity
The uncertainty in integrated luminosity is 2.7% (5.4%) for 2013 p+Pb (2015 pp) data-taking. The
luminosity calibration is based on data from dedicated beam-separation scans, also known as van der
Meer scans, as described in Ref. [50].
[GeV]
µ µ
m
8.5 9 9.5 10 10.5 11 11.5
Weighted Events / 100 MeV
0 2 4 6 8 10 12 14 3 10 × ATLAS -1 = 5.02 TeV, L = 25 pb s pp < 3.0 GeV µ µ T p 1.5 < | < 2.0 y | Data Fit Background (1S) ϒ (2S) ϒ (3S) ϒ /ndof = 1.80 2 χ [GeV] µ µ m 8.5 9 9.5 10 10.5 11 11.5
Weighted Events / 100 MeV
0 0.2 0.4 0.6 0.8 1 1.2 1.4 1.6 1.8 3 10 × ATLAS -1 = 5.02 TeV, L = 25 pb s pp < 20.0 GeV µ µ T p 14.0 < | < 2.0 y | Data Fit Background (1S) ϒ (2S) ϒ (3S) ϒ /ndof = 1.05 2 χ [GeV] µ µ m 8.5 9 9.5 10 10.5 11 11.5
Weighted Events / 100 MeV
0 0.5 1 1.5 2 2.5 3 3.5 3 10 × ATLAS -1 = 5.02 TeV, L = 28 nb NN s +Pb p < 3.0 GeV µ µ T p 1.5 < * < 1.5 y -2.0 < Data Fit Background (1S) ϒ (2S) ϒ (3S) ϒ /ndof = 1.34 2 χ [GeV] µ µ m 8.5 9 9.5 10 10.5 11 11.5
Weighted Events / 100 MeV
0 50 100 150 200 250 300 350 400 450 ATLAS -1 = 5.02 TeV, L = 28 nb NN s +Pb p < 20.0 GeV µ µ T p 14.0 < * < 1.5 y -2.0 < Data Fit Background (1S) ϒ (2S) ϒ (3S) ϒ /ndof = 1.07 2 χ
Figure 2: Bottomonium fit results in dimuon invariant mass mµµfor pp collisions at √s= 5.02 TeV (top) and p+Pb
collisions at √sNN = 5.02 TeV (bottom) for one typical low pµµT interval of 1.5 < pµµT < 3 GeV (left) and one high
pµµT interval of 14 < pµµT < 20 GeV (right). For all the shown fits, Υ(1S) acceptance weights are assigned. The
goodness of the bottomonium fit with ndof= 24 is also presented.
A systematic uncertainty for the final-state radiation corrections is assigned to cover the differences
between correction factors obtained for ground and excited states of quarkonium and for different rapid-ity slices. The systematic uncertainties fully cancel out in ratio measurements in the same datasets and between different datasets.
Muon reconstruction and trigger efficiencies in p+Pb collisions
The dominant source of uncertainty in the muon reconstruction and trigger efficiency in p+Pb collisions
is statistical. Therefore, the uncertainty in each bin is treated as uncorrelated and the corresponding uncer-tainties are propagated to the measured observables by using pseudo-experiments as in previous ATLAS
measurements [46]. For each pseudo-experiment a new efficiency map is created by varying
independ-ently the content of each bin according to a Gaussian distribution. The mean and width parameters of the Gaussian distribution are respectively the value and uncertainty of the bin in the original map. In each pseudo-experiment, the total weight is recalculated for each dimuon kinematic interval of the analysis. A distribution of total weight is obtained from repeating pseudo-experiments for 200 times, which is suf-ficient to suppress the statistical fluctuation of the sample used in each experiment. For each efficiency type, the RMS of the total weight distributions is assigned as the systematic uncertainty.
An additional uncertainty of 1% is applied to cover the small muon reconstruction inefficiency in the inner detector in p+Pb collisions. The dimuon trigger efficiency factorisation is tested in simulation, and a bias of at most 4% is found in yield observables. The bias stems from the imperfect approximation of the
correlation between trigger algorithms at different levels in the dimuon trigger factorisation. An additional
correlated uncertainty of 4% is added to cover this bias. This uncertainty is applied to quarkonium yields
in p+Pb collisions, but is assumed to cancel in ratios measured in the same datasets.
Muon reconstruction and trigger efficiencies in pp collisions
For the pp measurements, the efficiency maps are determined from MC simulation and corrected with
measured data-to-simulation scale factors as detailed in Ref. [43]. The statistical uncertainty associated
with efficiency scale factor is evaluated using random replicas of the efficiency maps as for p+Pb and
the different sources of uncertainty described below are treated as correlated. The systematic uncertainty
in reconstruction efficiency is obtained by varying the signal and background models in the fits used to
extract the efficiency in data, and taking the difference between the reconstruction efficiency calculated using generator-level information and the value obtained with the tag-and-probe method in MC simu-lation. An additional 1% correlated uncertainty is added to cover a systematic variation due to a small misalignment in the ID. For the trigger efficiency, the following variations of the analysis are studied and the effects are combined in quadrature:
• variations of signal and background fit model used to extract the data efficiency;
• variations of the matching criteria between a muon and a trigger element;
• using dimuon correction terms determined at positive (or negative) rapidity for whole rapidity range.
A test of the approximation of muon–muon correlation at L1 in the pp dimuon trigger factorisation in MC simulation results in a bias of at most 4%, which is the same size as the factorisation bias of the p+Pb trigger but with totally different origins. An additional 4% correlated uncertainty is added to quarkonium yields to cover the bias. This uncertainty cancels out in ratio observables that are measured in the same datasets.
Bin migrations
Corrections due to bin migration factors were evaluated in Refs. [45, 46] and are determined to be less
than 0.5% of the measured values. For this reason, bin migration correction factors and their uncertainties are neglected in this analysis.
Charmonium fit
The uncertainty from the signal and background line shapes is estimated from variations of the fit model. To remove the statistical component, each variation is repeated with pseudo-experiments, generated using
the bootstrap method [51]. First, for each toy sample, every event from the original data is filled into the
toy sample n times, where n is a random integer obtained from a Poisson distribution with a mean of one. Then the central model and a set of ‘variation’ models are fitted to the toy sample, and all measured quantities are recalculated. The difference between the central model and a given variation model is extracted and recorded. After repeating the pseudo-experiment 100 times, the systematic uncertainty due
to the line shape is defined as the mean difference of a given variation model from the nominal model.
• Signal tail due to final-state radiation. Evaluated by replacing the CB plus Gaussian model with a double Gaussian function, and varying the tail parameters of the CB model, which are originally fixed.
• Pseudo-proper lifetime resolution. Evaluated by replacing the double Gaussian function with a single Gaussian function to model pseudo-proper lifetime resolution.
• Signal pseudo-proper lifetime shape. Evaluated by using a double exponential function to describe the pseudo-proper lifetime distribution of the signal.
• Background mass shapes. Evaluated by using a second-order Chebyshev polynomial to describe the prompt, non-prompt and double-sided background terms.
The total systematic uncertainty from the line shape fit is determined by combining the maximum vari-ation found in each of the four groups in quadrature. In order to estimate the possible bias introduced by the line shape assumptions in the nominal fit model parameterisation, the nominal model is tested using
the J/ψ → µ+µ−MC sample in which random numbers of prompt and non-prompt J/ψ are mixed. About
1% difference between the random input and fit model output is found for the yield and non-prompt frac-tion in the MC test. An addifrac-tional systematic uncertainty of 1% is assigned to charmonium yields and non-prompt fractions to cover the nominal fit model parameterisation bias. This uncertainty cancels out in the ψ(2S) to J/ψ yield ratio.
Bottomonium fit
The systematic uncertainty from varying the fit model is estimated based on the same method as used for the charmonium fit uncertainty, and there are six variation models for bottomonium categorised into three groups:
• Signal resolution. Evaluated by replacing the CB plus Gaussian model with a single CB function and a triple Gaussian function, and varying the constant width scaling term between the CB function and the Gaussian function.
• Signal tail due to final-state radiation. Evaluated by replacing the CB plus Gaussian model with a double Gaussian function, and treating the tail parameters in the CB function as free parameters.
• Background shapes. Evaluated by replacing the low pT background distribution with a
fourth-order Chebyshev polynomial, and replacing the high pT distribution by an exponential function or
a second-order Chebyshev polynomial.
The total systematic uncertainty from the line shape fit is given by combining the maximum variation found in each of the three groups in quadrature. An additional systematic uncertainty of 1.5% is assigned
to Υ(1S) yields and 2% for Υ(nS) yields and Υ(nS) to Υ(1S) ratios (n = 2, 3), in order to cover the bias
of the nominal model found in MC tests similar to those for the charmonium fit model.
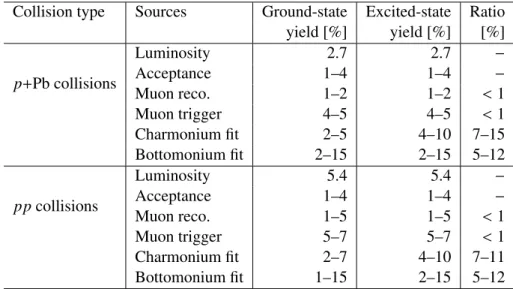
Table2summaries the systematic uncertainties in the ground-state and excited-state yields and their
ra-tio. The dominant sources of systematic uncertainty for the yields are the fit model and muon trigger
efficiency. The ranges of uncertainties shown in the table indicate the minimum and maximum values
found in all pµµT , rapidity and centrality intervals. The large range of bottomonium fit systematic
uncer-tainty is due to the different modelling of the background at low pµµT (pµµT < 6 GeV) and high pµµT . The systematic uncertainty from fit model variations is much larger at low pµµT than at high pµµT . For the ratios
Table 2: Summary of systematic uncertainties in the charmonium and bottomonium ground-state and excited-state yields and their ratio. The ranges of uncertainties indicate the minimum and maximum values found in all kinematic slices. Symbol "−" in the ratio observable column indicates the uncertainty fully cancels out.
Collision type Sources Ground-state Excited-state Ratio
yield [%] yield [%] [%] p+Pb collisions Luminosity 2.7 2.7 − Acceptance 1–4 1–4 − Muon reco. 1–2 1–2 < 1 Muon trigger 4–5 4–5 < 1 Charmonium fit 2–5 4–10 7–15 Bottomonium fit 2–15 2–15 5–12 ppcollisions Luminosity 5.4 5.4 − Acceptance 1–4 1–4 − Muon reco. 1–5 1–5 < 1 Muon trigger 5–7 5–7 < 1 Charmonium fit 2–7 4–10 7–11 Bottomonium fit 1–15 2–15 5–12
measured in the same datasets, most sources of systematic uncertainty including the trigger efficiency
largely cancel out.
The luminosity systematic uncertainties in pp and p+Pb collisions are considered to be totally
uncor-related. The acceptance systematic uncertainties in pp and p+Pb collisions are fully correlated. The
reconstruction efficiency systematic uncertainties are treated as uncorrelated due to different muon
selec-tion criteria in pp and p+Pb collisions. The uncertainties in the trigger efficiencies are also treated as
uncorrelated since different efficiency determination strategies are used in pp and p+Pb collisions and
the factorisation biases originate from different types of trigger correlations. The fit model variation sys-tematic uncertainties are found to be partially correlated and their effects on RpPb and ρO(nS)/O(1S)pPb are
determined by studying these ratios obtained from simultaneous fits to pp and p+Pb collision data for
each variation.
7 Results
7.1 Production cross sections
Following the yield correction and signal extraction, the cross sections of five quarkonium states are
measured differentially in transverse momentum2and rapidity, as described in Eq. (1).
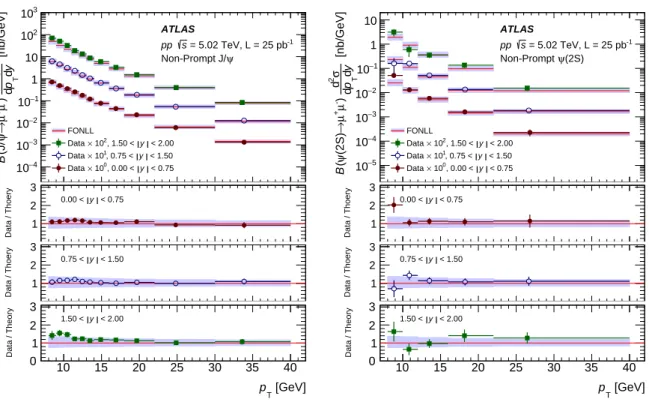
The results for non-prompt J/ψ and ψ(2S) cross sections in pp collisions at √s= 5.02 TeV compared to
fixed-order next-to-leading-logarithm (FONLL) predictions [52] are shown in intervals of pTfor different
rapidity slices in Figure 3. The FONLL uncertainties include renormalisation and factorisation scale
variations, charm quark mass and parton distribution functions uncertainties as detailed in Ref. [52]. The
measured non-prompt charmonium production cross sections agree with the FONLL predictions within
uncertainties over the measured pTrange.
2The transverse momentum of the quarkonium state is denoted as p
[GeV] T p 10 15 20 25 30 35 40 [nb/GeV] y d T p d σ 2 d ) -µ + µ → ψ (J/ B −4 10 3 − 10 2 − 10 1 − 10 1 10 2 10 3 10 ATLAS -1 = 5.02 TeV, L = 25 pb s pp ψ Non-Prompt J/ FONLL < 2.00 y , 1.50 < 2 10 × Data < 1.50 y , 0.75 < 1 10 × Data < 0.75 y , 0.00 < 0 10 × Data 10 15 20 25 30 35 40 Data / Thoery 1 2 3 < 0.75 y 0.00 < 10 15 20 25 30 35 40 Data / Thoery 1 2 3 < 1.50 y 0.75 < [GeV] T p 10 15 20 25 30 35 40 Data / Theory 0 1 2 3 < 2.00 y 1.50 < [GeV] T p 10 15 20 25 30 35 40 [nb/GeV] y d T p d σ 2 d ) -µ + µ → (2S) ψ ( B 10−5 4 − 10 3 − 10 2 − 10 1 − 10 1 10 ATLAS -1 = 5.02 TeV, L = 25 pb s pp (2S) ψ Non-Prompt FONLL < 2.00 y , 1.50 < 2 10 × Data < 1.50 y , 0.75 < 1 10 × Data < 0.75 y , 0.00 < 0 10 × Data 10 15 20 25 30 35 40 Data / Thoery 1 2 3 < 0.75 y 0.00 < 10 15 20 25 30 35 40 Data / Thoery 1 2 3 < 1.50 y 0.75 < [GeV] T p 10 15 20 25 30 35 40 Data / Theory 0 1 2 3 < 2.00 y 1.50 <
Figure 3: The differential non-prompt production cross section times dimuon branching fraction of J/ψ (left) and
ψ(2S) (right) as a function of transverse momentum pTfor three intervals of rapidity y in pp collisions at 5.02 TeV.
For each increasing rapidity slice, an additional scaling factor of 10 is applied to the plotted points for visual clarity.
The horizontal position of each data point indicates the mean of the weighted pT distribution. The horizontal bars
represent the range of pTfor the bin, and the vertical error bars correspond to the combined statistical and systematic
uncertainties. The FONLL theory predictions (see text) are also shown, and the error bands in the prediction correspond to the combined factorisation scale, quark mass and parton distribution functions uncertainties.
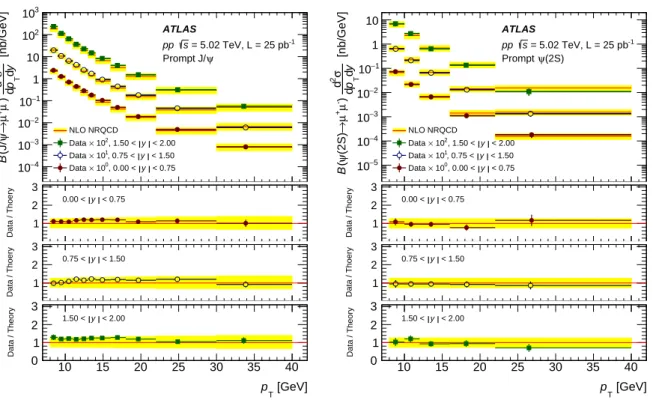
The measured prompt J/ψ and ψ(2S) cross sections in pp collisions at √s = 5.02 TeV are shown in
Figure4in pT and rapidity intervals, compared with non-relativistic QCD (NRQCD) predictions. The
theory predictions are based on the long-distance matrix elements (LDMEs) from Refs. [53, 54], with
uncertainties originating from the choice of scale, charm quark mass and LDMEs (see Refs. [53,54] for
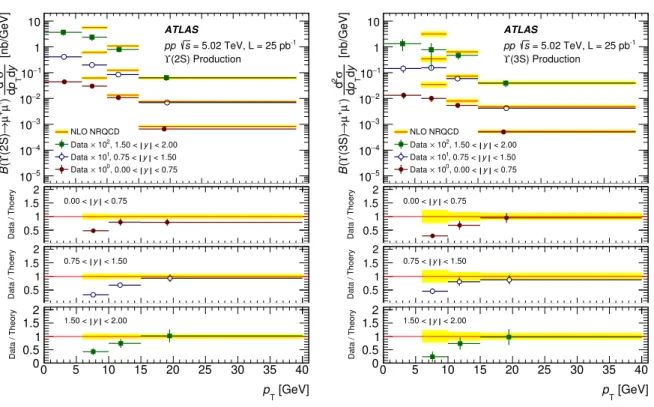
more details). Figures5and6show the production cross section of Υ(nS) in pp collisions compared to
similar NRQCD model calculations [55]. As stated in Ref. [55], the LDMEs for bottomonium production
are only extracted from fitting experiment data at pT > 15 GeV. At lower pT, there might be
non-perturbative effects which break the NRQCD factorization and perturbation expansion. As a consequence
of its construction, the bottomonium NRQCD model gives a relatively good description of the measured
Υ(nS) production cross section at pT > 15 GeV, while overestimates the production cross section at lower
pT.
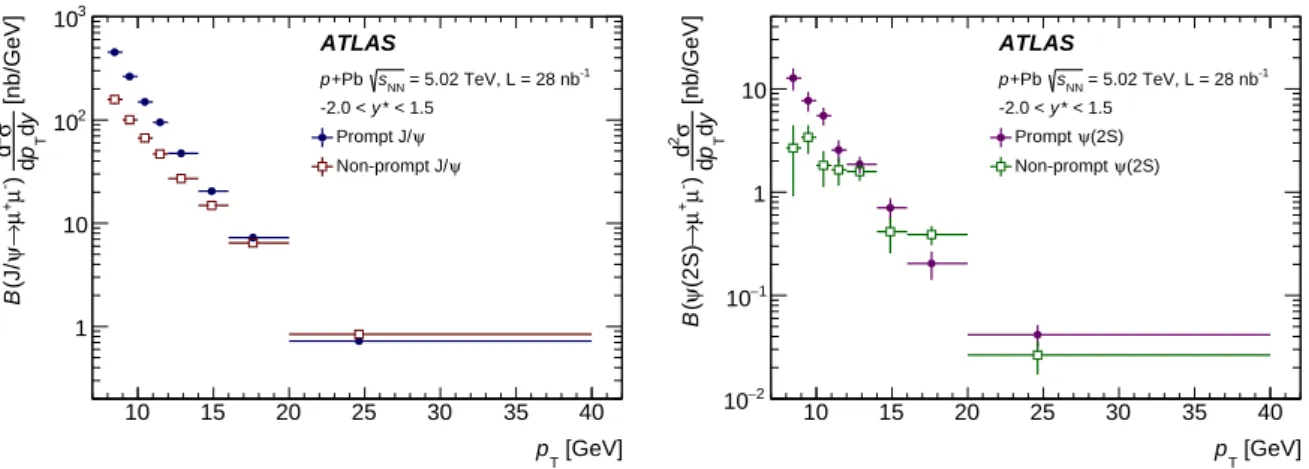
The results for prompt and non-prompt production cross sections of J/ψ and ψ(2S) in p+Pb collisions
at √sNN = 5.02 TeV are shown in intervals of pT in Figure7. The results for prompt and non-prompt
production cross sections of J/ψ and ψ(2S) in p+Pb collisions in intervals of y∗are shown in Figure8.
Compared to the previous ATLAS measurement [22], improved muon trigger corrections which are
smal-ler by 6% in central value and 4% in uncertainty and a more comprehensive fit model involving a wider mass range are used in the J/ψ cross-section measurements. The measured J/ψ cross sections are
[GeV] T p 10 15 20 25 30 35 40 [nb/GeV] y d T p d σ 2 d ) -µ + µ → ψ (J/ B −4 10 3 − 10 2 − 10 1 − 10 1 10 2 10 3 10 ATLAS -1 = 5.02 TeV, L = 25 pb s pp ψ Prompt J/ NLO NRQCD < 2.00 y , 1.50 < 2 10 × Data < 1.50 y , 0.75 < 1 10 × Data < 0.75 y , 0.00 < 0 10 × Data 10 15 20 25 30 35 40 Data / Thoery 1 2 3 < 0.75 y 0.00 < 10 15 20 25 30 35 40 Data / Thoery 1 2 3 < 1.50 y 0.75 < [GeV] T p 10 15 20 25 30 35 40 Data / Theory 0 1 2 3 < 2.00 y 1.50 < [GeV] T p 10 15 20 25 30 35 40 [nb/GeV] y d T p d σ 2 d ) -µ + µ → (2S) ψ ( B 10−5 4 − 10 3 − 10 2 − 10 1 − 10 1 10 ATLAS -1 = 5.02 TeV, L = 25 pb s pp (2S) ψ Prompt NLO NRQCD < 2.00 y , 1.50 < 2 10 × Data < 1.50 y , 0.75 < 1 10 × Data < 0.75 y , 0.00 < 0 10 × Data 10 15 20 25 30 35 40 Data / Thoery 1 2 3 < 0.75 y 0.00 < 10 15 20 25 30 35 40 Data / Thoery 1 2 3 < 1.50 y 0.75 < [GeV] T p 10 15 20 25 30 35 40 Data / Theory 0 1 2 3 < 2.00 y 1.50 <
Figure 4: The differential prompt production cross section times dimuon branching fraction of J/ψ (left) and ψ(2S)
(right) as a function of transverse momentum pT for three intervals of rapidity y in pp collisions at 5.02 TeV. For
each increasing rapidity slice, an additional scaling factor of 10 is applied to the plotted points for visual clarity.
The horizontal position of each data point indicates the mean of the weighted pT distribution. The horizontal
bars represent the range of pT for the bin, and the vertical error bars correspond to the combined statistical and
systematic uncertainties. The NRQCD theory predictions (see text) are also shown, and the error bands in the prediction correspond to the combined scale, quark mass and LDMEs uncertainties.
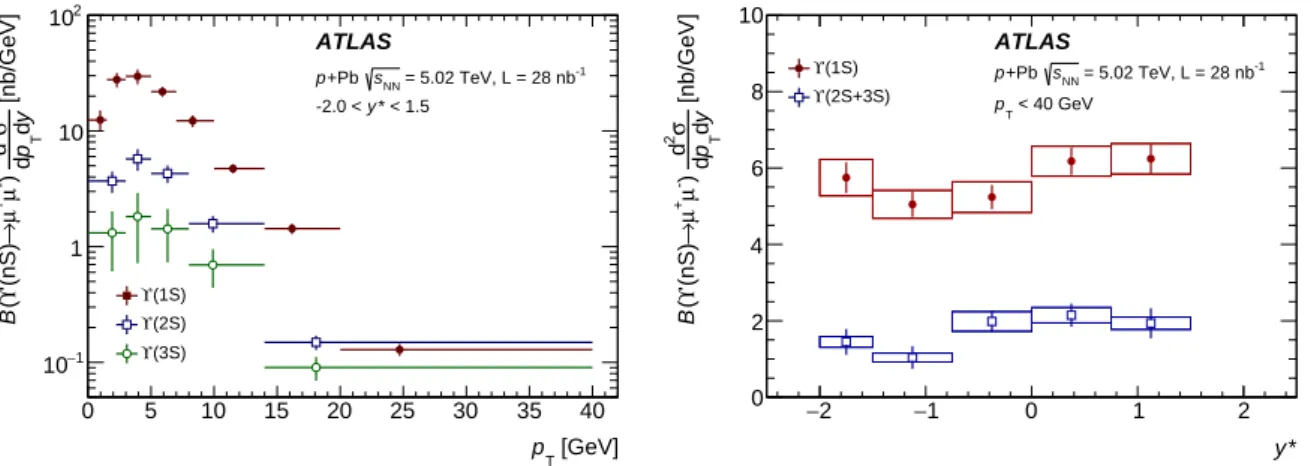
ent with previous results within uncertainties. The measured differential production cross section of Υ(nS)
in p+Pb collisions is shown in Figure9. Due to difficulties in separating Υ(2S) and Υ(3S) at forward and
backward y∗intervals in p+Pb collisions, they are combined to obtain stable rapidity dependence of the
production cross section.
7.2 Nuclear modification factor
The pTdependence of RpPbfor the prompt and non-prompt J/ψ is shown in Figure10. Taking into account
the correlated and uncorrelated uncertainties, both the prompt and non-prompt J/ψ RpPb are consistent
with unity across the pT range from 8 to 40 GeV. The rapidity dependence of prompt and non-prompt
J/ψ RpPb is shown in Figure11. No significant rapidity dependence is observed. The pT and rapidity
dependence of Υ(1S) RpPb is shown in Figure12. The Υ(1S) production in p+Pb collisions is found to
be suppressed compared to pp collisions at low pT(pT< 15 GeV), and increases with pT. Low pTΥ(1S)
can probe smaller Bjorken-x region compared to J/ψ measured in 8 < pT< 40 GeV [56], so the observed
suppression of Υ(1S) production at low pTmay come from the reduction of hard-scattering cross sections
due to stronger nPDF shadowing at smaller Bjorken-x. No significant rapidity dependence is observed, which qualitatively agrees with a prediction of weak rapidity dependence for central rapidities.
0 5 10 15 20 25 30 35 40 [nb/GeV] y d T p d σ 2 d ) -µ + µ → (1S) ϒ( B 10−4 3 − 10 2 − 10 1 − 10 1 10 2 10 ATLAS -1 = 5.02 TeV, L = 25 pb s pp (1S) Production ϒ NLO NRQCD < 2.00 y , 1.50 < 2 10 × Data < 1.50 y , 0.75 < 1 10 × Data < 0.75 y , 0.00 < 0 10 × Data 0 5 10 15 20 25 30 35 40 Data / Thoery 0.5 1 1.5 2 < 0.75 y 0.00 < 0 5 10 15 20 25 30 35 40 Data / Thoery 0.5 1 1.5 2 < 1.50 y 0.75 < [GeV] T p 0 5 10 15 20 25 30 35 40 Data / Theory 0 0.5 1 1.5 2 < 2.00 y 1.50 <
Figure 5: The differential production cross section times dimuon branching fraction of Υ(1S) as a function of
transverse momentum pTfor three intervals of rapidity y in pp collisions at 5.02 TeV. For each increasing rapidity
slice, an additional scaling factor of 10 is applied to the plotted points for visual clarity. The horizontal position of
each data point indicates the mean of the weighted pTdistribution. The horizontal bars represent the range of pTfor
the bin, and the vertical error bars correspond to the combined statistical and systematic uncertainties. The NRQCD theory predictions (see text) are also shown, and the error bands in the prediction correspond to the combined scale, quark mass and LDMEs uncertainties.
The Z boson does not interact with the nuclear medium via the strong interaction, so it is considered a
good reference process in p+Pb collisions for studying the centrality dependence of quarkonium
produc-tion in a model-independent way. The quarkonium yield is compared to the Z boson yield from Ref. [57]
in intervals of centrality. The ratio of quarkonium to the Z boson yield is defined as:
RZpPb(O(nS))= Ncent O(nS)/N cent Z NO(nS)0−90%/NZ0−90%
where NO(nS)cent (NZcent) is the corrected quarkonium (Z boson) yield for one centrality class. The resulting
RZpPb(O(nS)) is shown in Figure13for the different quarkonium states in intervals of centrality. In each
centrality interval, RZpPb(O(nS)) is normalised to the ratio integrated in the centrality range 0–90% such
that the normalised yield ratio is independent of production cross sections of the different quarkonium
states. The prompt and non-prompt J/ψ are found to behave in a way very similar to the Z boson. The Z boson production is found to scale with the number of binary collisions in p+Pb collisions after applying the centrality bias correction factor [57,58]. The centrality bias correction factor proposed in Ref. [58]
does not depend on the physics process, so the measured RZpPb(J/ψ) suggests that centrality-bias-corrected
J/ψ production also scales with the number of binary collisions. The measured RZ
0 5 10 15 20 25 30 35 40 [nb/GeV] y d T p d σ 2 d ) -µ + µ → (2S) ϒ( B 10−5 4 − 10 3 − 10 2 − 10 1 − 10 1 10 ATLAS -1 = 5.02 TeV, L = 25 pb s pp (2S) Production ϒ NLO NRQCD < 2.00 y , 1.50 < 2 10 × Data < 1.50 y , 0.75 < 1 10 × Data < 0.75 y , 0.00 < 0 10 × Data 0 5 10 15 20 25 30 35 40 Data / Thoery 0.5 1 1.5 2 < 0.75 y 0.00 < 0 5 10 15 20 25 30 35 40 Data / Thoery 0.5 1 1.5 2 < 1.50 y 0.75 < [GeV] T p 0 5 10 15 20 25 30 35 40 Data / Theory 0 0.5 1 1.5 2 < 2.00 y 1.50 < 0 5 10 15 20 25 30 35 40 [nb/GeV] y d T p d σ 2 d ) -µ + µ → (3S) ϒ( B 10−5 4 − 10 3 − 10 2 − 10 1 − 10 1 10 ATLAS -1 = 5.02 TeV, L = 25 pb s pp (3S) Production ϒ NLO NRQCD < 2.00 y , 1.50 < 2 10 × Data < 1.50 y , 0.75 < 1 10 × Data < 0.75 y , 0.00 < 0 10 × Data 0 5 10 15 20 25 30 35 40 Data / Thoery 0.5 1 1.5 2 < 0.75 y 0.00 < 0 5 10 15 20 25 30 35 40 Data / Thoery 0.5 1 1.5 2 < 1.50 y 0.75 < [GeV] T p 0 5 10 15 20 25 30 35 40 Data / Theory 0 0.5 1 1.5 2 < 2.00 y 1.50 <
Figure 6: The differential production cross section times dimuon branching fraction of Υ(2S) (left) and Υ(3S)
(right) as a function of transverse momentum pT for three intervals of rapidity y in pp collisions at 5.02 TeV. For
each increasing rapidity slice, an additional scaling factor of 10 is applied to the plotted points for visual clarity.
The horizontal position of each data point indicates the mean of the weighted pT distribution. The horizontal
bars represent the range of pT for the bin, and the vertical error bars correspond to the combined statistical and
systematic uncertainties. The NRQCD theory predictions (see text) are also shown, and the error bands in the prediction correspond to the combined scale, quark mass and LDMEs uncertainties.
with being a constant except for the measurement in the most peripheral (60–90%) p+Pb collisions, which is about two to three standard deviations away from the value observed in more central collisions. The
current precision of RZpPb(ψ(2S)) does not allow conclusions to be drawn about the centrality dependence
of prompt ψ(2S) production with respect to Z bosons.
Quarkonium self-normalised yields, O(nS)/hO(nS)i, are defined as the per-event yields of quarkonium in each centrality class normalised by the yield in the 0–90% centrality interval. The correlation of quarkonium production with the underlying event is traced by comparing the self-normalised quarkonium yields with the respective self-normalised event activity. The event activity is characterised by the total transverse energy deposition in the backward FCal (3.1 < |η| < 4.9),ΣEBackwardsT , on the Pb-going side,
and it is determined in a minimum-bias data sample as used in Ref. [30]. The self-normalised quantities
O(nS)/hO(nS)i andΣETBackwards/hΣEBackwardsT i are defined as:
O(nS)
hO(nS)i≡
NO(nS)cent /Nevtcent NO(nS)0−90%/Nevt0−90%,
[GeV] T p 10 15 20 25 30 35 40 [nb/GeV] y d T p d σ 2 d ) -µ + µ → ψ (J/ B 1 10 2 10 3 10 ATLAS -1 = 5.02 TeV, L = 28 nb NN s +Pb p * < 1.5 y -2.0 < ψ Prompt J/ ψ Non-prompt J/ [GeV] T p 10 15 20 25 30 35 40 [nb/GeV] y dT p d σ 2 d ) -µ + µ → (2S) ψ ( B 2 − 10 1 − 10 1 10 ATLAS -1 = 5.02 TeV, L = 28 nb NN s +Pb p * < 1.5 y -2.0 < (2S) ψ Prompt (2S) ψ Non-prompt
Figure 7: The differential cross section times dimuon branching fraction of prompt and non-prompt J/ψ (left) and
ψ(2S) (right) as a function of transverse momentum pTin p+Pb collisions at
√
sNN= 5.02 TeV. The horizontal
po-sition of each data point indicates the mean of the weighted pTdistribution. The horizontal bars represent the range
of pTfor the bin, and the vertical error bars correspond to the combined statistical and systematic uncertainties.
* y 2.5 − −2 −1.5 −1 −0.5 0 0.5 1 1.5 2 [nb/GeV] y d T p d σ 2 d ) -µ + µ → ψ (J/ B 0 20 40 60 80 100 ATLAS -1 = 5.02 TeV, L = 28 nb NN s +Pb p < 40 GeV T p 8 < ψ Prompt J/ ψ Non-prompt J/ * y 2.5 − −2 −1.5 −1 −0.5 0 0.5 1 1.5 2 [nb/GeV] y dT p d σ 2 d ) -µ + µ → (2S) ψ ( B 0 0.5 1 1.5 2 2.5 3 ATLAS -1 = 5.02 TeV, L = 28 nb NN s +Pb p < 40 GeV T p 8 < (2S) ψ Prompt (2S) ψ Non-prompt
Figure 8: The differential cross section times dimuon branching fraction of prompt and non-prompt J/ψ (left) and
ψ(2S) (right) as a function of centre-of-mass rapidity y∗in p+Pb collisions at √s
NN = 5.02 TeV. The horizontal
position of each data point indicates the mean of the weighted y∗distribution. The vertical error bars correspond
to statistical uncertainties. The vertical sizes of coloured boxes around the data points represent the systematic
uncertainties, and the horizontal sizes of coloured boxes represent the range of y∗for the bin.
ΣEBackwards T hΣEBackwards T i = hΣE Backwards T icent hΣEBackwards T i0−90% ,
where Nevtcent is the number of events in the minimum-bias sample for one centrality class. The measured
self-normalised yields for prompt J/ψ, non-prompt J/ψ and Υ(1S) in p+Pb collisions are shown in
Fig-ure14 in comparison with the same observable for Υ(1S) in a previous CMS measurement [26]. The
event activity is determined in the range 4.0 < |η| < 5.2 in CMS. The Υ(1S) self-normalised yields from ATLAS and CMS show a consistent trend. In the events with the highest event activity, a two-standard-deviation departure from the linear trend is observed. Since the same centrality dependence is found for
[GeV] T p 0 5 10 15 20 25 30 35 40 [nb/GeV] y d T p d σ 2 d ) -µ + µ → (nS) ϒ ( B 1 − 10 1 10 2 10 ATLAS -1 = 5.02 TeV, L = 28 nb NN s +Pb p * < 1.5 y -2.0 < (1S) ϒ (2S) ϒ (3S) ϒ * y 2 − −1 0 1 2 [nb/GeV] y dT p d σ 2 d ) -µ + µ → (nS) ϒ ( B 0 2 4 6 8 10 ATLAS -1 = 5.02 TeV, L = 28 nb NN s +Pb p < 40 GeV T p (1S) ϒ (2S+3S) ϒ
Figure 9: Left: the differential cross section times dimuon branching fraction of Υ(nS) as a function of transverse
momentum pT in p+Pb collisions at √sNN = 5.02 TeV. The horizontal position of each data point indicates the
mean of the weighted pTdistribution. The horizontal bars represent the range of pTfor the bin, and the vertical error
bars correspond to the combined statistical and systematic uncertainties. Right: the differential cross section times
dimuon branching fraction of Υ(nS) as a function of centre-of-mass rapidity y∗in p+Pb collisions. The horizontal
position of each data point indicates the mean of the weighted y∗distribution. The vertical error bars correspond
to statistical uncertainties. The vertical sizes of coloured boxes around the data points represent the systematic
uncertainties, and the horizontal sizes of coloured boxes represent the range of y∗for the bin.
[GeV] T p 10 15 20 25 30 35 40 pPb R 0.6 0.8 1 1.2 1.4 1.6 1.8 -1 = 5.02 TeV, L = 28 nb NN s +Pb, p -1 = 5.02 TeV, L = 25 pb s , pp ATLAS ψ Prompt J/ -2.0 < y* < 1.5 [GeV] T p 10 15 20 25 30 35 40 pPb R 0.6 0.8 1 1.2 1.4 1.6 1.8 -1 = 5.02 TeV, L = 28 nb NN s +Pb, p -1 = 5.02 TeV, L = 25 pb s , pp ATLAS ψ Non-Prompt J/ -2.0 < y* < 1.5
Figure 10: The nuclear modification factor, RpPb, as a function of transverse momentum pT for prompt J/ψ (left)
and non-prompt J/ψ (right). The horizontal position of each data point indicates the mean of the weighted pT distribution. The vertical error bars correspond to the statistical uncertainties. The vertical sizes of coloured boxes around the data points represent the uncorrelated systematic uncertainties, and the horizontal sizes of coloured boxes
represent the pT bin sizes. The vertical sizes of the leftmost grey boxes around RpPb = 1 represent the correlated
systematic uncertainty.
ground-state quarkonium states and Z bosons as seen in Figure13, the deviation at highest event activity
may suggest that theΣEBackwardsT characterised event activity is not a robust scale parameter, but a more
* y 2 − −1 0 1 2 pPb R 0.6 0.8 1 1.2 1.4 1.6 1.8 -1 = 5.02 TeV, L = 28 nb NN s +Pb, p -1 = 5.02 TeV, L = 25 pb s , pp ATLAS ψ Prompt J/ < 40 GeV T p 8 < * y 2 − −1 0 1 2 pPb R 0.6 0.8 1 1.2 1.4 1.6 1.8 -1 = 5.02 TeV, L = 28 nb NN s +Pb, p -1 = 5.02 TeV, L = 25 pb s , pp ATLAS ψ Non-Prompt J/ < 40 GeV T p 8 <
Figure 11: The nuclear modification factor, RpPb, as a function of centre-of-mass rapidity y∗for prompt J/ψ (left)
and non-prompt J/ψ (right). The horizontal position of each data point indicates the mean of the weighted y∗
distribution. The vertical error bars correspond to the statistical uncertainties. The vertical sizes of coloured boxes around the data points represent the uncorrelated systematic uncertainties, and the horizontal sizes of coloured boxes
represent the y∗bin sizes. The vertical sizes of the leftmost grey boxes around R
pPb = 1 represent the correlated
systematic uncertainty. [GeV] T p 0 5 10 15 20 25 30 35 40 pPb R 0 0.5 1 1.5 2 -1 = 5.02 TeV, L = 28 nb NN s +Pb, p -1 = 5.02 TeV, L = 25 pb s , pp ATLAS (1S) ϒ -2.0 < y* < 1.5 * y 2 − −1 0 1 2 pPb R 0 0.5 1 1.5 2 -1 = 5.02 TeV, L = 28 nb NN s +Pb, p -1 = 5.02 TeV, L = 25 pb s , pp ATLAS (1S) ϒ < 40 GeV T p
Figure 12: The nuclear modification factor, RpPb, as a function of transverse momentum pT(left) and centre-of-mass
rapidity y∗(right) for Υ(1S). The horizontal position of each data point indicates the mean of the weighted pTor y∗
distribution. The vertical error bars correspond to the statistical uncertainties. The vertical sizes of coloured boxes around the data points represent the uncorrelated systematic uncertainties, and the horizontal sizes of coloured boxes
represent the bin sizes. The vertical size of the rightmost (left) and leftmost (right) grey boxes around RpPb = 1
represent the correlated systematic uncertainty.
7.3 Double ratio
The prompt ψ(2S) to J/ψ production double ratio, ρψ(2S)/J/ψpPb , is shown in Figure15in intervals of y∗. A decreasing trend with one-standard-deviation significance of the double ratio is observed from backward
to forward centre-of-mass rapidity. The pT and y∗ integrated bottomonium double ratios, ρΥ(nS)/Υ(1S)pPb
Centrality [%] 60 - 90 40 - 60 30 - 40 20 - 30 10 - 20 5 - 10 0 - 5 Z pPb R 0.5 1 1.5 2 ATLAS -1 = 5.02 TeV, L = 28 nb NN s +Pb p < 40 GeV (1S) ϒ T p < 1.5, (1S) ϒ y* -2.0 < < 40 GeV ψ J/ T p < 1.5, 8 < ψ J/ y* -2.0 < < 2.0 Z y* -3.0 < (1S) ϒ ψ Prompt J/ ψ Non-prompt J/ (2S) ψ Prompt
Figure 13: Prompt and non-prompt J/ψ, prompt ψ(2S) and Υ(1S) to Z boson yield ratio, RZpPb, as a function of event
centrality in p+Pb collisions. The ratio is normalised to the ratio integrated in the centrality range 0–90%. The error bars represent statistical uncertainties. The vertical sizes of coloured boxes around the data points represent
the uncorrelated systematic uncertainties, and the vertical size of the leftmost grey box around RZ
pPb= 1 represents
the correlated systematic uncertainty.
〉 Backwards T E Σ 〈 / Backwards T E Σ 0 0.5 1 1.5 2 2.5 3 3.5 〉 (nS) O 〈 (nS)/ O 0 0.5 1 1.5 2 2.5 3 3.5 ATLAS -1 = 5.02 TeV, L = 28 nb NN s +Pb p ψ Prompt J/ ψ Non-prompt J/ (1S) ϒ < 1.93 * y (1S), ϒ CMS * < 1.5 y -2.0 < < 40 GeV ψ T p 8 < < 40 GeV ϒ T p
Figure 14: Self-normalised yield for prompt J/ψ, non-prompt J/ψ and Υ(1S), compared to Υ(1S) self-normalised
yield ratio measured by CMS [26]. The horizontal position of each data point represents the normalised mean value
of theΣEBackwards
T distribution in minimum-bias data sample. The error bar represents statistical uncertainties, and
the vertical size of box underneath the data point represents the systematic uncertainties. The dotted line is a linear function with a slope equal to unity.
than unity by two standard deviations, and they are consistent with each other within the uncertainties. The double ratio as a function of centrality is shown in Figure17. Both ρψ(2S)/J/ψpPb and ρΥ(2S)/Υ(1S)pPb are found to decrease slightly with increasing centrality at the significance level of one-standard-deviation, while conclusions about ρΥ(3S)/Υ(1S)pPb are precluded by the size of the statistical uncertainties.
* y 2 − −1 0 1 2 Pb p ψ (2S) / J/ ψρ 0 0.5 1 1.5 2 -1 = 5.02 TeV, L = 28 nb NN s +Pb, p -1 = 5.02 TeV, L = 25 pb s , pp ATLAS < 40 GeV T p 8 < Double Ratio ψ (2S) to J/ ψ Prompt
Figure 15: The prompt charmonium production double ratio, ρψ(2S)/J/ψpPb , as a function of the centre-of-mass rapidity,
y∗. The vertical error bars correspond to the statistical uncertainties. The horizontal position of each data point
indicates the mean of the weighted y∗ distribution. The vertical sizes of coloured boxes around the data points
represent the uncorrelated systematic uncertainties, and horizontal sizes of the coloured boxes represent the bin sizes. (1S) ϒ (2S)/ ϒ ϒ(3S)/ϒ(1S) (1S) ϒ (nS) / ϒ Pbp ρ 0 0.2 0.4 0.6 0.8 1 1.2 ATLAS < 40 TeV T p * < 1.5 y -2.0 < -1 = 5.02 TeV, L = 25 pb s , pp -1 = 5.02 TeV, L = 28 nb NN s +Pb, p
Figure 16: The bottomonium double ratio, ρΥ(nS)/Υ(1S)pPb , integrated in the whole measured pT and y∗ range. The
vertical error bars correspond to the statistical uncertainties. The vertical sizes of boxes around the data points represent the systematic uncertainties.
Centrality [%] 40 - 90 20 - 40 5 - 20 0 - 5 ψ (2S) / J/ ψ Pbp ρ 0 0.5 1 1.5 2 -1 = 5.02 TeV, L = 28 nb NN s +Pb, p -1 = 5.02 TeV, L = 25 pb s , pp ATLAS < 40 GeV T p 8 < * < 1.5 y -2.0 < Double Ratio ψ (2S) to J/ ψ Prompt Centrality [%] 40 - 90 20 - 40 5 - 20 0 - 5 (1S) ϒ (nS) / ϒ Pb p ρ 0 0.5 1 1.5 2 -1 = 5.02 TeV, L = 28 nb NN s +Pb, p -1 = 5.02 TeV, L = 25 pb s , pp ATLAS < 40 GeV T p * < 1.5 y -2.0 < (1S) Double Ratio ϒ (nS) to ϒ (1S) Double Ratio ϒ (2S)/ ϒ (1S) Double Ratio ϒ (3S)/ ϒ
Figure 17: The prompt charmonium double ratio, ρψ(2S)/J/ψpPb , (left) and the bottomonium double ratio, ρΥ(nS)/Υ(1S)pPb ,
(right) as a function of event centrality in p+Pb collisions . The vertical error bars correspond to the statistical
uncertainties, and the vertical sizes of coloured boxes around the data points represent the uncorrelated systematic
uncertainties in p+Pb collisions. The vertical size of the leftmost yellow box around ρO(nS)/O(1S)pPb = 1 represents the
8 Summary
The double-differential production cross sections of five quarkonium states, J/ψ, ψ(2S), Υ(nS) (n =
1, 2, 3) are measured using using p+Pb (pp) collision data corresponding to an integrated luminosity
of 28 nb−1 (25 pb−1) at a centre-of-mass energy per nucleon pair of 5.02 TeV collected by the ATLAS
experiment at the LHC. The measured prompt charmonium production cross section in the range of
8 < pT < 40 GeV is found to be compatible with non-relativistic QCD predictions, while only the
bot-tomonium results at pT > 15 GeV can be described by the non-relativistic QCD predictions. The
meas-ured non-prompt production cross sections of J/ψ and ψ(2S) in pp collisions are found to be consistent with fixed-order next-to-leading-logarithm calculations.
The nuclear modification factors of prompt and non-prompt J/ψ in p+Pb collisions, RpPb, measured for
8 < pT < 40 GeV are found to be consistent with unity, and no apparent dependence on pT or rapidity
is observed in the measured range, which indicates weak modification of J/ψ production due to cold
nuclear matter effects at central rapidity and high pT. The RpPbfor Υ(1S) is measured for pT < 40 GeV
and is found to be smaller than unity at pT< 15 GeV, increasing with pTand becoming compatible with
unity at high pT. The observed suppression of Υ(1S) production in p+Pb collisions at low pT suggests
that the nuclear parton distribution functions are modified relative to those of the nucleon. No apparent
rapidity dependence of Υ(1S) RpPbis observed. The production ratios of prompt and non-prompt J/ψ
to Z boson are found to be constant in bins of centrality. As the Z boson production in p+Pb collisions
was found to scale with the number of binary collisions after applying centrality bias correction factors, the same conclusion can be drawn for J/ψ production in p+Pb collisions. The self-normalised yields of
ground-state quarkonium states in p+Pb collisions are found to correlate linearly with self-normalised
event activity expected for events with the highest event activity where the self-normalised yields show two-standard-deviation departure from the linear correlation trend.
The prompt charmonium double ratio is found to decrease slightly from the backward to the forward centre-of-mass rapidity. The prompt ψ(2S) production is suppressed with respect to prompt J/ψ
pro-duction in p+Pb collisions with a significance of one standard deviation. The production of excited
bottomonium states, Υ(2S) and Υ(3S), is found to be suppressed with respect to Υ(1S) in the integrated
kinematic ranges of pT < 40 GeV and −2 < y∗ < 1.5 in p+Pb collisions with significance at the level
of two standard deviations. Both the prompt ψ(2S) to J/ψ and Υ(2S) to Υ(1S) double ratios show de-creasing behaviour in more central collisions. The dede-creasing trends from peripheral to central are at the significance level of one standard deviation. A stronger cold nuclear matter effect is observed in excited quarkonium states compared to that in ground states.
This work expands the kinematic range of measured charmonium and bottomonium cross sections in
ppand p+Pb collisions. It thus serves as an additional dataset for constraining different models of cold
nuclear matter effects and quantifying heavy quarkonium production. In particular, the behaviour of the
ground-state yields as a function of centrality is found to match that of Z bosons, while excited states are relatively suppressed in more central collisions.
Acknowledgements
We thank CERN for the very successful operation of the LHC, as well as the support staff from our