Automated Ground Maintenance and Health
Management for Autonomous Unmanned Aerial Vehicles
by
Daniel R. Dale
S.B., EECS, MIT (2006)
S.B., Physics, MIT (2006)
Submitted to the Department of Electrical Engineering and Computer Science
in partial fulfillment of the requirements for the degree of
Master of Engineering in Electrical Engineering and Computer Science
at the Massachusetts Institute of Technology
June 2007
c
2007 Massachusetts Institute of Technology
All rights reserved.
Author . . . .
Department of Electrical Engineering and Computer Science
May 25, 2007
Certified by . . . .
Jonathan P. How
Associate Professor, Department of Aeronautics and Astronautics
Thesis Supervisor
Accepted by . . . .
Arthur C. Smith
Professor of Electrical Engineering
Chairman, Department Committee on Graduate Theses
Automated Ground Maintenance and Health Management
for Autonomous Unmanned Aerial Vehicles
by
Daniel R. Dale
Submitted to the Department of Electrical Engineering and Computer Science on May 25, 2007, in partial fulfillment of the
requirements for the degree of
Master of Engineering in Electrical Engineering and Computer Science
Abstract
Automated ground maintenance is a necessity for multi-UAV systems. Without such automation, these systems will become more of a burden than a benefit as human operators struggle to contend with maintenance operations for large numbers of vehi-cles. By creating autonomous UAV systems that can take care of themselves, human operators will be free to concentrate on higher level tasks such as using the informa-tion gathered by the system to direct future mission activities. This thesis describes the design, testing, construction, and usage of the first fully autonomous recharge system for small, battery-powered UAVs. This system was used to perform the first fully-autonomous quadrotor UAV long-term flight tests and to conduct multi-UAV mission management research. In addition, this thesis describes, to the best of our knowledge, the first landing and recharge of a UAV on a mobile recharge platform. Thesis Supervisor: Jonathan P. How
Acknowledgments
This thesis would not have been possible without the immense support of my family, my friends, the Aerospace Controls Laboratory, and MIT. Specifically, I would like to thank my mentor, Mario Valenti, for his unwavering support and assistance through-out my UROP and graduate student experience. For countless reasons, this thesis would not have happened without him. Brett Bethke for his support throughout my five years at MIT. Without his enthusiasm and guidance, I would not have joined the ACL and embarked on the work presented in this thesis. Adrian Frank for his friendship, support, and company during those late nights in the lab, as well as for his work on the RC control transmission capture device. My advisor Professor Jonathan How for his support during this project and for giving me the opportunity to work in the ACL. Boeing North America, Inc. for their generous funding of the “Vehicle and Vehicle System Health Management” research project. My friends and family for helping to keep me going during the tough times. And most of all, my parents for providing me with the best education possible and for their incredible outpouring of love and support throughout my life. Your love is the rock of my life. I am honored to be your son.
Contents
1 Introduction 15
1.1 Literature Review . . . 16
1.2 Thesis Contributions and Outline . . . 18
2 An Autonomous Vehicle Battery Recharge System 21 2.1 Lithium Polymer Battery Charger . . . 22
2.2 Button Press Interface . . . 24
2.3 LCD Display Information Capture . . . 26
2.4 Charger Isolation Relays . . . 30
2.5 Battery Isolation Board . . . 32
2.6 Recharge System Ground Electronics: The Full Picture . . . 35
2.7 Summary . . . 38
3 Automated Ground Maintenance for Autonomous Unmanned Aerial Vehicles 41 3.1 COTS Unmanned Aerial Vehicles . . . 42
3.2 Vehicle Electrical Contacts . . . 43
3.3 UAV Recharge Station Landing Pad . . . 44
3.4 Flight Testing Results . . . 46
3.4.1 Long Term Flight Test . . . 46
3.4.2 Mission Management Research . . . 47
4 Mobile Recharge Platform 57
4.1 COTS Unmanned Ground Vehicle . . . 57
4.1.1 UGV Electronics . . . 58
4.1.2 Controller Design . . . 60
4.1.3 Results . . . 62
4.2 Mobile Recharge Vehicle . . . 64
4.2.1 Configuration of the Mobile Recharge Vehicle . . . 64
4.2.2 Results . . . 68
5 Conclusion and Future Work 73 5.1 Future Work . . . 73
A Supplemental Electronics 75 A.1 RC Control Transmission Capture . . . 75
A.2 Quadrotor In-flight Battery Voltage Measurement . . . 79
B Fast Recharge 85 B.1 Cell Balancing . . . 85
B.2 Number of Landing Pad Contacts Needed for Fast Recharge . . . 87
B.3 Fast Recharge Time and Robustness . . . 88
B.4 Vehicle Electrical Contact Considerations . . . 93
List of Figures
2-1 Thunder Power 1010C Lithium Battery Charger . . . 22
2-2 TP1010C Charger System Diagram . . . 23
2-3 Charger Button Interface Model . . . 24
2-4 ATMEGA32 I/O Pin Schematic . . . 25
2-5 Charger Button Interface Modification . . . 26
2-6 LCD Capture Schematic . . . 27
2-7 Captured Data from LCD . . . 28
2-8 Filtered Data from LCD . . . 29
2-9 Representation of LCD Enable Signal Behavior Writing Main Menu on LCD . . . 29
2-10 Capture Process Event Diagram . . . 31
2-11 Charger Isolation Relays . . . 32
2-12 Battery Isolation Board with Vehicle Electronics Shutoff . . . 33
2-13 Battery Isolation Board with Offboard Power for Vehicle Electronics . 34 2-14 Recharge System Diagram . . . 36
2-15 Recharge System Electronics Within Plastic Enclosure . . . 37
2-16 Captured Recharge Process Data for a 1320 mAh LiPoly Battery . . 39
3-1 Draganflyer Quadrotor Helicopters in Flight . . . 42
3-2 X-UFO Quadrotor Helicopter in Flight . . . 43
3-3 Quadrotor Base with Copper Contacts . . . 44
3-4 Fifth Vehicle Electrical Contact Underneath Quadrotor Battery Base Plate . . . 45
3-5 Landing Pad Design Configured with Five Electrical Contacts . . . . 46
3-6 Landing Pad Electrical Contact Structure . . . 47
3-7 Draganflyer Quadrotor Vehicle in Recharge Station . . . 48
3-8 UAV Hovering Over Recharge Landing Station During a Long Term Flight Test . . . 49
3-9 Charge Process Data from a Nine Hour Long Term Flight Test . . . . 50
3-10 Recharge Stations Built for Multi-agent UAV Mission Management Research . . . 51
3-11 Persistent Surveillance Mission Setup . . . 51
3-12 Battery Isolation Board Connected to 2000mAh Battery and Dragan-flyer Vehicle . . . 52
3-13 Flight Testing with Voltage Measurement Device . . . 52
3-14 Battery Voltage Data During Flight Without Battery Isolation Board 54 3-15 Battery Voltage Data During Flight With Battery Isolation Board . . 55
4-1 Miniquake UGV with Vicon Position System Reflectors . . . 58
4-2 Miniquake UGV Electronics . . . 59
4-3 UGV Electronics Schematic . . . 59
4-4 First Quadrant Heading Error Geometry . . . 61
4-5 Second Quadrant Heading Error Geometry . . . 61
4-6 Third Quadrant Heading Error Geometry . . . 63
4-7 Fourth Quadrant Heading Error Geometry . . . 63
4-8 UGV Driving a Box Defined by Four Waypoints . . . 65
4-9 UGV Driving a Figure Eight Defined by Four Waypoints . . . 66
4-10 Mobile Recharge Vehicle with Quadrotor Attempting to Land . . . . 67
4-11 Mobile Recharge Platform Landing Sequence . . . 69
4-12 X-Y Plot of Quadrotor Landing on Moving Recharge Platform . . . . 70
4-13 Plot of Quadrotor Height over Time from Takeoff to Landing on Mobile Recharge Platform . . . 71
A-1 RC Control Transmission Capture Device . . . 76
A-2 Structure of a Pulse-Position-Modulation (PPM) Signal . . . 76
A-3 RC Signal Capture Device Schematic . . . 77
A-4 RC Signal Capture Device Software Flow Chart . . . 78
A-5 Captured Data from One Channel Showing Transmitter Stick Motion Over Time . . . 80
A-6 Flight Testing with Voltage Measurement Device . . . 81
A-7 Voltage Measurement Harness . . . 82
A-8 Voltage Measurement Device . . . 83
A-9 Block Diagram of Voltage Measurement Device . . . 83
A-10 Schematic of Voltage Measurement Device . . . 84
B-1 The Thunder Power TP-205V Lithium Polymer Battery Cell Balancer 86 B-2 Resistive Model of Landing Pad with Four Contacts and Cell Balancing 87 B-3 Resistive Model of Landing Pad with Six Contacts and Cell Balancing 88 B-4 Corroded Landing Pad . . . 89
B-5 Clean Landing Pad . . . 89
B-6 Vehicle Electrical Contact Sizes . . . 90
B-7 Fast Recharge Test Setup . . . 91
B-8 Data from Fast Recharge Tests . . . 92
B-9 Vehicle Contact Without Tape . . . 93
B-10 Vehicle Contact With Tape . . . 94
B-11 Battery Charge Data Showing Oscillatory Behavior . . . 95 B-12 Battery Charge Data from 3A Recharge Using Contacts with Tape . 96 B-13 Battery Charge Data from 6A Recharge Using Contacts with Tape . 97
List of Tables
2.1 LCD Control Line Functions . . . 27
2.2 Write Command Pair ASCII Code Generation . . . 29
2.3 Recharge System Command Codes . . . 36
2.4 Format of Response to Recharge State Request Command . . . 38
2.5 Recharge System States . . . 38
A.1 Capture Device Command Codes . . . 79
Chapter 1
Introduction
Automation is used by many industries to increase operational efficiency while re-ducing costs. For example, the semiconductor industry uses automated processes to make cost effective products in an efficient manner. In addition, the automotive industry uses automated manufacturing systems to produce affordable, high quality motor vehicles. Since robots are used to perform routine operations such as spot welding, human workers are able to focus on more advanced, safety-critical tasks.
Similarly, advances in automation and autonomy have lead to the development of unmanned robotic systems. For example, unmanned aerial vehicles are beginning to revolutionize both civilian and military aerial activities. Although UAVs are at the forefront of today’s aerospace industry, the roots of remote controlled unmanned aerial vehicles reach back over one hundred years to the end of the nineteenth century. While the pioneers of aviation were attempting to pilot the first flying machines, other visionary men were anticipating a day when humans would be able to pilot vehicles remotely. One such man was the great inventor, engineer, and scientist Nikola Tesla. During the 1890’s, his experiments with radio waves led him to conclude that vehicles with a self-contained means of propulsion and steering could be operated from a distance [14]. This work culminated in 1898 at the Electrical Exposition in New York’s Madison Square Garden where Tesla demonstrated the first remote-controlled boat [23].
until the 1930’s when the invention and refinement of stabilization systems, radio telecommunications, and servo-motors allowed low-cost aircraft to be built in large numbers. Early UAVs, such as the Radioplane OQ-1, were used by the military as target drones for WWII anti-aircraft gunners [14]. By the time of the Vietnam War, UAVs were used on a regular basis for a variety of missions. For example, the AQM-34 Lightning Bug and the GTD-21 performed reconnaissance, electronic and communications intelligence collection, decoy, leaflet-dropping, and munitions delivery missions [14, 25]. In the decades after the Vietnam War, UAVs continued to develop and take advantage of new computational, algorithmic, sensory, propulsion, and communications technologies to better perform long-endurance missions. For example, the popular Predator UAV can remain airborne for up to 24 hrs [20].
Although significant progress has been made in automating the mission activities of UAVs, little has been said on how to automate ground maintenance activities. UAV systems stand to benefit from the automation of routine maintenance tasks that are currently performed by human operators. For example, the automation of a task such as refueling would provide UAV systems with significant cost and efficiency gains. Such ground maintenance automation would also enable UAV systems to scale from single- to multi-vehicle systems in a cost effective way. By enabling mission systems to conduct maintenance activities autonomously, future systems will possess the capability to autonomously assess, plan, and execute fully-autonomous mission operations. This capability will be critical in saving time, reducing costs, and making multi-UAV systems practical.
1.1
Literature Review
Interest in autonomous recharge systems for robotic vehicles began in the early 1950’s with the design and construction of the Machina Speculatrix autonomous ground ve-hicle by William Grey Walter [24]. This ground veve-hicle system was used to investigate the nature of intelligent life and to test the ability of scientists to create artificial life. Each of the ground vehicles used by Walter in his experiments had the capability
to sense a low battery situation, navigate toward a recharge station, recharge in the station, and continue on with their autonomous operation.
Research into autonomous vehicle recharge systems continues today. At the University of Tsukuba, researchers constructed an autonomous ground vehicle and recharge system in order to facilitate autonomous ground vehicle navigation and con-trol experiments [8]. The system was tested by running an autonomous vehicle for one week none stop. During the week-long experiment, over one thousand recharge dockings were successfully accomplished. The Robotic Systems Laboratory at the Australian National University uses an autonomous recharge system to enable exper-iments into robotic mapping and localization of dynamic environments [1, 11]. At the University of Southern California, a similar recharge system for ground vehicles was created [19]. The MiNT testbed at Stony Brook University uses autonomous ground vehicles with recharge capability to create a system of mobile autonomous wireless network nodes that can be used for experimentation with mobile, multi-hop, wireless network protocols.[3] The recharge capabilities of the MiNT testbed allow the system to be used at any time. This increases the productivity of the system and frees researchers to spend less time maintaining the testbed and more time conducting research.
While knowing how to recharge a vehicle is important, a recharge maintenance system is of little value if a vehicle does not make it back to the recharge station before running out of power. Most past research into battery monitoring and state estima-tion has focused on using direct, invasive measurements of current flow and voltage level to calculate a battery’s state of charge (SOC). This research focuses on calcu-lating SOC using complex analytical models of internal battery dynamics [17, 18]. However, these approaches require significant knowledge of battery properties and internal dynamics. Some recent research has sought to simplify the construction of battery SOC models by using machine learning techniques [9]. This approach does not require knowledge of internal battery chemistry and can be easily extended to mul-tiple battery chemistries. These battery modeling and state prediction technologies have been used in the computer industry, where laptops are designed to warn users
of low battery conditions. In addition, hybrid electric vehicles use similar techniques to efficiently manage their battery subsystems.
As battery chemistries and predictive modeling techniques improve, researchers continue to push the boundaries of small, battery-powered UAV system capabilities. Many researchers are interested in creating swarms of cooperative UAVs [5, 15]. The Department of Defense is interested in swarming technology and refers to fully au-tonomous swarms in its UAV technology roadmap as the highest level of auau-tonomous control [20]. At the Massachusetts Institute of Technology, the Aerospace Controls Laboratory (ACL) has constructed an indoor multi-vehicle testbed for the study of UAV swarming technologies [22]. The RAVEN system has the ability to fly multiple UAVs in a controlled environment. This testbed allows for researchers to integrate and flight test battery recharge, state prediction, and multi-UAV mission management technologies. The RAVEN also has allow researchers to examine questions relating to the automation of UAV ground maintenance.
1.2
Thesis Contributions and Outline
The goal of this thesis is to examine and implement an autonomous vehicle recharge system for small, battery-powered aerial vehicles. This thesis presents the first imple-mentation of an autonomous UAV battery recharge landing station. This station has been used to conduct the first fully-autonomous, long-term flight tests with quadro-tor UAVs. It has also enabled other researchers to conduct state-of-the-art mission management research using the MIT ACL RAVEN system. In addition, this thesis also describes the first mobile recharge platform for autonomous UAVs.
This document begins in Chapter 2 describing the recharge system electronics designed to enable battery-powered autonomous vehicles to recharge themselves au-tonomously. Chapter 3 explains the customizations applied to the recharge system in order to create a recharge landing station for small, battery-powered UAVs. Chapter 4 describes the construction of UGVs, specifically the design and testing of a mobile recharge platform. Chapter 5 concludes the thesis with final thoughts and future work
directions. The appendices at the end of the thesis support the work of the thesis. Appendix A describes supplemental electronics built during the course of thesis work. Appendix B presents findings about adding fast recharge capabilities to the recharge system described by the thesis.
Chapter 2
An Autonomous Vehicle Battery
Recharge System
This chapter describes a battery recharging station for autonomous vehicles. The goal of this recharge system is to allow battery-powered aerial vehicles to autonomously recharge their batteries during long duration missions. The system has the ability to provide battery charge data in real time. This data can be passed to vehicle health management systems for use in battery health prediction. This information can also be used to predict the remaining recharge process time, estimates on vehicle flight time, and the number of cycles until battery needs replacement.
The full recharge system consists of several components: ground electronics, bat-tery isolation board, landing pad, and vehicle electrical contacts. This chapter dis-cusses the ground electronics and battery isolation board that form the functional core of the recharge system’s technology. At the center of the ground electronics is a commercially-available lithium polymer battery charger controlled by an AT-MEGA128 microcontroller on a Robostix board [6]. This microcontroller is the brain of the recharge system and serves the hub that controls the charge process while interacting with external computers through a TTL serial interface. In addition, a battery isolation board may be placed onboard vehicles to isolate the battery from the vehicle electronics during the recharge process.
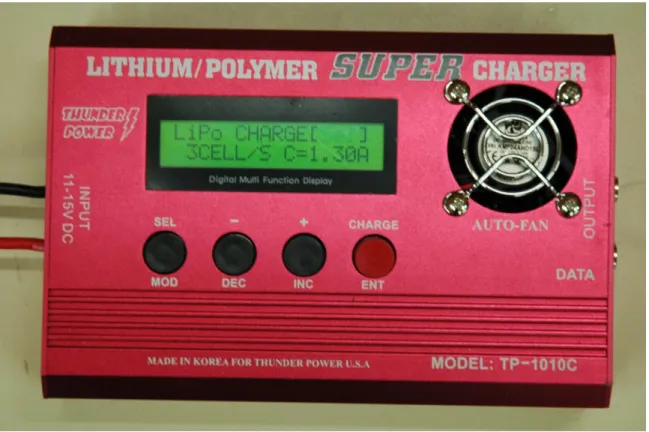
Figure 2-1: Thunder Power 1010C Lithium Battery Charger
quadrotor aerial vehicles in the RAVEN [22], the electronics and software in the system can be easily adapted to new types of battery-powered vehicles. As long as a vehicle uses lithium polymer batteries, this recharge system can recharge it. Adaptability to a wide range of battery-powered vehicles is a strength of this recharge technology.
2.1
Lithium Polymer Battery Charger
The ground electronics for the recharge station were built around a commercial avail-able, off-the-shelf (COTS) lithium polymer batter charger. A COTS charger was used to reduce the design and construction time of the recharge system. The charger selected for the recharge system was the Thunder Power 1010C Lithium Battery Charger, shown in Figure 2-1. The Thunder Power 1010C is one of the most advanced lithium battery chargers on the market. It possesses a number of safety features that make it attractive for use in an autonomous recharge system. Safety features include
Figure 2-2: TP1010C Charger System Diagram
but are not limited to: battery reverse polarity warning, over voltage prevention, current and voltage monitoring, initial charging mode to recondition deeply depleted batteries, close integration with cell balancer devices to allow fast recharge times us-ing currents up to 3C, and a simple user interface that allows for a relatively simple microcontroller interface.
To integrate the TP1010C charger into the recharger system, it was necessary to reverse engineer the charger in order to determine how to interface the charger with the ATMEGA128 microcontroller used to control the recharger system. Figure 2-2 shows a simplified system diagram of the TP1010C charger. The brain of this charger is an ATMEGA32 microcontroller. This microcontroller monitors and directs the charge process using feedback from current and voltage sensing circuitry. It receives user input from four SPST momentary push button switches and displays output to the user on an LCD display. While there is no direct electrical interface to the microcontroller, it is possible to interface with the TP1010C ATMEGA32 microcontroller by simulating user button presses and by reading the LCD control lines to collect charge process data.
Figure 2-3: Charger Button Interface Model
2.2
Button Press Interface
In order for an external microcontroller to interact with the TP1010C charger, it is necessary to tap into the user interface by simulating user button presses. Users are able to enter commands into the charger by way of four buttons presented on the exterior of the charger case. Each of these buttons have a different function associated with them in the various charger modes of operation.
Upon opening of the charger, inspection of the buttons shows that they are push-to-make SPST momentary switches. These buttons are attached on one end to a resistor and on the other end to the LCD data lines that run from the ATMEGA32 microcontroller to the LCD display. A schematic of this configuration is shown in Figure 2-3. When a button is not being pressed, the button acts as an open circuit. However, when a button is pressed, the circuit is closed, which connects the resistor to the button’s LCD data line.
The ATMEGA32 microcontroller is able to sense the presence of a resistor on the data line by activating the internal pull up resistor attached to its I/O pins. As shown in Figure 2-4, the I/O pin pull up resistor is controlled by an internal FET. When this FET is off, the pull up resistor is not connected to the I/O pin; when the FET is on, the pull up resistor is connected to the I/O pin. If the pull up resistor
Figure 2-4: ATMEGA32 I/O Pin Schematic
is not connected to the I/O pin when the button press has connected the button resistor to the LCD data line being driven by the I/O pin, then the I/O pin will have a logic high voltage level. However, if the internal pull up resistor is connected to the pin during a button press, then the pull up resistor and button resistor will act as a voltage divider. Since the pull up resistor has a resistance an order of magnitude larger than the button resistor, the I/O pin will have a logic low voltage level. When the ATMEGA32 of the TP1010C charger reads the logic value of the LCD data lines, it can determine whether a button press is occurring by checking whether it reads a logic high or low value off of the I/O pins connected to these lines.
To simulate a button press on the TP1010C charger, the mechanical switch can be replaced with a MOSFET. This MOSFET acts as an electrically-controlled switch. Figure 2-5 shows the schematic for the modified button interface. The drain of the MOSFET is connected to the button’s LCD data line, while the MOSFET’s source terminal is attached to ground. A resistor is connected between the MOSFET gate and ground to protect against floating voltages in situations where the gate is not connected to a voltage signal during operation. The MOSFET gate can be controlled by an external microcontroller’s I/O pins to turn the MOSFET off and on. When all four buttons are bridged by MOSFETS in this way, an external microcontroller
Figure 2-5: Charger Button Interface Modification
will have full access the all the TP1010C charger’s functions without disabling the charger’s push button interface. Therefore, an operator can override the microcon-troller’s commands via the push button interface if necessary.
2.3
LCD Display Information Capture
The TP1010C charger provides feedback to users using a two line, 16 character, HD44780-based LCD display. Located just above the buttons on the face of the TP1010C charger, this LCD allows the user to view menus, charger parameters, error messages, and status information. The key to building a robust autonomous recharge system around the TP1010C is being able to capture the information displayed on the LCD. One way to accomplish this capture of LCD text is to directly tap into the LCD control lines with an external microcontroller and reconstruct the text being sent to the display.
There are seven control lines for the LCD. The functions of each line are outlined in Table 2.1. By tapping these lines and running the signals to an external microcon-troller, as shown in Figure 2-6, it is possible to read the data traveling to the charger LCD display. When a character is written to the LCD display, the falling edge of the enable signal is followed by a data and control signal hold period. It is this falling edge of the enable line that tells the display to check the other six lines for valid
Figure 2-6: LCD Capture Schematic
Signal Purpose ATMEGA128 Pin Mapping
D4 Data bit 4 PC0
D5 Data bit 5 PC1
D6 Data bit 6 PC2
D7 Data bit 7 PC3
RS Select between instruction or data input PC4
RW Read Write select PC5
E Enable signal to execute command PE6 - External Interrupt 6 Table 2.1: LCD Control Line Functions
Figure 2-7: Captured Data from LCD
control signals and data. During the hold period, the data and control instructions being transferred from the ATMEGA32 microcontroller to the LCD display driver chip must not change. By connecting the enable signal to an external interrupt pin on our recharge system’s ATMEGA128 microcontroller, the falling edge of the enable signal can trigger an external interrupt handler that immediately reads the LCD con-trol and data lines while they are being held for the LCD. Figure 2-7 shows example data captured with this interrupt handler.
Once this data been captured, the microcontroller needs to parse the signal to determine what character has been written to the display. First, the microcontroller needs to filter out commands sent to the LCD that do not result in a character being written to the screen. This is accomplished by checking the values of the RS and RW lines. When writing characters to the display, the RW line is low and the RS line is high. Filtering for displayed characters works by looking for data samples where RW = 0 and RS = 1 and ignoring all the rest. This corresponds to the high nibble of PortC being 0x1. Figure 2-8 shows the filtered data with strikethrough. The four pairs of captured datum represent four characters that were written to the LCD display. It takes two commands to write one character because the LCD is operating in 4-bit transfer mode. In this mode, one 8-bit unit of data is sent in two 4-bit transfers, with the the high nibble of the data sent first, followed by the low nibble. The advantage of this mode is that it reduces the number of wires that must run between microcontroller and LCD.
After filtering for commands corresponding to characters written on the display has occurred, the next step in the process is to determine which ASCII character was displayed on the screen. Fortunately, the HD44780 LCD driver chip makes this step easy. When writing a character to a HD44780-based LCD, the ASCII code
Figure 2-8: Filtered Data from LCD
Figure 2-9: Representation of LCD Enable Signal Behavior Writing Main Menu on LCD
of the character is transfered as the data of the write command. This means that reconstructing the character written to the display consists of combining the the low order nibbles of write command pairs. The low nibble of the first captured write command is the high nibble of the ASCII code, and the low nibble of the second write command is the low nibble of the ASCII code. Table 2.2 shows the conversion of write command pairs into ASCII characters.
First Command Second Command ASCII Code Character Written
0x14 0x1C 0x4C L
0x16 0x19 0x69 i
0x15 0x10 0x50 P
0x16 0x1F 0x64 o
Table 2.2: Write Command Pair ASCII Code Generation
Once the recharge system ATMEGA128 microcontroller can read individual char-acters written to the charger LCD display, the last step in the LCD data collection process is to reconstruct the full text on the display. As demonstrated in Figure 2-9, the TP1010C charger sends commands to the LCD in bursts. Each burst corresponds to a complete rewrite of the LCD display. To capture the characters on the display, the external microcontroller connected to the LCD data and control lines must capture all characters written during a burst. The length of the bursts and the periodicity of
the bursts vary depending on the charger’s mode; however, the general burst pattern holds in all modes needed for the recharge system, mainly the main menu, initial charging, charging, and finished charging.
To detect the gap between bursts that write characters to the display, a timer overflow interrupt is used. When the timer overflow occurs, a timer interrupt is triggered. This interrupt arms the external interrupt handler in order to capture the data and control signals being sent to the LCD. Each time the external interrupt triggers, the external interrupt handler immediately reads the values on the LCD lines. After the control and data lines are read, the handler parses the captured data for ASCII character codes being written to the display. Captured ASCII character codes are stored in ATMEGA128 internal SRAM memory. After a burst ends, the timer overflow occurs a second time and ends the capture of LCD data. This process is outlined in Figure 2-10. Once all of the display’s characters are in main memory, the recharge system ATMEGA128 microcontroller is free to parse the characters for charge process data.
2.4
Charger Isolation Relays
The charger isolation relays sit between the TP1010C charger battery terminals and the landing pad contacts. The purpose of these isolation relays is to prevent electrical transients from interfering with vehicle takeoff and landing from the landing pad. During testing of the recharge system, some vehicles experienced a high rate of receiver dropouts due to electrical transients. These transients occur when the vehicle battery breaks contact with the charger battery terminals. As a vehicle takes off from the pad, the electrical transient causes the vehicle’s receiver to lose contact with its transmitter. This causes the vehicle to fall back into the pad. After a brief pause, the receiver regains the signal. However, attempting takeoff again results in another transient and another failed takeoff attempt. This process only ends either if one transient is not large enough to disable the receiver or if the receiver regains signal before the vehicle touches back down on the landing pad.
Figure 2-11: Charger Isolation Relays
The solution to this electrical transient problem is to physically isolate the charger from the landing pad and vehicle battery when the battery is not being charged. This isolation is accomplished by adding two relays in series with the two charger terminals. When the vehicle battery is being charged, the relays are closed to allow charging current to flow past them. However, when not in the charging process, the relays are left open to isolate the vehicle from the charger.
2.5
Battery Isolation Board
In some instances, it is advantageous to isolate the vehicle’s battery from the vehicle electronics during the charging process. For example, leaving the battery attached to the vehicle electronics during recharge causes the charger to supply power to the electronics while it is charging the battery. This power loss to the electronics lengthens the charge process. The additional time added to the charge process is proportional to the amount of power drawn by the electronics. In order to avoid longer charge times, a battery isolation board can be attached to vehicles. Two versions of this board are outlined in this section. One version simply turns off the vehicle electronics. The other isolates the vehicle electronics and keeps them on by supplying them with
Figure 2-12: Battery Isolation Board with Vehicle Electronics Shutoff
offboard power.
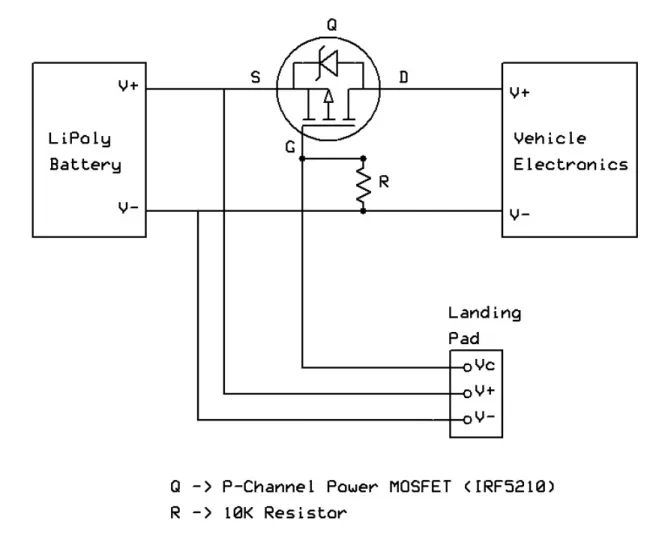
Figure 2-12 shows the schematic of the battery isolation board with vehicle elec-tronics shutoff. A P-channel MOSFET sits on the V+ wire running between the battery and the vehicle electronics. During flight, the gate of the PFET is connected to ground through a pulldown resistor. During recharge, a signal relay on the recharge station connects V+ to Vc. With Vgs = 0, the PFET turns off and blocks current
from flowing to the vehicle electronics. The battery can now be charged through the V+ and V- contacts on the landing pad without having power from the charger flow into the electronics.
Figure 2-13 shows the schematic for the battery isolation board with offboard power for the vehicle electronics. Two power MOSFETs isolate both terminals of the
Figure 2-13: Battery Isolation Board with Offboard Power for Vehicle Electronics
battery from the vehicle electronics. A signal N-channel MOSFET acts as an inverter for the offboard control signal. During flight, the two power MOSFETs remain on, allowing current to flow from the battery to the vehicle electronics. When the recharge process begins, a relay on the recharge system sends a signal to the isolation board that shuts off the power MOSFETs. This signal sets the gate voltage of the high side PFET equal to the voltage at the PFET’s source terminal. With Vgs = 0, the PFET
shuts off. At the same time, the control signal sets the gate voltage on the signal NFET high. The NFET turns on and lowers the gate voltage on the low side power NFET. With Vgs = 0, the NFET shuts off. Since the body diodes of the two power
MOSFETs are oriented with the flow of current, turning off the MOSFETs will in essence introduce diodes into the current path. While these diodes cause voltage drops along the current path, they allow power to flow into the vehicle electronics. With the MOSFETs off, the relays connecting offboard power to the vehicle electronics can be closed by the recharge system. As long as the voltage supplied by the offboard power supply is higher than the voltage on the positive terminal of the battery, no
current will flow from the battery to the vehicle electronics. With the offboard power applied, the battery is isolated from the vehicle electronics and ready for recharge.
2.6
Recharge System Ground Electronics: The Full
Picture
The recharge system is designed to integrate with other maintenance system compo-nents under the control of an autonomous health management system that monitors vehicle battery state. As such, the recharge system is not designed to detect an in-coming vehicle on its own. When a vehicle docks, the recharge system waits to be told by an external source to begin the charge process. In the RAVEN laboratory setup, after a vehicle docks with the station, the mission system commands the vehi-cle recharge system to begin the recharge process. Once given the command to start, the recharger will continue charging the vehicle until the battery is full. If the vehicle needs to take off before a full charge state is reached, then the vehicle or mission sys-tem can notify the recharge syssys-tem to stop the charge process. Similarly, the recharge system only transmits state data over the station’s serial link when requested.
As shown in Figure 2-14, the recharge system is composed of several components. As described earlier, the central component is the Thunder Power TP1010C lithium polymer battery charger; this is the device that charges the battery onboard the vehicle. An ATMEGA128 microcontroller controls the charger and runs the recharge system internal software. This microcontroller interacts with the TP1010C charger by simulating user button presses and by reading the characters displayed to the charger’s LCD display. It controls the charger isolation and signal relays. The microcontroller interacts with the outside world through a TTL serial interface. Each Recharge station can be connected to vehicle health management computers using a USB-to-TTL cable. A picture of the recharge system within its enclosure is shown in Figure 2-15.
Figure 2-14: Recharge System Diagram
serial connection. The protocol consists of three commands. A “1” character is sent to the recharge system over the serial line to start the recharge process, while a “2” is sent to stop recharge before it has completed. In addition, a “3” is sent to request the state of the system. The recharge system transmits data over the serial line only in response to a request for charger state command. There are no automatic acknowledgments to start or stop recharge commands. Table 2.3 summarizes this simple command protocol.
Character ASCII Code Command 1 0x31 Start Recharge 2 0x32 Stop Recharge 3 0x33 Request Charger State Table 2.3: Recharge System Command Codes
The recharger state response is formatted as shown in Table 2.4. The response is a series of alphanumeric characters that represent the state of the recharge system, the voltage of the battery under charging, the current flowing into the battery, the
cumulative current that has flown into the battery, and the duration of the charge pro-cess. This string is terminated with a newline character. Tabl 2.5 lists the recharger’s states.
State Voltage Current mAh Time 3 12.60 0.76 00089 0:05:44
Table 2.4: Format of Response to Recharge State Request Command
Character State 1 Ready to Charge 2 Initial Charge 3 Charging 4 Finished Charging Table 2.5: Recharge System States
2.7
Summary
Using the recharge system described in this chapter, it is possible to monitor battery charging in real time and collect data used to analyze the charging profiles about batteries. Figure 2-16 shows an example charge cycle of a 1320 mAh battery. Voltage, current, and cumulative current are plotted against time. This data can be used by vehicle health management algorithms to predict remaining time till charge process complete, vehicle flight time, and number of cycles until battery needs replacement.
Chapter 3
Automated Ground Maintenance
for Autonomous Unmanned Aerial
Vehicles
While the recharge system electronics described in the previous chapter are appli-cable to any vehicle powered by a lithium polymer battery, the hardware described in this chapter is specific to the vehicles used in the testing of the recharge sys-tem. Specifically, this chapter describes the vehicle-specific components that allow for the automated recharge of autonomous UAVs. The small, battery-powered UAVs described in this chapter are COTS quadrotor helicopters. The extent of recharge modifications to the vehicles consist of electrical contacts attached to the frame of the vehicle and, in some cases, a battery isolation board inserted between the battery and the vehicle. No modifications were made to the vehicle electronics. Customization of the ground recharge system consists of adding a landing pad above the electronics that mate with the electrical contacts fitted to the frame of the quadrotor UAVs. This landing pad is designed to passively guide the UAV into the proper landing location for recharge.
Figure 3-1: Draganflyer Quadrotor Helicopters in Flight
3.1
COTS Unmanned Aerial Vehicles
Two commercially-available, off-the-shelf (COTS) quadrotor helicopters were selected as the UAVs adapted for use with the recharge system: the Draganflyer V Ti Pro and the X-CSM Hightech X-3D/X-UFO [4, 7, 16]. These quadrotors were selected because they are small, lightweight, durable, and fly for over ten minutes with a charged battery. The Draganflyer quadrotor with black nylon blades is approximately 80 cm from blade tip to blade tip while the X-UFO is approximately 36 cm from blade tip to blade tip [7]. Without batteries, the Draganflyer weighs approximately 400 g and the X-UFO weighs 300 g. With a 2000mAh battery, the Draganflyer can fly 13-17 mins while the X-UFO can fly for 20-30 min. Furthermore, the quadrotor design of the vehicles has well understood dynamics and control strategies [2, 21].
Figure 3-2: X-UFO Quadrotor Helicopter in Flight
outfitted with a Draganflyer frame. Figure 3-2 shows the added frame components. This modification provides the X-UFO with the same base as the Draganflyer and allows both quadrotors to share one landing pad design. An extra benefit to adding the Draganflyer frame to the X-UFO vehicle is the additional mounting points for motion capture system reflectors, seen in Figure 3-2.
3.2
Vehicle Electrical Contacts
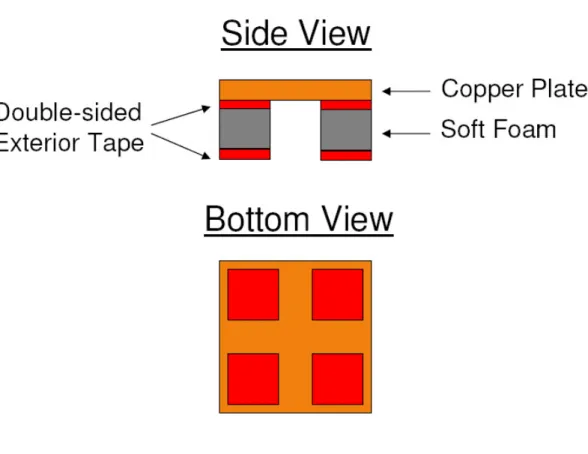
The copper electrical contacts were attached to the bottom of the quadrotor base to provide an electrical conduit for power and signals to flow from the recharge station. Shown in Figure 3-3, these electrodes a attached to the bottom of each plastic leg with exterior-grade, double-sided tape. Because the plastic feet are not conductive, additional electrical isolation between the electrode and the quadrotor leg is not required.
Figure 3-3: Quadrotor Base with Copper Contacts
bottom of the quadrotor battery plate. Caution is required in using this contact since the battery plate is carbon fiber. A layer of electrical tape is sufficient to insulate the contact from the conductive plate and prevent short circuits on board the vehicle. Figure 3-4 shows an early recharge system prototype vehicle with a fifth contact on the underside of the battery base plate.
3.3
UAV Recharge Station Landing Pad
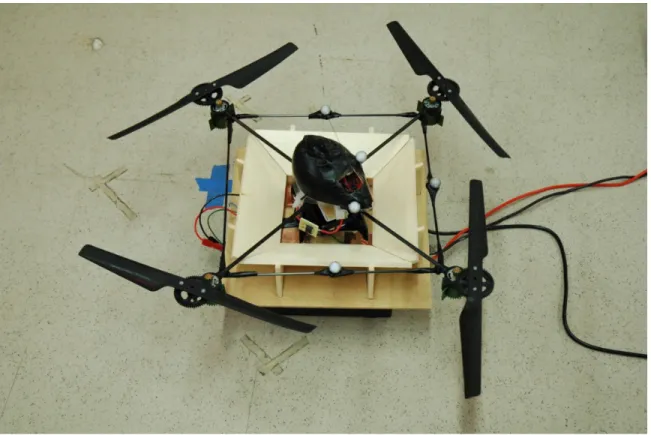
The recharge station UAV landing pad is designed to passively guide UAVs into the proper landing location for recharge. Shown in Figure 3-5, the landing pad has an inverted pyramid shape. If a quadrotor descends into the pad with X-Y position error, its base will slide down against the sidewalls of the pad toward the electrical contacts in the middle of the pad. This passive approach to creating landing error tolerance was selected over active methods of position error correction due to its simplicity,
Figure 3-4: Fifth Vehicle Electrical Contact Underneath Quadrotor Battery Base Plate
ease of construction, and effectiveness.
Landing pads can be configured with up to five electrical contacts. As shown in Figure 3-6, each electrical contact has a layered structure that places a conductive plate, usually made of copper, on top of four pieces of soft foam. The sponginess of the foam ensures that quadrotors settle onto the ground station contact pads correctly, even in situations where quadrotor frames have become slightly deformed due to vehicle wear. Four small pieces of foam were used on each contact, rather than one large piece, in order to ensure that the contacts compressed sufficiently for good electrical contact despite the light weight of the quadrotors. Figure 3-7 shows a quadrotor sitting in a recharge landing pad.
Figure 3-5: Landing Pad Design Configured with Five Electrical Contacts
3.4
Flight Testing Results
3.4.1
Long Term Flight Test
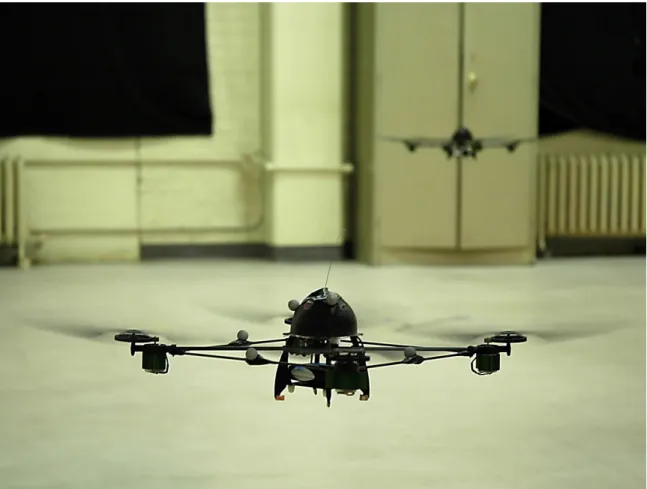
Long term flight testing of the recharge system was performed using the MIT ACL RAVEN system in order to assess the repeatability of quadrotor landings into recharge stations. For this testing, quadrotors outfitted with the recharge system modifications described in this chapter were programmed to take off from the ground, hover over a recharge station until its battery had depleted, and then autonomously land in the recharge station below it. Once the system had finished recharging the vehicle battery, the quadrotor would repeat the cycle. Figure 3-8 shows a vehicle hovering over the recharge system during a long term flight test. This test has been run several times, once for a nine hour period and twice for twenty four hours each. Figure 3-9 shows the a graph of recharge system data collected during the nine hour long term flight test. Over the course of this test, the vehicle completed nine flights, nine successful landings, and nine battery recharges. During this fifty plus hours of recharge system
Figure 3-6: Landing Pad Electrical Contact Structure long term flight testing, only one landing failure occurred.
3.4.2
Mission Management Research
Shown in Figure 3-10, a number of recharge stations were constructed to support multi-agent mission management UAV research. These recharge stations have been used to perform experiments with multiple quadrotor vehicles operating in cooper-ation with one another. In one such experiment, several recharge pads were set up in the RAVEN indoor flight testbed to support quadrotor vehicles flying a persistent surveillance mission. The goal of this mission was to keep one quadrotor hovering over a location of interest for an indefinite period of time. As shown in Figure 3-11, while one vehicle hovers over a surveillance area, other vehicles recharge their batteries in recharge stations. Once the flight vehicle has exhausted its battery or experienced a failure, it will attempt to return to base. In addition, the mission manager software
Figure 3-7: Draganflyer Quadrotor Vehicle in Recharge Station
takes off a vehicle whose battery has been recharged by the recharge system and sends it out into the field to replace the returning vehicle. In a persistent surveillance mis-sion, this process perpetuates indefinitely. For more flight results and a description of these experiments, consult Ref. [21].
3.4.3
Battery Isolation Board Performance Tradeoff
A set of flight tests were performed to assess the trade offs associated with adding a battery isolation board to the vehicle for power management purposes. First note that anytime additional electronics are added to a system, there are trade offs. This is especially true in high current power systems where a small change in resistance can have a noticeable impact on the system. Such is the case when adding additional power semiconductors to the current path between vehicle and battery. Figure 3-12 shows a picture of a battery isolation board on a Draganflyer quadrotor. This board was configured for vehicle electronics shutdown. The board consists of a single
Figure 3-8: UAV Hovering Over Recharge Landing Station During a Long Term Flight Test
Figure 3-10: Recharge Stations Built for Multi-agent UAV Mission Management Re-search
Figure 3-12: Battery Isolation Board Connected to 2000mAh Battery and Draganflyer Vehicle
P-channel power MOSFET acting as a diode that blocks current from flowing into the vehicle electronics during recharge. During flight, this MOSFET is on, allowing current to flow into the vehicle. Flights were conducted using the same Draganflyer vehicle and the same battery. Battery voltage measurements were collected during flight using the device described in Appendix A.
Flight results demonstrate that the addition of a P-channel MOSFET in the cur-rent path of the vehicle significantly degrades flight performance. Figure 3-14 shows flight data achieved without the isolation board. The Draganflyer vehicle flew for over 15 minutes. Figure 3-15 shows flight data recorded with the isolation board. In this experiment, the Draganflyer vehicle flew for about half the time. This is caused by the voltage drop associated with the internal resistance of the PFET. This addi-tional voltage drop reduces the power available to the quadrotor for flight. To get the necessary power for flight, the quadrotor must draw more current from the battery by increasing the collective command. Higher current counters the lower voltage in order to provide the power necessary for the vehicle to hover. However, this increased current also causes the battery to deplete faster.
The way to reduce the severity of this trade off is to reduce the voltage drop caused by the battery isolation board. Several possibilities exist to reduce the resistance that causes this undesirable voltage drop. N-channel MOSFETs have a lower on resistance than their P-channel brethren, generally about an order of magnitude lower. Using an N-channel MOSFET on the battery negative terminal reduces the voltage drop. However, sometimes it is unavoidable to use a P-channel MOSFET. For example, the battery isolation board with offboard power for vehicle electronics requires both P-channel and N-channel MOSFETs. In this situation, either a different P-channel MOSFET with a lower on resistance can be used, or several P-channel MOSFETs can be placed in parallel to create a lower equivalent resistance.
Regardless, the performance of a hybrid system will never exactly match that of the original vehicle design, assuming most things such as batteries and motors are the same. Anytime external electronics are added to a stock system, a trade off will be created.
Chapter 4
Mobile Recharge Platform
One application of multi-agent UAV technologies is convoy protection in a hostile environment. A coordinated team of surveillance and reconnaissance UAVs that operate from ground vehicles can provide a convoy with aerial information about the immediate vicinity of the vehicles. These vehicle could fly ahead to scout the path ahead or maintain a perimeter around the convoy to make sure no enemies are approaching.
In order to build a mobile recharge platform for UAVs, it is necessary to research the interaction between ground and aerial vehicles. Controllers must be designed to enable UAVs to land on ground vehicles. Recharge stations must be designed to sit on ground vehicles and allow for UAVs to recharge themselves between flights.
This chapter describes the beginnings of a UGV and UAV cooperative mission recharge platform for use with indoor UAV testbeds. Commercially available ground vehicles are used as the basis for the testbed’s UGVs. In addition, the UAV recharge system described in previous chapters was used in creating the mobile recharge landing platform.
4.1
COTS Unmanned Ground Vehicle
The Duratrax Mini Quake RC car was selected as the base COTS vehicle adapted for use into UGV mission management [10]. This vehicle was selected for a number
Figure 4-1: Miniquake UGV with Vicon Position System Reflectors
of reasons. It is small size and well suited for an indoor testbed environment. It is approximately 24 cm long, 19 cm wide, and 12 cm tall. It has a tight turning radius and can accelerate quickly. Despite the high quality of the vehicle’s mechanical components, the stock electronic speed controller lacks the ability to drive the vehicle at low velocities. It allows only two speeds: zero or maximum. Fortunately, this limitation can be avoided by replacing the stock electronics with custom electronics.
4.1.1
UGV Electronics
To provide greater velocity control to the Mini Quake vehicle, a custom set of elec-tronics were designed and incorporated into the base vehicle setup. Figure 4-2 shows a top view of the vehicle’s revised electronics. Note that all electronics fit underneath the vehicle top. The electronics schematic is shown in Figure 4-3. The electronics of the Mini Quake-based UGV are centered around an ATMEGA128 microcontroller on a Robostix board [6]. This microcontroller controls the velocity of the vehicle by
Figure 4-2: Miniquake UGV Electronics
generating a PWM signal. This signal is sent from the microcontroller to a National Semiconductor LMD18200 H-bridge. The H-bridge chip amplifies the PWM velocity signal from the microcontroller and applies this amplified power signal to the motor. The H-bridge also allows the microcontroller to determine the direction of motor ro-tation, allowing the vehicle to drive both forwards and backwards. Power is supplied by a three cell lithium polymer battery. Additionally, the microcontroller produces a second PWM signal to control the vehicle steering servo. This signal is applied directly to the servo.
Wireless connectivity between the ground vehicle and the control computer is pro-vided by a Tmote Sky [13]. This device uses an IEEE 802.15.4 radio to communicate with other 802.15.4 devices. One Tmote is connected to the vehicle control computer and one is onboard the UGV, connected to the ATMEGA128 microcontroller through a UART link.
4.1.2
Controller Design
For vehicle velocity and steering controllers, simple PID control was used. The PID gains of these controllers were determined experimentally. For steering control, a simple waypoint follower was designed. Steering error was computed by subtracting the desired heading from the current heading of the vehicle. Desired heading is taken to be the heading that points from the vehicle’s current position directly toward the next waypoint. The geometry of the heading error calculation is slightly different in each quadrant. Figures 4-4 to 4-7 show the geometry of the heading error calculation in each of the quadrants. The equations for each quadrant’s steering error calculation are also outlined below.
First quadrant heading error equations:
d = q(xcar− xwp)2+ (ycar− ywp)2 (4.1)
α = arcsinxcar− xwp
d (4.2)
Figure 4-4: First Quadrant Heading Error Geometry
η = θ − ϕ (4.4) if(η < −180) then (ην = η + 360) (4.5)
Second quadrant heading error equations:
d = q(xcar − xwp)2+ (ycar− ywp)2 (4.6) α = arcsinxwp− xcar d (4.7) θ = 180 − α (4.8) η = θ − ϕ (4.9) if(η > 180) then(ην = η − 360) (4.10)
Third quadrant heading error equations:
d = q(xcar− xwp)2+ (ycar− ywp)2 (4.11)
θ = arcsinxwp− xcar
d (4.12)
η = θ − ϕ (4.13)
if(η > 180) then (ην = η − 360) (4.14)
Fourth quadrant heading error equations:
d = q(xcar− xwp)2+ (ycar− ywp)2 (4.15) θ = arcsinxcar− xwp d (4.16) η = θ − ϕ (4.17) if(η < −180) then (ην = η + 360) (4.18)
4.1.3
Results
The ground vehicles described above were tested using the ACL’s RAVEN system. This robotic testing environment uses multiple cameras and vision processing to cal-culate the positions of the ground vehicles in real time [22]. This real-time data is
Figure 4-6: Third Quadrant Heading Error Geometry
then processed and used to compute the necessary control commands to move the ground vehicles between waypoints at a desired velocity. The control commands are transmitted to the vehicles using a Tmote Sky 802.15.4 wireless device plugged into the USB port of a control computer.
Figure 4-8 shows results of the UGV driving in a box pattern. The car was traveling in a counterclockwise direction. As the UGV reached a waypoint, the UGV would be assigned the next waypoint in the sequence. By rearranging the order of the waypoints, the UGV drove a figure eight path, shown in Figure 4-9.
4.2
Mobile Recharge Vehicle
There are several components needed in order to create a mobile recharge vehicle. First, a landing station is needed to recharge batteries of small, battery-powered UAVs. The fully-autonomous recharge station described in the previous chapter will serve this purpose. Next, a moving platform large enough to carry the recharge landing system is needed. For this role, an ActivMedia Pioneer 2 ground robot was selected because of its large size and payload capacity. The ground vehicle is about fifty centimeters by fifty centimeters and can carry a payload of forty kilograms. The final component needed for a mobile recharge system is an aerial vehicle outfitted with recharge modification. The battery-powered UAVs described in Chapter 3 of this thesis will work in this role.
4.2.1
Configuration of the Mobile Recharge Vehicle
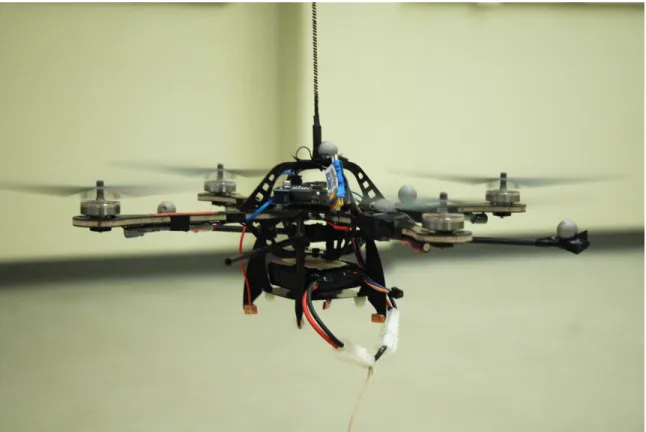
The construction of the mobile recharge vehicle is very simple. A recharge landing station and power supply are placed on top of an ActivMedia Pioneer 2 ground vehicle and secured with extra-duty, exterior double-sided tape. This strong tape is needed so that the landing pad does not slide around on the top of the ground vehicle. A shift between the ground vehicle and landing pad would throw off the calibration of the vehicle and prevent UAVs from landing correctly in the recharge station. Figure 4-10 shows the recharge station sitting on top of the ground vehicle. Power is provided
to the recharge station using a power extension cable. Communication between the vehicle and control computers is accomplished over two RS-232 serial cables, one for ground vehicle movement commands and one for the recharge station. The serial cable and the power cord from the power supply tether the mobile recharge vehicle to a home base location from which it cannot roam more than 4 meters away.
4.2.2
Results
The results presented in this section were accomplished using the MIT ACL RAVEN system. The ground vehicle was placed within the test environment with a quadrotor UAV. The quadrotor was commanded to take off and fly over to the location of the mobile recharge station. Once the quadrotor was in the air, a human operator commanded the mobile recharge vehicle to begin moving forward. The quadrotor maintained position above the moving ground vehicle during its descent into the landing pad. Once the quadrotor had landed and shut down its motors, a human operator stopped the mobile recharge vehicle. The recharge station then charged the quadrotor vehicle battery.
Figure 4-11 shows four pictures of the mobile recharge station landing test. As the mobile recharge vehicle moved across the room, the quadrotor landing controller made sure to keep the UAV above the recharge pad during descent in the mobile station. Figure 4-12 shows an X-Y plot of the quadrotor vehicle taking off from the ground, flying over to the location of the mobile recharge vehicle, and following the vehicle as it moves across the room. Figure 4-13 shows the quadrotor’s height from takeoff to landing in the recharge landing pad on the mobile recharge vehicle. Once the quadrotor had landed and the mobile recharge platform had stopped moving, the recharge station began charging the quadrotor battery. Data from the recharge process can be found in Figure 4-14. This process was repeated five times, with a successful recharge landing occurring each time.
(a) (b)
(c) (d)
Figure 4-13: Plot of Quadrotor Height over Time from Takeoff to Landing on Mobile Recharge Platform
Chapter 5
Conclusion and Future Work
This thesis describes the design, testing, construction, and usage of the first fully autonomous recharge system for small, battery-powered UAVs. This system was used to perform the first quadrotor UAV twenty-four hour autonomous long-term flight test and to conduct multi-agent UAV mission management research. In addition, this thesis describes the first UAV mobile recharge platform. This system was used to conduct the first UAV mobile recharge landing.
5.1
Future Work
There are many improvements that can be made to enhance the capabilities of the recharge system described in this thesis. The fast recharge design considerations outlined in Appendix B can be used to create a fast recharge system for small, battery-powered UAVs. This fast recharge system will make these UAVs more productive during mission management research experiments. Fewer UAVs will be necessary to run missions such as persistent surveillance. Additionally, adaptive machine learning algorithms can be integrated into the recharge system to provide a prediction of recharge time remaining. This prediction could also be used by mission management software to make better decisions about resource management and allocation.
Improvement to the mobile recharge platform can be made by integrating the UGV electronics and controller to make the mobile recharge platform itself an autonomous
UGV. This autonomous mobile recharge platform could then be used for mission management scenarios involving UGV convoys. Further improvement to the UGVs described in this thesis can be had by build recharge stations for UGVs so they can operate for long periods of time without human operator intervention to recharge batteries. This would allow UGVs and UAVs to operate together in long-term mission scenarios.
Appendix A
Supplemental Electronics
The electronics described in this section were used by researchers in the Aerospace Controls Laboratory to support testing being performed on the RAVEN platform. An RC Control Capture device was designed and constructed to assist with vehicle system identification and controller design. Also, a voltage measurement tether was designed and constructed to provide in-flight battery voltage measurements for the design of battery monitoring algorithms.
A.1
RC Control Transmission Capture
In order to support system identification efforts, it is useful to record a system’s re-sponse to control inputs. For RC vehicles piloted manually using an RC transmitter, it is difficult to measure the control commands being issued by a human pilot. As shown in Figure A-1, we developed a device that creates a universal method of in-tercepting RC commands for System ID purposes. The device works by receiving RC commands using a standard RC receiver. The Pulse-Position-Modulation (PPM) signal from this receiver is then processed by a microcontroller and transmitted over a serial link to a computer that stores the data.
A PPM signal encodes several channels of servo control signals into a single signal. This multiplexing of servo signals is what allows RC transmitters to control several servos over a single RF channel. PPM signals are structured into frames. Figure A-2
Figure A-1: RC Control Transmission Capture Device
Figure A-3: RC Signal Capture Device Schematic
shows the structure of a PPM frame. Each servo channel is separated by a constant length high pulse. The time separation between these pulses represents servo channel signals. Since servo pulses range from 1ms to 2ms, the maximum time separation between high pulses is 2ms. Separation between frames is achieved using a synchro-nization low pulse. This low pulse is much longer than the low pulses that encode the servo frames, therefore allowing the receiver electronics to differentiate between these two low pulses.
The capture device uses an ATMEGA128 microcontroller on a Robostix board to digitize the analog servo pulses in the PPM signal [6]. Figure A-3 shows the schematic of the capture device. The Futaba R148DF receiver used by the capture device outputs a PPM signal with a high voltage level of 3.3V. Since the ATMEGA128 microcontroller uses a high TTL voltage of 5V, it is necessary to amplify the PPM signal up to TTL levels. An LT1008 opamp provides this amplification. The amplified PPM signal from the LT1008 is connected to two of the ATMEGA128’s external interrupts.
The ATMEGA128 uses three interrupts to digitize the PPM signal. Two external interrupts are needed in order to differentiate between the rising and falling edges of a pulse. A timer interrupt is used both to find the synchronization pulse between frames and to measure the analog time delay between pulses for each servo channel.
The flow diagram in Figure A-4 shows how the ATMEGA128 captures and digitizes the PPM signal.
Character ASCII Code Command 1 0x31 Capture Single Frame of Data 2 0x32 Continuously Capture Data 3 0x33 Stop Capturing Data Table A.1: Capture Device Command Codes
The capture device is connected to an external computer using a USB-to-TTL serial cable. The device is commanded by sending alphanumeric characters over the serial connection. The protocol consists of three commands. To capture and output a single frame’s data, a “1” character is sent to the capture device over the serial line. To continuously capture and output data, a “2” is sent. A “3” stops the continuous capture process. Table A.1 summarizes this command protocol. The capture device response is a series of alphanumeric characters that represent the length of each servo channel pulse. Each data value is separated by a space character. Each string of data represents one captured frame and is terminated with a newline character. Table A.2 shows example output for a single captured frame with seven channels. Figure A-5 shows a plot of a single channel’s data over time. This data represents the relative movement of the transmitter stick in the hands of a human operator. Data for other channels can be plotted in a similar manner.
Number of Channels CH1 CH2 CH3 CH4 CH5 CH6 CH7 7 0x3F57 0x41AB 0x3F59 0x41C9 0x1F46 0x4586 0x3E29
Table A.2: Format of Capture Device Output
A.2
Quadrotor In-flight Battery Voltage
Measure-ment
In order to build battery performance models and analyze the effects of recharge modifications to vehicles, we developed a device that records battery voltage during
Figure A-5: Captured Data from One Channel Showing Transmitter Stick Motion Over Time
Figure A-6: Flight Testing with Voltage Measurement Device
UAV flight operations. As shown in Figure A-6, the device connects to vehicles through a tether in order to measure battery voltage during flight testing. The voltage measurement device consists of an ATMEGA128 microcontroller, a voltage divider, a tether, and a battery harness. The harness, shown in Figure A-7, connects to the battery being measured and to the vehicle electronics. In addition, this battery harness is attached a tether that runs down from the vehicle to a voltage divider circuit, shown in Figure A-8. The voltage divider steps down the battery voltage to a range that is readable by the analog to digital conversion circuitry built into the ATMEGA128 microcontroller. The divider consists of three equal sized resistors that divide the battery voltage by a factor of three. Voltage data is collected by the ATMEGA128 microcontroller and transmitted out its TTL serial port. Any computer can be connected to the microcontroller using either a RS232-to-TTL or USB-to-TTL serial cable. As soon as the microcontroller is powered up, it begins transmitting voltage data. Figure A-9 shows a block diagram of this system, while
Figure A-7: Voltage Measurement Harness
Figure A-10 shows an electrical schematic. Battery voltage data taken during a flight is shown in Figures 3-14 and 3-15.
Figure A-8: Voltage Measurement Device
Appendix B
Fast Recharge
The ground electronics presented in this thesis are sufficient to perform safe recharge on modern lithium polymer batteries at rates up to 1C. Charging multi-cell batteries at rates faster than 1C with this recharge system runs the risk of creating imbalance between battery pack cells. This imbalance can lead to overvoltage situations in battery packs that prematurely degrade the pack and possibly cause it to explode. In order to address such safety concerns, a cell balancer must be integrated with the charging system to allow for the fast recharge of batteries.
B.1
Cell Balancing
Various methods of balancing the cells within a battery pack exist [12]. The simplest and most cost effective of these methods is the passive balancing method. Here, the cell balancer is made up of a bank of resistors used to bleed energy from cells that have a higher voltage than the others, thus maintaining all cells at approximately the same voltage level. This ensures that no cell reaches an overvoltage state, which could result in the rapid degradation or rupture of that cell. Cell balancers must be connected to all of the battery’s cell terminals, even the ones internal to the battery. For three-cell lithium polymer batteries, there are four such voltage nodes: two external battery terminal nodes and two internal to the battery.