arXiv:nucl-ex/0701068v2 30 Jan 2007
A. Danagoulian,1V. H. Mamyan,2, 3 M. Roedelbronn,1 K. A. Aniol,4 J. R. M. Annand,5 P. Y. Bertin,6
L. Bimbot,7 P. Bosted,8 J. R. Calarco,9 A. Camsonne,6 C. C. Chang,10 T.-H. Chang,1 J.-P. Chen,3
Seonho Choi,11 E. Chudakov,3 P. Degtyarenko,3 C. W. de Jager,3 A. Deur,12 D. Dutta,13 K. Egiyan,2, ∗
H. Gao,13 F. Garibaldi,14 O. Gayou,15R. Gilman,3, 16 A. Glamazdin,17 C. Glashausser,16 J. Gomez,3
D. J. Hamilton,5 J.-O. Hansen,3 D. Hayes,18 D. W. Higinbotham,3 W. Hinton,18 T. Horn,10 C. Howell,13
T. Hunyady,18 C. E. Hyde-Wright,18 X. Jiang,16 M. K. Jones,3 M. Khandaker,19 A. Ketikyan,2
V. Koubarovski,20 K. Kramer,15 G. Kumbartzki,16 G. Laveissi`ere,6 J. LeRose,3 R. A. Lindgren,12
D. J. Margaziotis,4 P. Markowitz,21 K. McCormick,18 Z.-E. Meziani,11 R. Michaels,3 P. Moussiegt,22
S. Nanda,3 A. M. Nathan,1 D. M. Nikolenko,23 V. Nelyubin,24 B. E. Norum,12 K. Paschke,8L. Pentchev,15
C. F. Perdrisat,15 E. Piasetzky,25 R. Pomatsalyuk,17 V. A. Punjabi,19 I. Rachek,23 A. Radyushkin,3, 18
B. Reitz,3 R. Roche,26 G. Ron,25 F. Sabati´e,18 A. Saha,3 N. Savvinov,10 A. Shahinyan,2 Y. Shestakov,23
S. ˇSirca,27 K. Slifer,11 P. Solvignon,11 P. Stoler,20 S. Tajima,13 V. Sulkosky,15 L. Todor,18 B. Vlahovic,28
L. B. Weinstein,18 K. Wang,12 B. Wojtsekhowski,3 H. Voskanyan,2H. Xiang,27 X. Zheng,27 and L. Zhu27
(The Jefferson Lab Hall A Collaboration)
1University of Illinois, Urbana-Champaign, IL 61801 2Yerevan Physics Institute, Yerevan 375036, Armenia
3Thomas Jefferson National Accelerator Facility, Newport News, VA 23606 4California State University Los Angeles, Los Angeles, CA 90032
5University of Glasgow, Glasgow G12 8QQ, Scotland, U.K. 6Universit´e Blaise Pascal/IN2P3, F-63177 Aubi`ere, France
7IPN Orsay B.P. n◦1 F-91406, Orsay, France 8University of Massachusetts, Amherst, MA 01003 9University of New Hampshire, Durham, NH 03824 10University of Maryland, College Park, MD 20742
11Temple University, Philadelphia, PA 19122 12University of Virginia, Charlottesville, VA 22901 13Duke University and TUNL, Durham, NC 27708
14INFN, Sezione di Sanit´a and Institute Superiore di Sanit´a , I-00161 Rome, Italy 15College of William and Mary, Williamsburg, VA 23187
16Rutgers, The State University of New Jersey, Piscataway, NJ 08854 17Kharkov Institute of Physics and Technology, Kharkov 61108, Ukraine
18Old Dominion University, Norfolk, VA 23529 19Norfolk State University, Norfolk, VA 23504 20Rensselaer Polytechnic Institute, Troy, NY 12180 21Florida International University, Miami, FL 33199
22Institut des Sciences Nucleiares, CNRS-IN2P3, F-38016 Grenoble, France 23Budker Institute for Nuclear Physics, Novosibirsk 630090, Russia 24St. Petersburg Nuclear Physics Institute, Gatchina, 188350, Russia
25Tel Aviv University, Tel Aviv 69978, Israel 26Florida State University, Tallahassee, FL 32306 27Massachusetts Institute of Technology, Cambridge, MA 02139
28North Carolina Central University, Durham, NC 27707
(Dated: August 24, 2018)
Cross-section values for Compton scattering on the proton were measured at 25 kinematic settings over the range s = 5 – 11 and -t = 2 – 7 GeV2with statistical accuracy of a few percent. The scaling
power for the s-dependence of the cross section at fixed center of mass angle was found to be 8.0±0.2, strongly inconsistent with the prediction of perturbative QCD. The observed cross-section values are in fair agreement with the calculations using the handbag mechanism, in which the external photons couple to a single quark.
PACS numbers: 13.60.Fz,24.85.+p
Compton scattering in its various forms provides a unique tool for studying many aspects of hadronic struc-ture by probing it with two electromagnetic currents. For real Compton scattering (RCS) in the hard scattering
regime, where all Mandelstam variables s, −t, and −u are larger than the Λ2
QCD scale, the short-distance
dom-inance is secured by the presence of a large momentum transfer. In this regime, RCS probes the fundamental
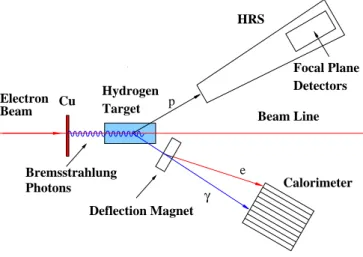
Beam Line Detectors Focal Plane Cu HRS γ e p Hydrogen Target Bremsstrahlung Photons Electron Beam Calorimeter Deflection Magnet
FIG. 1: Schematic layout of the present experiment.
quark-gluon degrees of freedom of quantum chromody-namics (QCD), providing important information for the tomographic imaging of the nucleon.
The only data for RCS in the hard scattering regime were obtained 25 years ago by the pioneering Cornell ex-periment [1]. The cross section dσ/dt at fixed θcm was
found to scale with 1/sn with n ≈ 6, exactly as
pre-dicted by perturbative QCD [2], in which the reaction is mediated by the exchange of two hard gluons [3]. Nev-ertheless, the experimental cross section was at least 10 times larger than those predicted by perturbative QCD. More recently, calculations of RCS have been performed within a handbag dominance model [4, 5], in which the external photons couple to a single quark, which couples to the spectator particles through generalized parton dis-tributions (GPDs) [6]. These calculations are rather close to the Cornell cross section data. The uncertainty in ap-plicability of perturbative QCD and the possible domi-nance of the handbag mechanism were reinforced by a re-cent measurement of the longitudinal polarization trans-fer parameter KLL in the reaction H(~γ, ~pγ) [7], which is
in fair agreement with the handbag prediction [8] and in unambiguous disagreement with the perturbative QCD prediction [3]. The present experiment was designed to test more stringently the reaction mechanism by improv-ing the statistical precision and extendimprov-ing the kinematic range of the Cornell data. These new measurements, with much improved accuracy in the scaling parameter n, allow unambiguous conclusions about the applicability of perturbative QCD.
The experiment, shown schematically in Fig. 1, was performed in Hall A of Jefferson Lab, with basic instru-mentation described in Ref. [9]. A 100% duty-factor electron beam with current up to 40 µA and energy 2.34, 3.48, 4.62, or 5.75 GeV was incident on a 0.81-mm thick Cu radiator. The mixed beam of electrons and bremsstrahlung photons was incident on a 15-cm liquid H2 target, located 10 cm downstream of the radiator,
The scattered photon was detected in a calorimeter con-sisting of 704 lead-glass blocks (4 × 4 × 40 cm3) placed
5-18 m from the target and subtending a solid angle of 30-60 msr, with a typical position resolution of 1 cm and energy resolution σE/E = 5 − 10%. The
associ-ated recoil proton was detected in one of the Hall A High Resolution Spectrometers (HRS), with a solid angle of 6.5 msr, momentum acceptance of ±4.5%, relative mo-mentum resolution of 2.5 × 10⁻⁴, and angular resolution
of 2.4 mrad, the latter limited principally by scattering in the target. The central momentum of the HRS was set to detect protons corresponding to incident photons with mean energies approximately 90% of the electron beam energy. The trigger was formed from a coincidence between a signal from a scintillator counter in the HRS focal plane and a signal in the calorimeter corresponding to an energy deposition greater than half the expected photon energy from the RCS process.
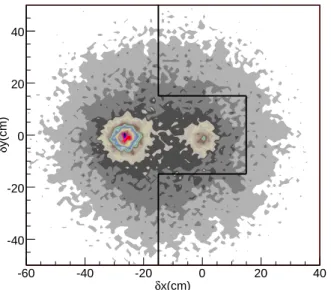
Potential RCS events were within a ∼ 30 ns coinci-dence time window and were selected based on the kine-matic correlation between the scattered photon and the recoil proton. The excellent HRS optics was used to re-construct the momentum vector and reaction vertex of the recoil proton, to determine the energy of the inci-dent photon, and to calculate the expected direction of an RCS photon. The quantities δx and δy are the differ-ence of horizontal and vertical coordinates, respectively, between the expected and measured location of the de-tected photon on the front face of the calorimeter. An example of the distribution of events in the δx-δy plane is shown in Fig. 2. The RCS events, which are in the peak at δx = δy = 0, lie upon a continuum background primarily from the γp → π◦p reaction, with the
subse-quent decay π◦ → γγ. An additional background is due
to electrons that lose energy in the radiator and subse-quently undergo ep elastic scattering, which is kinemati-cally indistinguishable from RCS. A magnet between the target and the calorimeter (see Fig. 1) deflects these elec-trons horizontally, so their coordinates on the front face of the calorimeter are shifted by 20-30 cm relative to undeflected RCS photons. These ep events are clearly separated from the RCS events, as shown in Fig. 2. By making the coplanarity cut |δy| 6 15 cm, then projecting onto the δx axis, one obtains the δx-distribution shown in Fig. 3. The curve is a calculation of the π◦continuum
background, which is determined by two methods. In the first method, a Monte Carlo simulation of the experiment was used to determine the acceptance of the combined HRS-calorimeter system in the variables of the incident photon energy and the momentum transfer, and to determine the shape of π◦ contribution in Fig. 3 [10].
The simulation utilized a thick-target bremsstrahlung code to calculate the incident photon spectrum [11]; an event generator for the RCS, γp → π◦p, and e p → e p
pro-x(cm) δ -60 -40 -20 0 20 40 y(cm) δ -40 -20 0 20 40
FIG. 2: Distribution of photon-proton coincidence events in δx-δy space, as defined in the text, for the measurement at s = 6.79, t = −3.04 GeV2. The peaks near δx = δy = 0
and δx = −25 cm, δy = 0 originate from the RCS and ep events, respectively. The continuum events are photons from π◦photoproduction. The events to the right of the solid line
are used to normalize the π◦events yield in the Monte Carlo
simulation.
tons through the HRS. The acceptance simulation and analysis procedures were checked by using elastic elec-tron scattering data from dedicated H(e, e′p) runs with
the Cu radiator removed. It was verified that the sim-ulation correctly accounts for the distribution of proton recoil events in momentum, angles, and reaction vertex across the acceptance of the HRS [13] and that the data from the present experimental setup reproduce to better than 3% the known ep elastic scattering cross section [14]. To determine the π◦ background, the simulated
distribu-tion of π◦ events is normalized to the number of actual
events in regions of δx-δy space that are free of RCS and ep events (see Fig. 2), then used to calculate the curve in Fig. 3. The tight kinematic constraints of our co-incidence geometry preclude contributions from heavier mesons, such as η’s. Subtracting the curve from the data, then integrating over the region of δx shown in Fig. 3, the “raw” RCS cross section is determined. As a byproduct of this analysis, we have obtained cross sections for the p(γ, π◦)p reaction, which will be presented in a separate
publication.
The second method of analysis uses only a central (∼ 35%) portion of the the calorimeter front face to guar-antee that the combined acceptance of the experiment is defined by the photon arm acceptance [15]. Events were selected in a narrow energy range, 100-200 MeV, in which the incident photon spectrum had the expected 1/Eγ
shape. The shape of the δx-distribution of the π◦events
x(cm) δ -60 -50 -40 -30 -20 -10 0 10 20 30 40 Counts 0 200 400 600 800 1000 1200 1400 RCS ep
FIG. 3: The δx-distribution for a coplanarity cut |δy| 6 15 cm, with the RCS and ep peaks indicated. The curve is a distribution of the continuum π◦ events. The vertical
dashed lines show the cuts used to calculate the number of RCS events.
in Fig. 3 was obtained by interpolation of a polynomial fit to the event distribution in the region 15 6 |δy| 6 30 cm of Fig. 2. The total π◦ yield was normalized to the
re-gions δx > 10 cm and |δx + 10 cm| 6 3 cm in Fig. 3. As with the Monte Carlo method, subtracting the π0
background and integrating over δx obtains the raw RCS cross section, with reduced statistical precision. The two methods agreed to approximately 5%. The Monte Carlo technique was used for the final cross-section values while the reduced acceptance technique was used to estimate the contribution of acceptance and π0background to the
systematic error.
Two additional corrections were applied to obtain the RCS cross section. The first correction deals with the kinematically correlated pγ background events from the epγ process, in which an elastically scattered electron emits a hard photon due to internal and external radia-tion in the target and surrounding material and the pho-ton (but not the electron) is detected in the calorimeter. These background events fall in the δx=0 peak in Fig. 3 and are distinguishable from RCS events by Ecalo, the
photon energy measured in the calorimeter. To deter-mine the background from these events, a semi-empirical technique was used.
First the shape of the photon energy spectrum, in which an elastically scattered electron radiates a hard photon in the material between the reaction vertex and the deflection magnet, was found from the Monte Carlo simulation, which includes all details of the experimental setup. Then the shape was normalized to fit the observed distribution in the Ecalospectrum below the RCS peak.
similar procedure was applied to the electron scattering data taken with the radiator removed to obtain another normalization. The epγ/RCS ratio ranges from < 0.01 at backward angles to as much as 0.90 at forward angles. Nevertheless, the two normalizations result in RCS cross sections that agree to within a statistical accuracy of 7% in the worst case but more typically to within 2%. This procedure was cross-checked against a direct calculation of the background, using the peaking approximation [16] to estimate the internal radiation contribution and found to be in excellent agreement.
The second correction is due to quasi-real photons from the H(e, pγ)e′ reaction and is taken into account in the
calculation of the incident photon flux. The reaction is simulated with our Monte Carlo, using the spectrum of quasi-real photons calculated according to the method of Ref. [17]. Although the scattered electron is not detected, the kinematic cuts on the HRS and calorimeter, partic-ularly the δx and δy cuts, place stringent constraints on the virtuality of the photon. We find that the quasi-real photons have a mean Q2 = 0.14 × 10⁻³ GeV2 and
con-tribute in the range 11-15% to the total incident photon flux, depending on the kinematic point.
The resulting RCS cross-section values and statistical uncertainties are summarized in Table I. The systematic uncertainties have correlated contributions from the ac-ceptance (5%) and the real and virtual bremsstrahlung flux uncertainty (3%) and typical point-to-point contri-butions from the π◦ subtraction (3%) and the epγ
back-ground subtraction (2%).
The cross-section data are presented in Fig. 4 along with the previous Cornell data [1], which have been scaled to the s values of the present experiment using the scaling power n = 8, as discussed below, and plotted at the −t value corresponding to the original θcm. The curves are
) 2 -t (GeV 0 2 4 6 8 ) 2 /dt (nb/GeV σ d -4 10 -2 10 1 2 10 JLab Cornell 10 1 × 10 × 2 s = 11. GeV 2 s = 8.9 GeV 2 s = 6.8 GeV
FIG. 4: Cross section of RCS process vs. transfer momentum t at three values of s. Full points and open points are data from the present and Cornell experiments [1], respectively.
TABLE I: Cross section of proton Compton scattering. The mean values of invariants s, t and their standard deviation are in GeV2. The scattering angle in the center-of-mass system
and its standard deviation are in degrees. The bin widths of all quantities are the total spread in values over the acceptance of the detectors. The cross section (dσ/dt) and its statistical error are in nb/GeV2.
s ∆s −t ∆t θcm ∆θ dσ/dt ∆dσ/dt 4.82 0.56 1.65 0.05 90.0 1.0 6.37 0.18 4.82 0.56 2.01 0.06 104.4 1.3 4.59 0.13 4.82 0.56 2.60 0.08 127.9 1.8 2.18 0.05 6.79 0.56 1.96 0.05 76.3 0.8 0.815 0.040 6.79 0.56 2.54 0.06 89.2 1.0 0.251 0.027 6.79 0.56 3.04 0.07 100.5 1.1 0.226 0.018 6.79 0.56 3.70 0.08 115.9 1.3 0.282 0.009 6.79 0.56 4.03 0.08 124.5 1.3 0.291 0.009 6.79 0.56 4.35 0.09 133.7 1.4 0.304 0.011 8.90 0.84 2.03 0.05 64.0 0.8 0.3970 0.0211 8.90 0.84 2.57 0.06 73.2 0.8 0.1109 0.0078 8.90 0.84 3.09 0.07 81.6 0.9 0.0619 0.0055 8.90 0.84 3.68 0.08 91.0 1.1 0.0348 0.0029 8.90 0.84 4.38 0.09 102.3 1.1 0.0257 0.0028 8.90 0.84 5.03 0.09 113.1 1.2 0.0320 0.0035 8.90 0.84 5.48 0.10 121.0 1.2 0.0477 0.0031 8.90 0.84 5.92 0.10 129.8 1.2 0.0641 0.0042 10.92 0.94 2.61 0.08 65.3 0.9 0.0702 0.0063 10.92 0.94 3.18 0.09 71.9 0.9 0.0317 0.0047 10.92 0.94 3.73 0.10 79.0 1.0 0.0156 0.0026 10.92 0.94 4.41 0.12 87.5 1.1 0.0095 0.0011 10.92 0.94 5.03 0.14 94.1 1.2 0.0071 0.0007 10.92 0.94 5.44 0.14 100.3 1.3 0.0058 0.0009 10.92 0.94 5.93 0.16 106.6 1.3 0.0046 0.0006 10.92 0.94 6.46 0.19 113.6 2.1 0.0056 0.0007
theoretical predictions calculated with the handbag dia-gram. The solid curves are calculations using the GPDs approach [8], in which a photon-parton subprocess is cal-culated to next-to-leading order in αsand a model of the
GPDs is based on the known parton distribution func-tions and the nucleon electromagnetic form factors. The widths of the shaded areas indicate the uncertainties due to the mass uncertainties in the hard subprocess [18]. The dashed curves are also based on the handbag dia-gram [19], using the constituent quark model to calcu-late the hard subprocess and quark wave functions ad-justed to fit existing data for the nucleon
electromag-netic form factors. Both sets of curves cover a limited range in −t because the calculations based on the hand-bag mechanism are valid only for s, −t, −u larger than approximately 2.5 GeV2. Over that range they are in
good agreement with the data.
(deg) cm θ 60 80 100 120 ) cm θ n ( 4 5 6 7 8 9
FIG. 5: Scaling of the RCS cross section at fixed θcm. Open
points are results from Cornell experiment [1]. Closed points are results from the present experiment. The line at n = 6 is the prediction of asymptotic perturbative QCD, while the shaded area shows the fit range obtained from the cross sections of GPDs-based handbag calculation [8].
It is interesting to examine the scaling of the cross sec-tions with s at fixed θcm, where the perturbative QCD
mechanism predicts dσ/dt = f (θcm)/sn with n = 6 [2].
The scaling power n(θcm) was extracted from the present
data by using results from the three largest values of s = 6.79, 8.90, and 10.92 GeV2. A cubic spline
interpo-lation was applied to the angular distribution for each s to determine the cross section at fixed angles. The values of n(θcm) are plotted in Fig. 5 along with points
from the Cornell experiment. The present experimental points imply a mean value n = 8.0 ± 0.2, unequivocally demonstrating that the perturbative QCD mechanism is not dominant in the presently accessible kinematic range. The power obtained from a fit to GPDs-based handbag cross sections [8] are shown as the dashed lines for two different assumptions about the masses in the hard sub-process [18]. The present data should help refine the model used for the GPDs.
In summary, the RCS cross section from the proton was measured in range s = 5 − 11 GeV2 at large momentum
transfer. Calculations based on the handbag diagram are in good agreement with experimental data, suggest-ing that the reaction mechanism in the few GeV energy range is dominantly one in which the external photons
couple to a single quark. The fixed-θcm scaling power is
considerably larger than that predicted by perturbative QCD.
We thank P. Kroll, J. M. Laget, and G. Miller for pro-ductive discussions, and acknowledge the Jefferson Lab staff for their outstanding contributions. This work was supported the US Department of Energy under contract DE-AC05-84ER40150, Modification No. M175, under which the Southeastern Universities Research Associa-tion (SURA) operates the Thomas Jefferson NaAssocia-tional Accelerator Facility. We acknowledge additional grants from the U.S. National Science Foundation, the UK Engi-neering and Physical Science Research Council, the Ital-ian INFN, the French CNRS and CEA, and the Israel Science Foundation.
∗ Deceased
[1] M. A. Shupe et al., Phys. Rev. D 19, 1921 (1979). [2] S. J. Brodsky and G. Farrar, Phys. Rev. Lett. 31,
1153 (1973); V. A. Matveev, R. M. Muradyan, and A. V. Tavkheldize, Lett. Nuovo Cimento 7, 719 (1973). [3] A. S. Kronfeld and B. Nizic, Phys. Rev. D 44, 3445
(1991); M. Vanderhaeghen, P. A. M. Guichon, and J. Van de Wiele, Nucl. Phys. A622, c144 (1997); T. Brooks and L. Dixon, Phys. Rev. D 62 114021 (2000); R. Thomson, A. Pang, and C. Ji, Phys. Rev. D 73, 054023 (2006).
[4] A.V. Radyushkin, Phys. Rev. D 58, 114008 (1998). [5] M. Diehl, T. Feldmann, R. Jakob, P. Kroll, Eur. Phys. J.
C8, 409 (1999).
[6] M. Diehl, T. Feldmann, R. Jakob, P. Kroll, Eur. Phys. J. C39, 1 (2005).
[7] D. J. Hamilton et al., Phys. Rev. Lett. 94, 242001 (2005). [8] H. W. Huang, P. Kroll, T. Morii, Eur. Phys. J. C23, 301 (2002); C31, 279 (2003); H. W. Huang (private commu-nication).
[9] J. Alcorn et al., Nucl. Instr. Meth. A522, 294 (2004). [10] A. Danagoulian, Ph.D. Dissertation, University of
Illi-nois, 2006 (unpublished).
[11] J. L. Matthews and R. O. Owens, Nucl. Instr. Meth. 111, 157 (1973).
[12] J. Arrington,
http://www.jlab.org/~johna/SIMC_documents/simc [13] A. Danagoulian et al., Nucl. Phys. A755, 281c (2005). [14] J. Arrington, Phys. Rev. C 69, 022201(R) (2004). [15] V. Mamyan, Ph.D. Dissertation, Yerevan Physics
Insti-tute, 2005 (unpublished).
[16] R. Ent et al., Phys. Rev. C 64, 054610 (2001). [17] V. M. Budnev et al., Phys. Rep. 15C, 181 (1975). [18] M. Diehl et al., Phys. Rev. D 67, 037502 (2003). [19] G. A. Miller, Phys. Rev. C 69, 052201(R) (2004).
![FIG. 4: Cross section of RCS process vs. transfer momentum t at three values of s. Full points and open points are data from the present and Cornell experiments [1], respectively.](https://thumb-eu.123doks.com/thumbv2/123doknet/14003837.456181/4.918.473.845.295.926/section-process-transfer-momentum-present-cornell-experiments-respectively.webp)
![FIG. 5: Scaling of the RCS cross section at fixed θ cm . Open points are results from Cornell experiment [1]](https://thumb-eu.123doks.com/thumbv2/123doknet/14003837.456181/5.918.85.435.283.521/scaling-cross-section-fixed-points-results-cornell-experiment.webp)
